XRP saw a 1.5% price increase over the past 24 hours as the coin trades at %excerpt%.215.The cryptocurrency is straddling the 100-day EMA as it battles to remain above it.Against Bitcoin, XRP set a fresh 2-year low as it reaches the 2300 SAT level.Key Support & Resistance LevelsXRP/USD:Support: %excerpt%.21, %excerpt%.20, %excerpt%.192.Resistance: %excerpt%.226, %excerpt%.235, %excerpt%.24.XRP/BTC:Support: 2258 SAT, 2225 SAT, 2220 SAT.Resistance: 2360 SAT, 2400 SAT, 2455 SAT.XRP/USD: Ripple Trapped Between 200-days and 100-days EMAsXRP is currently trading sideways between the 200-days EMA and the 100-days EMA. It is battling to remain above the 100-days EMA at %excerpt%.21 and is also rejected any time it attempts to break the 200-days EMA at %excerpt%.226.The bullish momentum has been fading throughout May. However, the buyers are still fighting to
Topics:
Yaz Sheikh considers the following as important: Ripple (XRP) Price, XRP Analysis, xrpbtc, xrpusd
This could be interesting, too:
Dimitar Dzhondzhorov writes Top Ripple (XRP) Price Predictions as of Late
Chayanika Deka writes What Does MDIA Tell Us About XRP, DOGE, and BTC’s Upcoming Trends?
CryptoVizArt writes Ripple Price Analysis: Where Is XRP Headed Following Massive Crash and Swift Rebound?
Jordan Lyanchev writes Why Is Ripple’s (XRP) Price Down by 17% Today?
- XRP saw a 1.5% price increase over the past 24 hours as the coin trades at $0.215.
- The cryptocurrency is straddling the 100-day EMA as it battles to remain above it.
- Against Bitcoin, XRP set a fresh 2-year low as it reaches the 2300 SAT level.
Key Support & Resistance Levels
XRP/USD:
Support: $0.21, $0.20, $0.192.
Resistance: $0.226, $0.235, $0.24.
XRP/BTC:
Support: 2258 SAT, 2225 SAT, 2220 SAT.
Resistance: 2360 SAT, 2400 SAT, 2455 SAT.
XRP/USD: Ripple Trapped Between 200-days and 100-days EMAs
XRP is currently trading sideways between the 200-days EMA and the 100-days EMA. It is battling to remain above the 100-days EMA at $0.21 and is also rejected any time it attempts to break the 200-days EMA at $0.226.
The bullish momentum has been fading throughout May. However, the buyers are still fighting to prevent the bears from taking control. If XRP does break the 100-days EMA support, the rising trend line should provide adequate support moving forward.
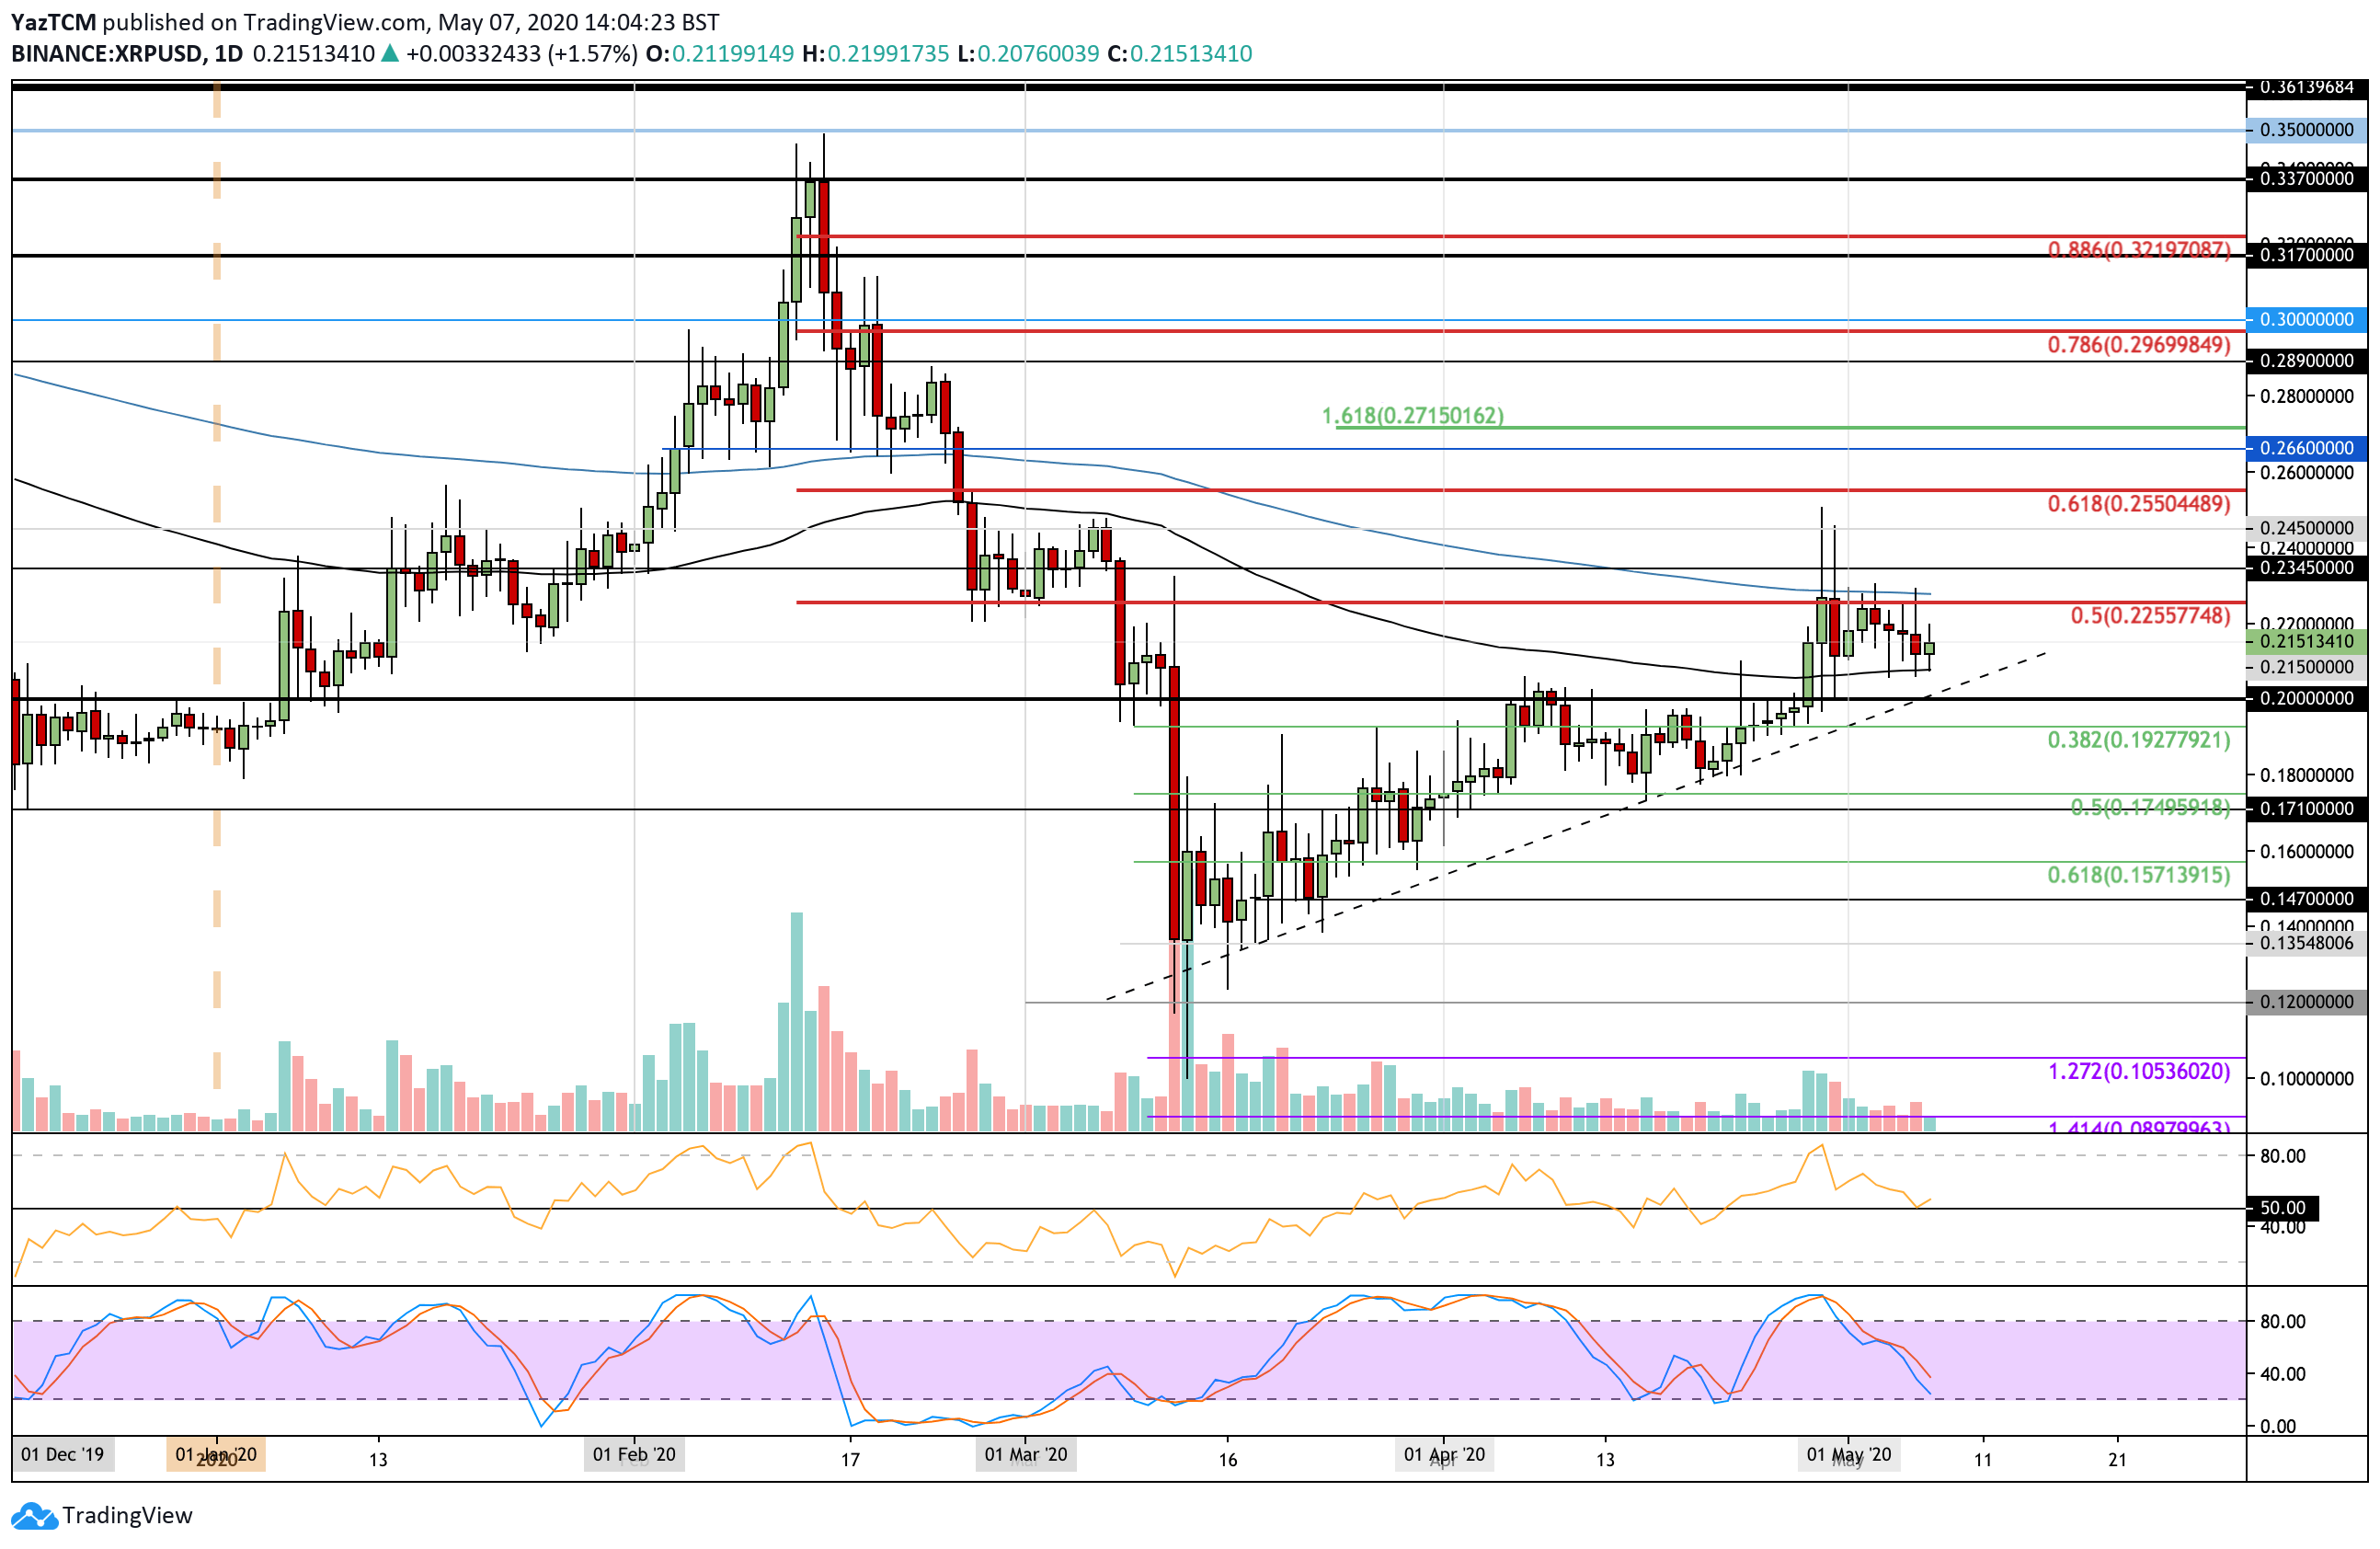
XRP-USD Short Term Price Prediction
If the sellers break $0.21, the first level of support will be located at the rising trend line. Beneath this, support is found at $0.20, $0.192 (.382 Fib Retracement), and $0.18. Additional support lies at $0.175 (.5 Fib Retracement) and $0.17.
On the other side, resistance is at $0.226 (200-days EMA). Above this, additional resistance is located at $0.235, $0.24, and $0.245.
The RSI has dropped from overbought conditions and has recently attempted to rebound from the 50 line. This indicates that the buyers are fighting to remain in control of the market momentum. If it can remain above the 50 line, the bulls will retain control of the market momentum.
XRP/BTC: Ripple Sets Fresh 2-year Lows Against BTC
Against Bitcoin, XRP dropped beneath the crucial support at 2411 SAT yesterday and went as low as 2290 SAT to create a fresh 2-year low for the cryptocurrency. This is a pivotal moment for XRP, as it shows that the sellers have a solid grip on the price action.
We are now trading at levels that have not been seen in XRP/BTC since December 2017, before the epic January 2018 bull run.
XRP has found support at a 4-month-old falling trend line and needs to rebound from here to prevent further declines.
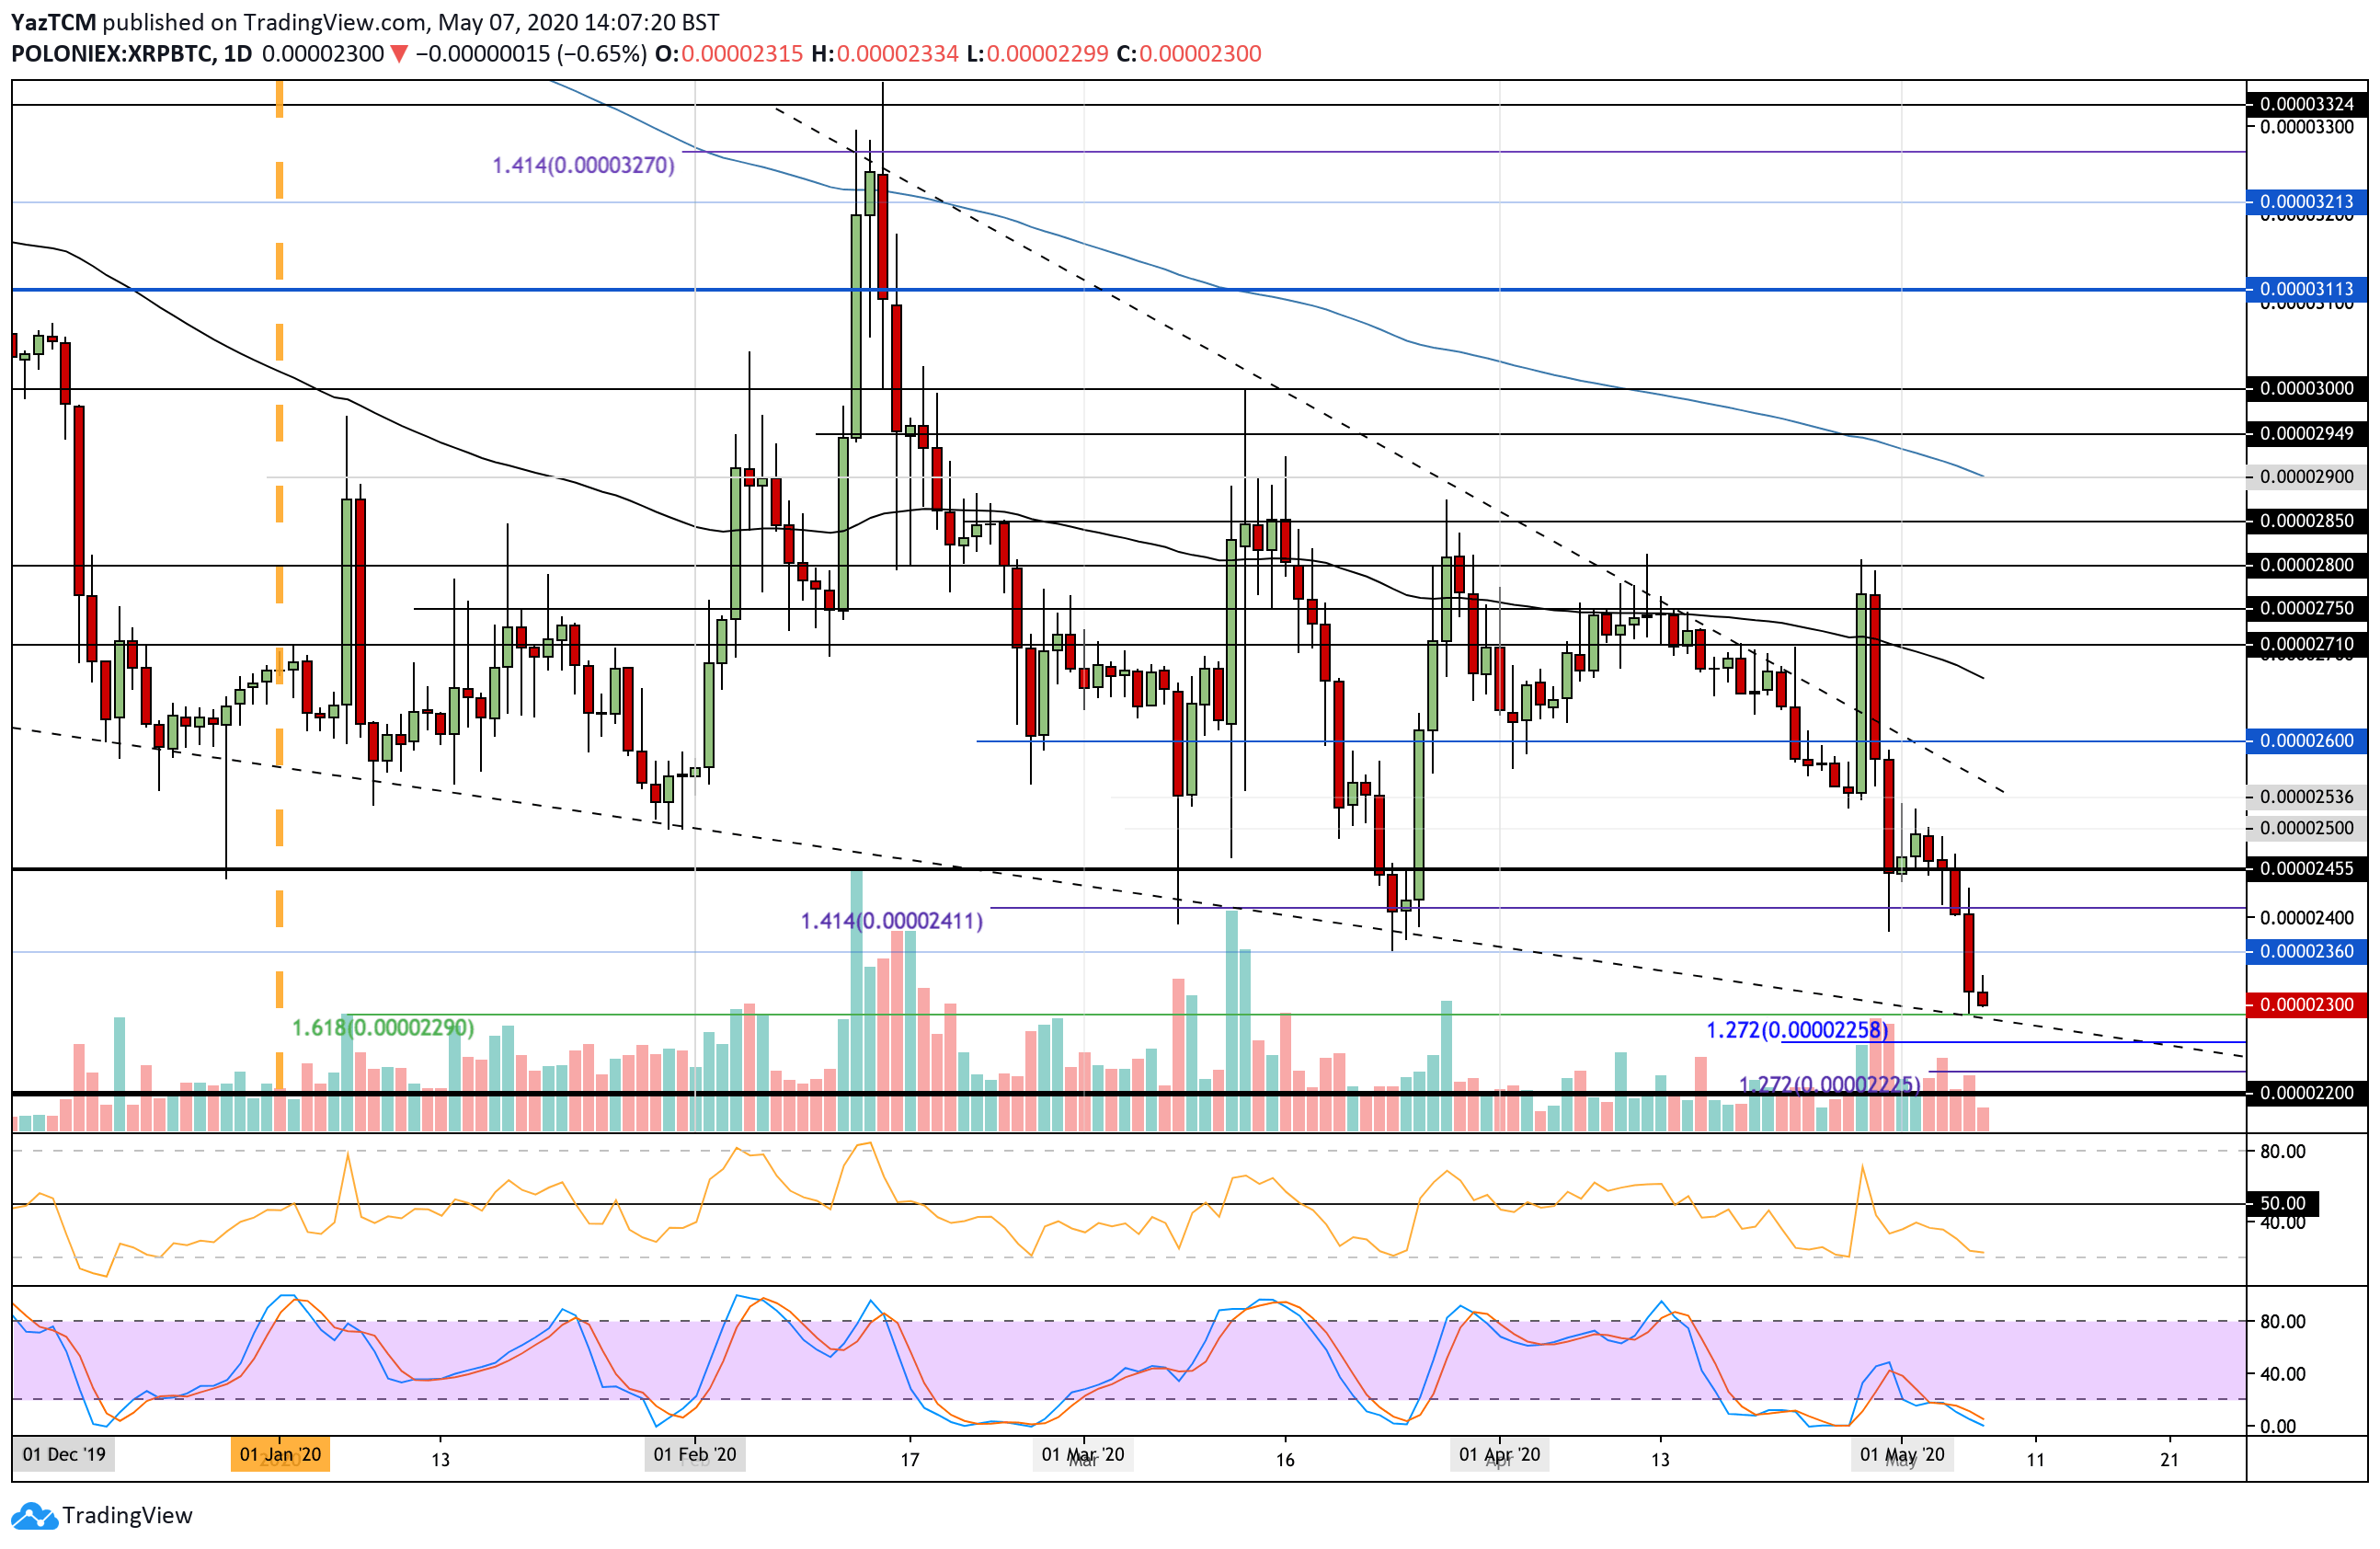
XRP-BTC Short Term Price Prediction
If the sellers push beneath the falling trend line support, the first level of support beneath lies at 2258 SAT. This is followed by added support at 2225 SAT and 2200 SAT.
On the other side, if the buyers rebound from here and push higher, resistance is located at 2360 SAT, 2400 SAT, and 2455 SAT.
The RSI is in extremely oversold conditions, which shows the sellers may be overextended. Additionally, the Stochastic RSI is in oversold conditions and is primed for a bullish crossover signal, which will be the first sign for a rebound.