As we are getting closer to the halving event, Bitcoin is likely to mark its third consecutive green day, where the primary cryptocurrency had increased more than 00 over the past four days. As of writing these lines, it seems like K will come in a matter of hours.If you had followed our price analysis from yesterday, we had mentioned a symmetrical triangle formation on Bitcoin’s 4-hour chart, and also stated that the triangle is likely to break out in the next few hours.As can be seen on the following short-term chart, the triangle broke out to the bullish side at around 70. Since then, the BTC price had reached the resistance level of 00, went down to confirm the triangle this time as support.As of writing these lines, Bitcoin skyrockets over 00. The current daily high now
Topics:
Yuval Gov considers the following as important: Bitcoin (BTC) Price, BTC Analysis, btcusd, btcusdt
This could be interesting, too:
Chayanika Deka writes XRP, SOL, and ADA Inclusion in US Crypto Reserve Pushes Traders on Edge
Chayanika Deka writes Why Arthur Hayes Is Bullish on Bitcoin Under Trump’s Economic Strategy
Mandy Williams writes Why the Bitcoin Market Is Stuck—and the Key Metric That Could Change It: CryptoQuant CEO
Wayne Jones writes Metaplanet Acquires 156 BTC, Bringing Total Holdings to 2,391
As we are getting closer to the halving event, Bitcoin is likely to mark its third consecutive green day, where the primary cryptocurrency had increased more than $1000 over the past four days. As of writing these lines, it seems like $10K will come in a matter of hours.
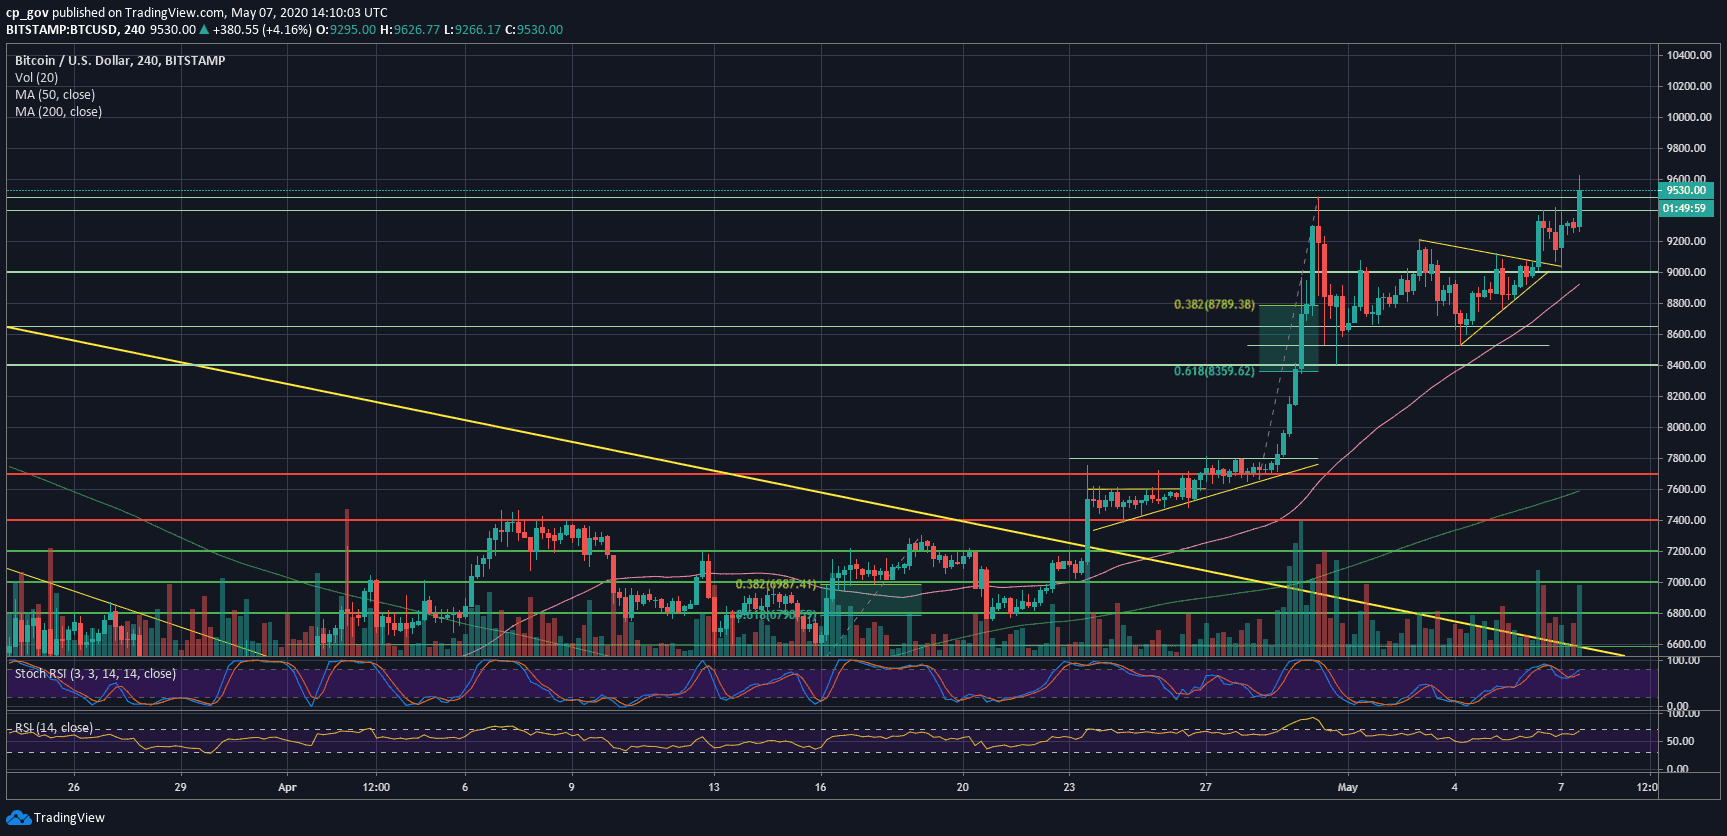
If you had followed our price analysis from yesterday, we had mentioned a symmetrical triangle formation on Bitcoin’s 4-hour chart, and also stated that the triangle is likely to break out in the next few hours.
As can be seen on the following short-term chart, the triangle broke out to the bullish side at around $9070. Since then, the BTC price had reached the resistance level of $9400, went down to confirm the triangle this time as support.
As of writing these lines, Bitcoin skyrockets over $9600. The current daily high now lies at $9630 (Bitstamp); however, this could be changing while you are reading this update.
The critical part is the fact that Bitcoin set a new price record since the end of February, including a full recovery from the devastating price plunge on March 12.
Overall, the indicators are pointing up. The daily RSI is nearing the 80 levels, a decent higher-highs trajectory (which is following the price action), while the volume is also rising.
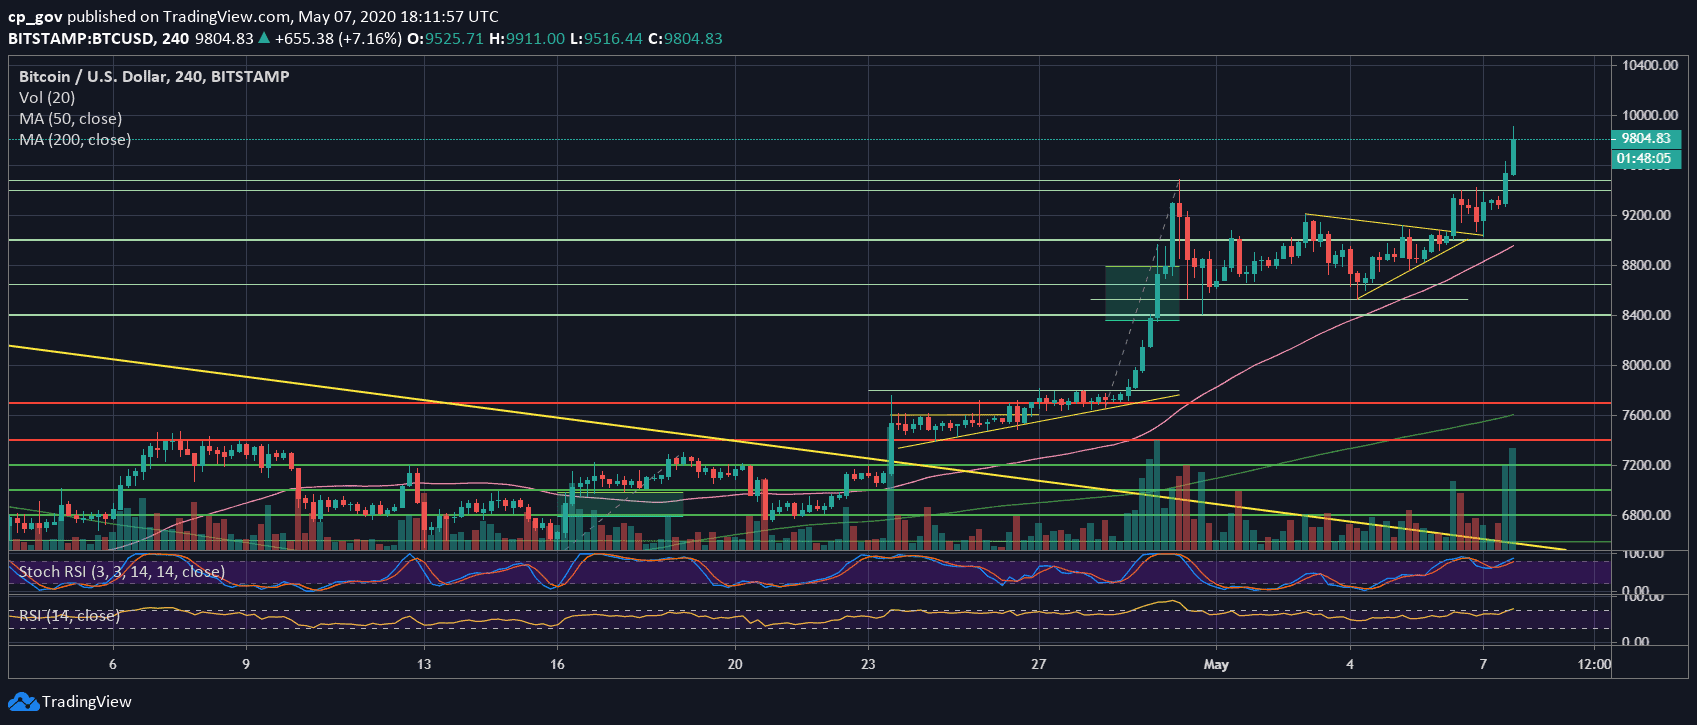
Update: Thursday, May 7, 18:10 UTC
Yeah, the indicators are indeed bullish, as mentioned here a few hours ago. Bitcoin broke up and reached the confluence zone of $9,800 – $10,000. Bitcoin dominance skyrockets as most altcoins plunge against Bitcoin, and the majority of them are red against the USD as well.
For the longer time frame, after Bitcoin went through a Death Cross on March 24, if the price action continues this way, we will likely to see a bullish Golden cross in a matter of one to two weeks.
As mentioned here yesterday, Bitcoin is crashing the altcoins. As of writing this update, the Bitcoin dominance ratio sets another record – 67.3%. Major altcoins like Ethereum (ETH) and Ripple (XRP) are both recording 11% declines against Bitcoin over the past week, while Tezos (XTZ) sees a 15% price drop at the same period.
Total Market Cap: $257 billion
Bitcoin Market Cap: $173.5 billion
BTC Dominance Index: 67.3%
*Data by CoinGecko
Bitcoin’s Real Test Since December 2017
Following the breakout of the previous high at $9400 – $9500, this level now becomes the first significant support. Down below lies $9200, followed by $9000 and $8800.
From above, it gets interesting.
The first resistance lies around $9600, which is the current daily high, whereas the real test will be the price range between $9800 and $10,000. This is a long-term weekly descending trend-line, which started forming in December 2017 – Bitcoin’s all-time high at almost $20K. In case that Bitcoin breaks through, the first resistance above the 5-digits number lies at $10,300 – $10,400.
BTC/USD BitStamp Weekly Chart

BTC/USD BitStamp 4-Hour Chart
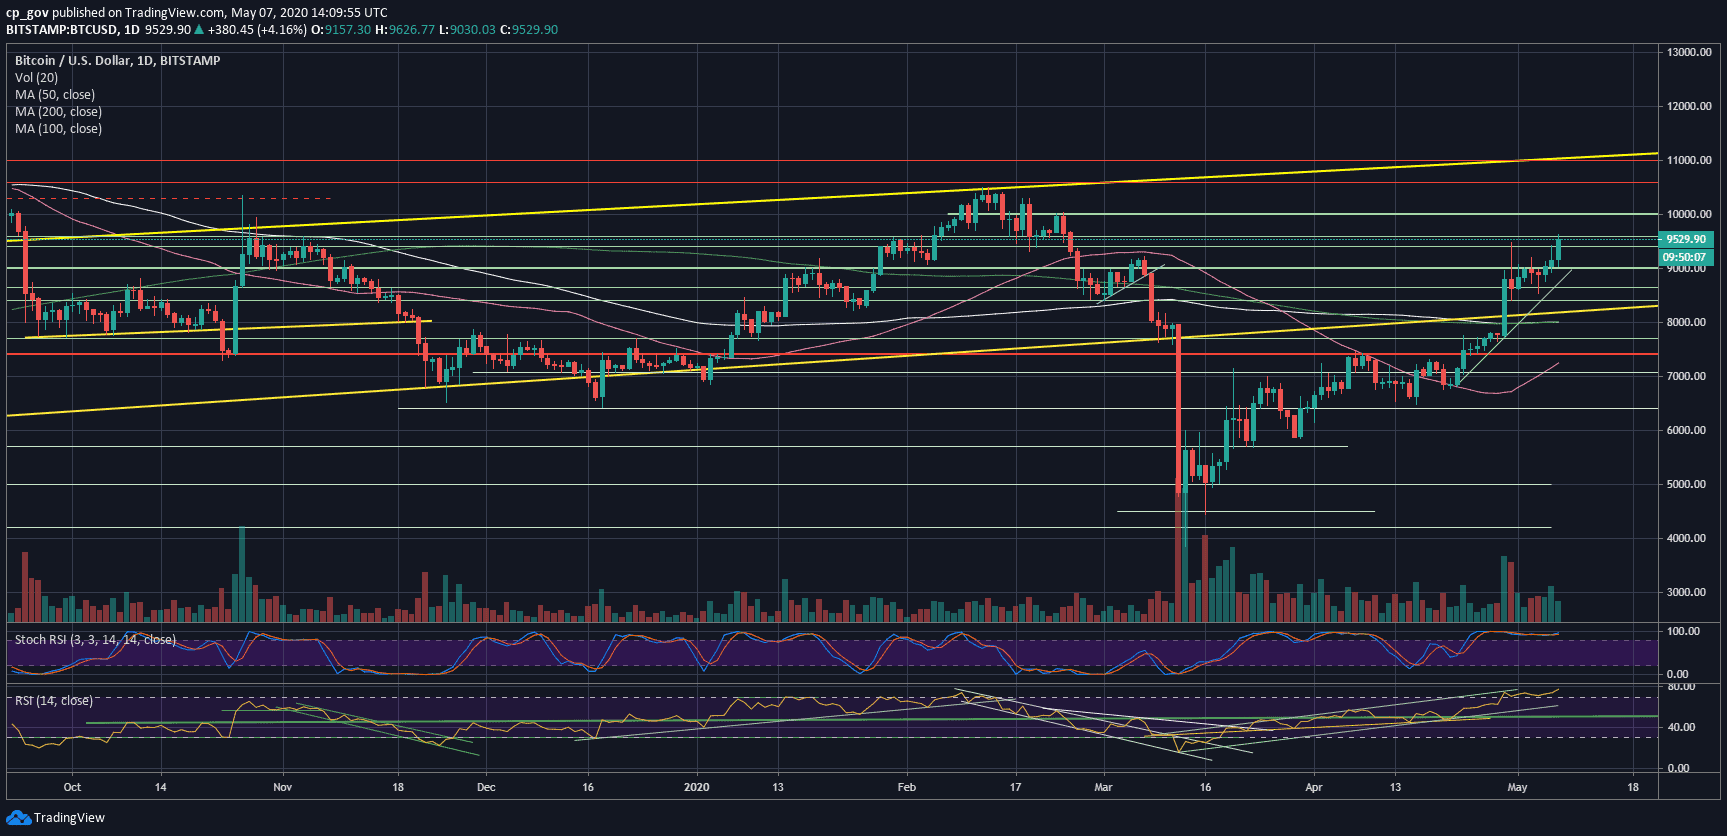
BTC/USD BitStamp 1-Day Chart