XRP/USD – 33% Plummet Sees XRP Hitting %excerpt%.5 SupportKey Support Levels: %excerpt%.5, %excerpt%.45, %excerpt%.435.Key Resistance Levels: %excerpt%.55, %excerpt%.6, %excerpt%.65.XRP surged higher this week as it rallied into the %excerpt%.75 resistance level. Unfortunately, it was unable to break this resistance, which caused the coin to roll over yesterday. Today, the steep Bitcoin price drop caused XRP to head lower as it crashed into the support at the %excerpt%.5 level – provided by a .5 Fib Retracement.XRP spiked further beneath this to hit %excerpt%.46 for a total of around 33% losses over the past 24 hours but it has recovered slightly since then.XRP/USD 4HR Chart. Source: TradingViewXRP-USD Short Term Price PredictionLooking ahead, if the sellers break %excerpt%.5, the first level of support lies at %excerpt%.45. Beneath this, support is located at %excerpt%.435
Topics:
Yaz Sheikh considers the following as important: Ripple (XRP) Price, XRP Analysis, xrpbtc, xrpusd
This could be interesting, too:
Jordan Lyanchev writes Ripple’s (XRP) Surge to Triggers Over Million in Short Liquidations
Jordan Lyanchev writes Trump Confirms Work on Strategic Crypto Reserve: XRP, ADA, SOL Included
Dimitar Dzhondzhorov writes Is a Major Ripple v. SEC Lawsuit Development Expected This Week? Here’s Why
Mandy Williams writes Ripple Releases Institutional DeFi Roadmap for XRP Ledger in 2025
XRP/USD – 33% Plummet Sees XRP Hitting $0.5 Support
Key Support Levels: $0.5, $0.45, $0.435.
Key Resistance Levels: $0.55, $0.6, $0.65.
XRP surged higher this week as it rallied into the $0.75 resistance level. Unfortunately, it was unable to break this resistance, which caused the coin to roll over yesterday. Today, the steep Bitcoin price drop caused XRP to head lower as it crashed into the support at the $0.5 level – provided by a .5 Fib Retracement.
XRP spiked further beneath this to hit $0.46 for a total of around 33% losses over the past 24 hours but it has recovered slightly since then.
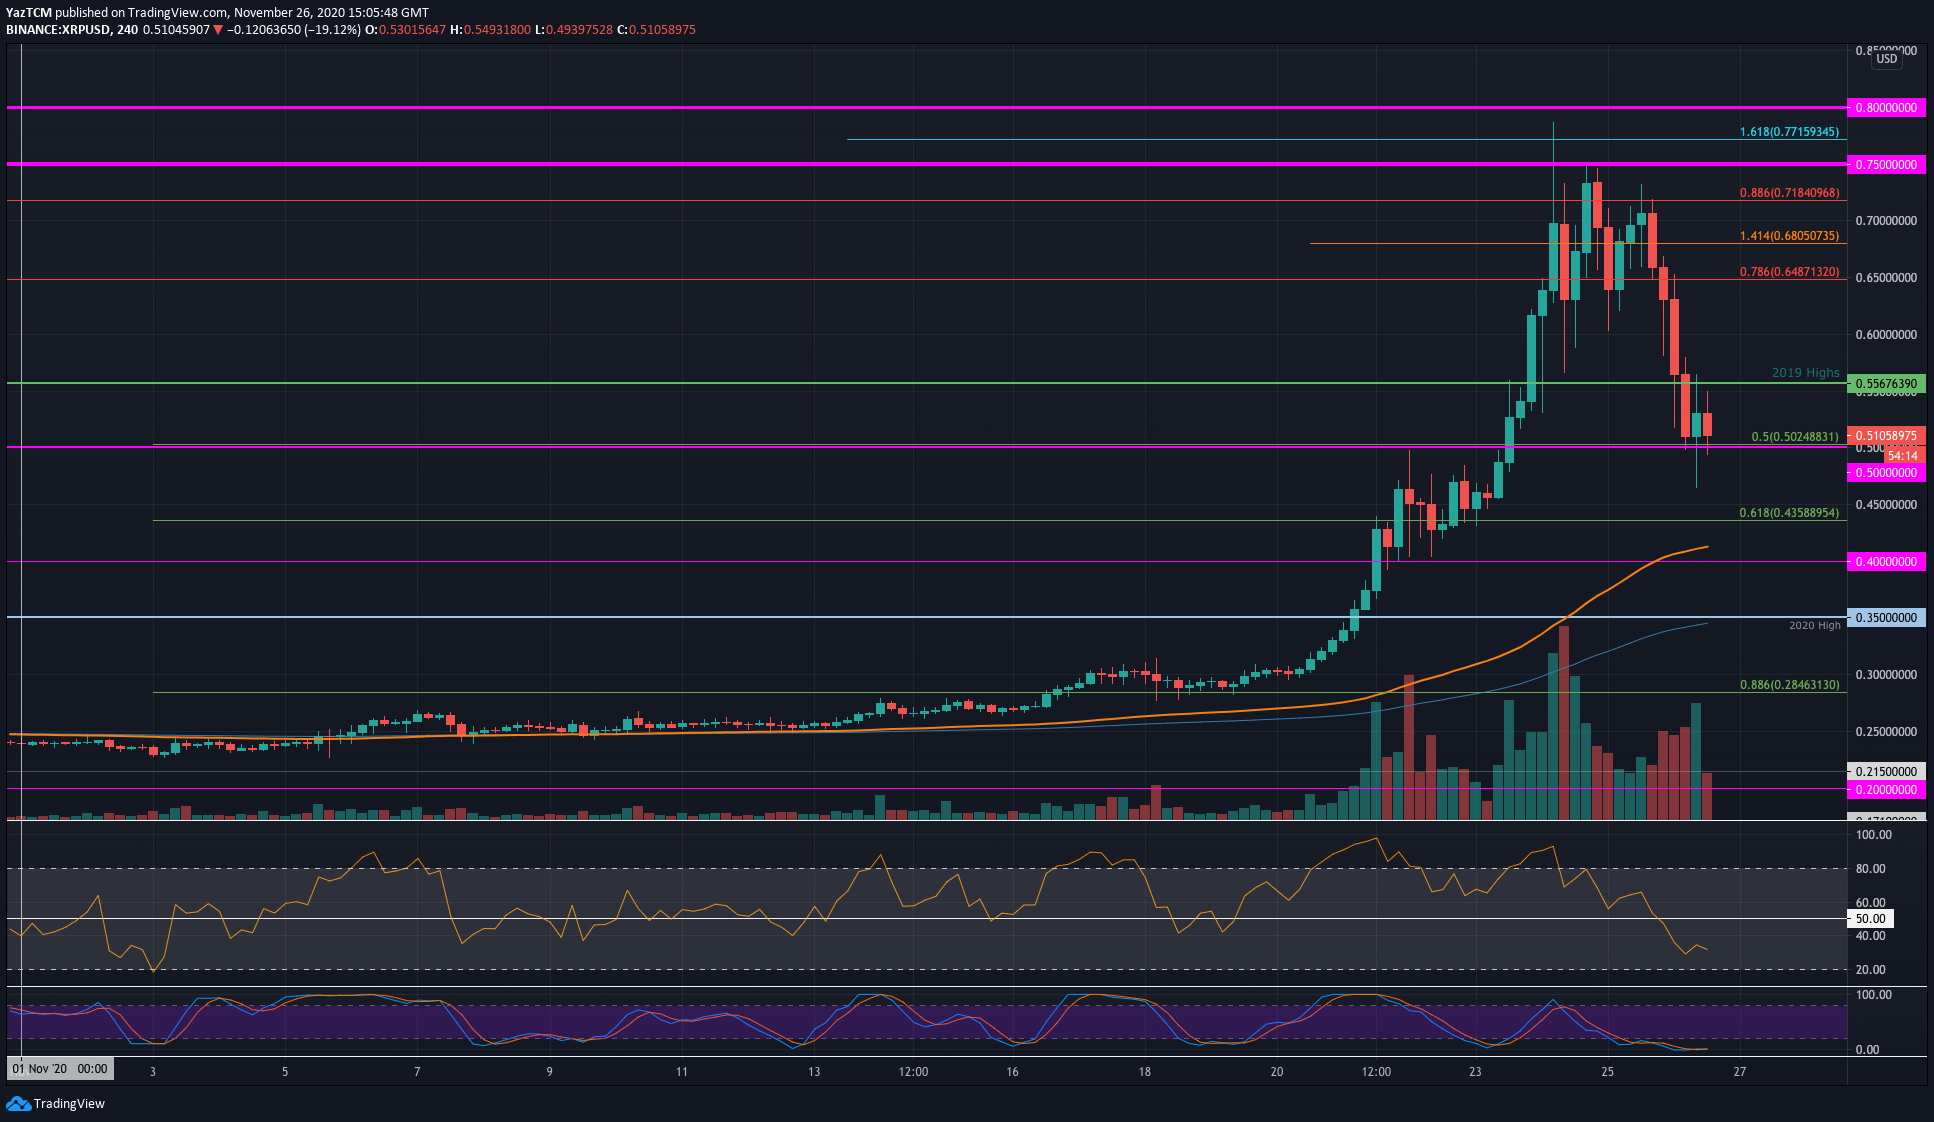
XRP-USD Short Term Price Prediction
Looking ahead, if the sellers break $0.5, the first level of support lies at $0.45. Beneath this, support is located at $0.435 (.618 Fib), $0.4, and $0.35 (2020 High).
On the other side, the first level of resistance lies at $0.556 (2019 Highs). Above this, resistance lies at $0.6, $0.65 (bearish .786 Fib), and $0.75.
The 4HR RSI is in extremely oversold conditions, suggesting that the selling pressure should subside pretty soon and allow XRP to push higher again.
XRP/BTC – Sellers Drop XRP into .5 Fib Retracement
Key Support Levels: 2900 SAT, 2585 SAT, 2450 SAT.
Key Resistance Levels: 3200 SAT, 3360 SAT, 3600 SAT.
XRP also fell today against Bitcoin as it dropped from 3785 SAT (OCtober 2019 highs) to break beneath 3000 SAT and meet the support at 2900 SAT (.5 Fib Retracement).
The coin has since rebounded from here to climb back above 3000 SAT.
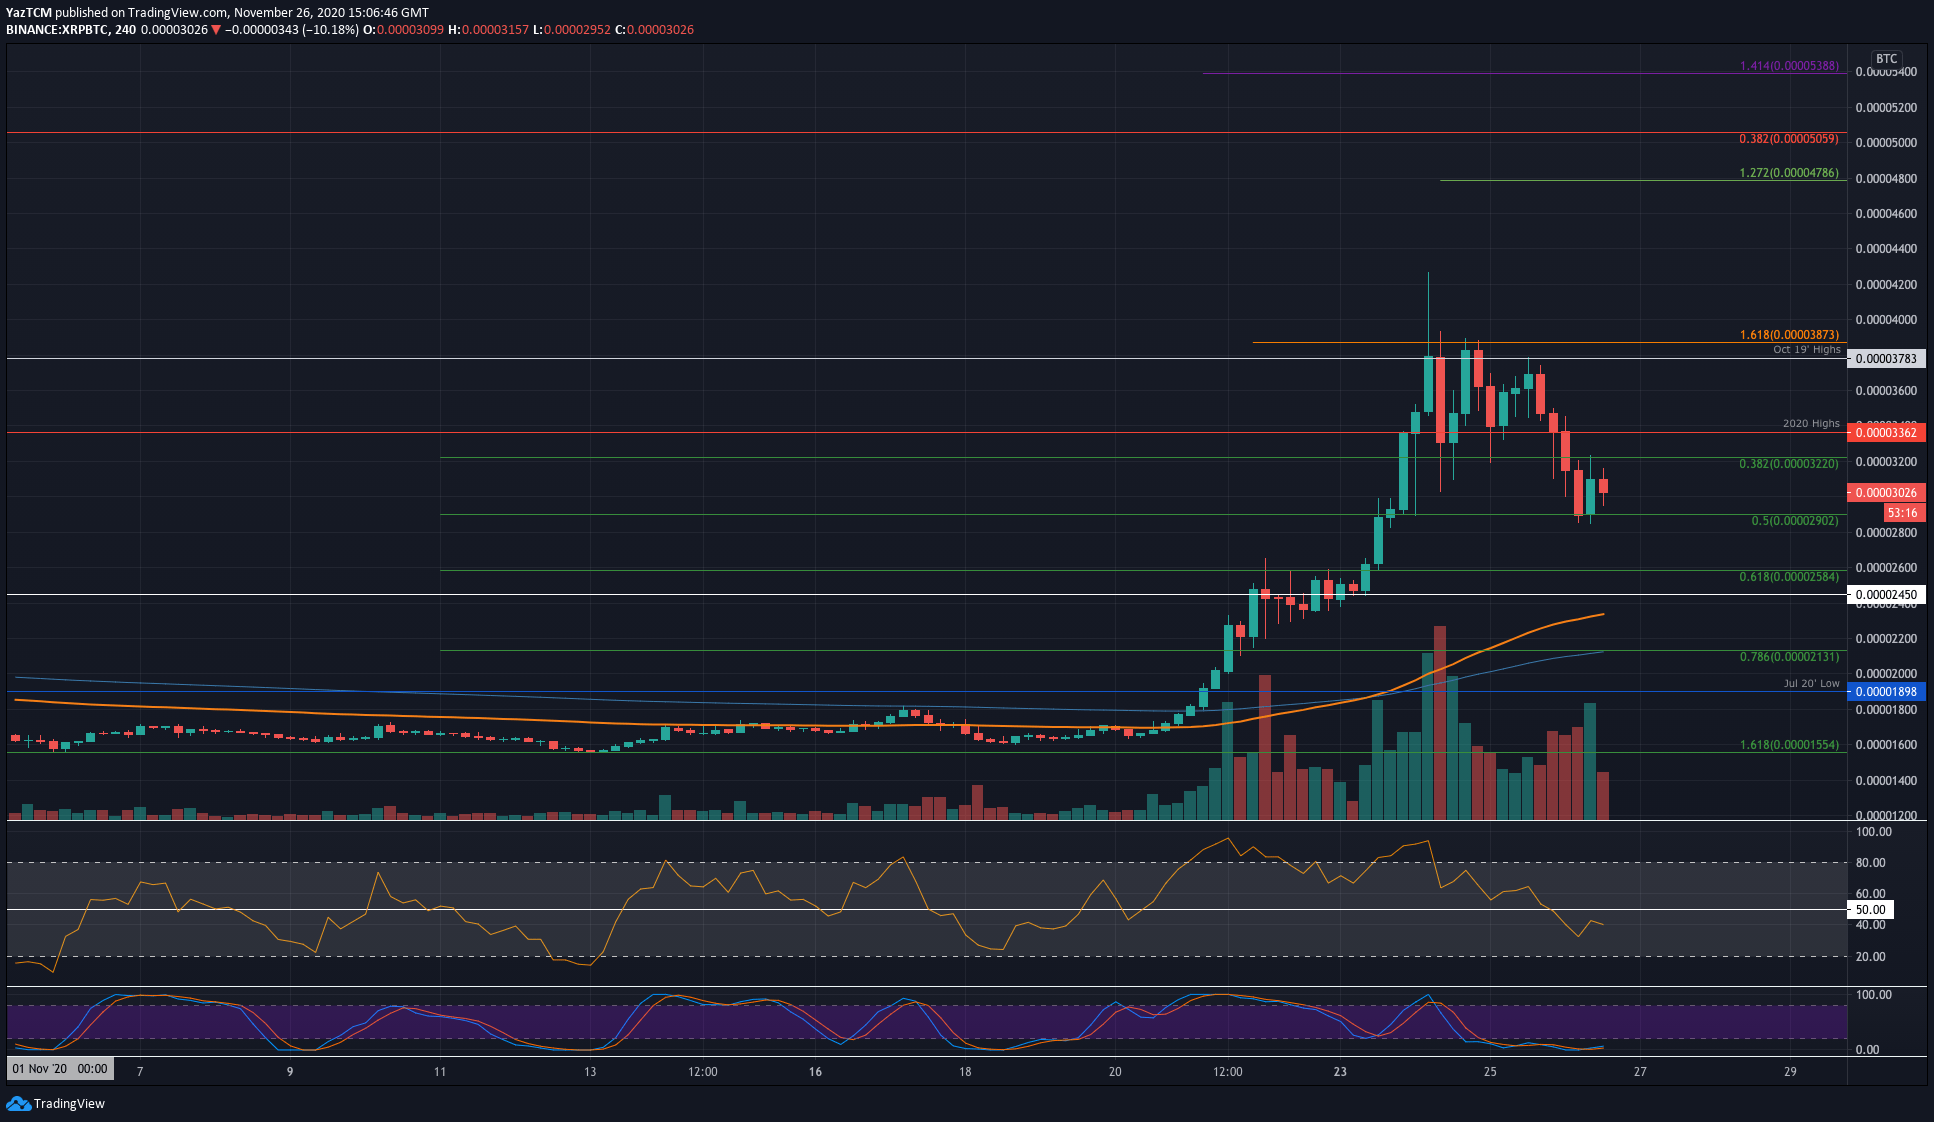
XRP-BTC Short Term Price Prediction
Looking ahead, if the sellers push back beneath 3000 SAT, the first level of support lies at 2900 SAT. Beneath this, support lies at 2585 SAT (.618 Fib), 2450 SAT, and 2200 SAT.
Alternatively, if the buyers push higher, the first level of resistance lies at 3200 SAT. Above this, resistance is located at 3360 SAT (2020 highs), 3600 SAT, and 3785 SAT (Oct 19’ Highs).
Likewise, the 4HR Stochastic RSI is extremely oversold here, suggesting the selling pressure should dissipate soon.