Roughly around two days ago, bitcoin’s price dipped to an intraday low of ,640 (on Bitstamp), causing moderate turmoil within the community and raising the question of how far the correction will go. As we reported back then, one of the key levels to consider is the zone between .3K and K as it contains very strong support in terms of both technical and on-chain indicators. Now, prominent Bitcoin analyst Daniel Joe noted on Twitter that the cryptocurrency dipped into this major accumulation zone while also printing a moderate hammer candle and followed through higher. Chart by TradingViewAccording to the analyst, “this is a near-term positive development for technicals, but we need to see higher highs and higher lows for validation.” We noted on more than one
Topics:
George Georgiev considers the following as important: Bitcoin (BTC) Price, BTC Analysis, BTCEUR, BTCGBP, btcusd, btcusdt
This could be interesting, too:
Chayanika Deka writes XRP, SOL, and ADA Inclusion in US Crypto Reserve Pushes Traders on Edge
Chayanika Deka writes Why Arthur Hayes Is Bullish on Bitcoin Under Trump’s Economic Strategy
Mandy Williams writes Why the Bitcoin Market Is Stuck—and the Key Metric That Could Change It: CryptoQuant CEO
Wayne Jones writes Metaplanet Acquires 156 BTC, Bringing Total Holdings to 2,391
Roughly around two days ago, bitcoin’s price dipped to an intraday low of $55,640 (on Bitstamp), causing moderate turmoil within the community and raising the question of how far the correction will go.
As we reported back then, one of the key levels to consider is the zone between $58.3K and $53K as it contains very strong support in terms of both technical and on-chain indicators.
Now, prominent Bitcoin analyst Daniel Joe noted on Twitter that the cryptocurrency dipped into this major accumulation zone while also printing a moderate hammer candle and followed through higher.
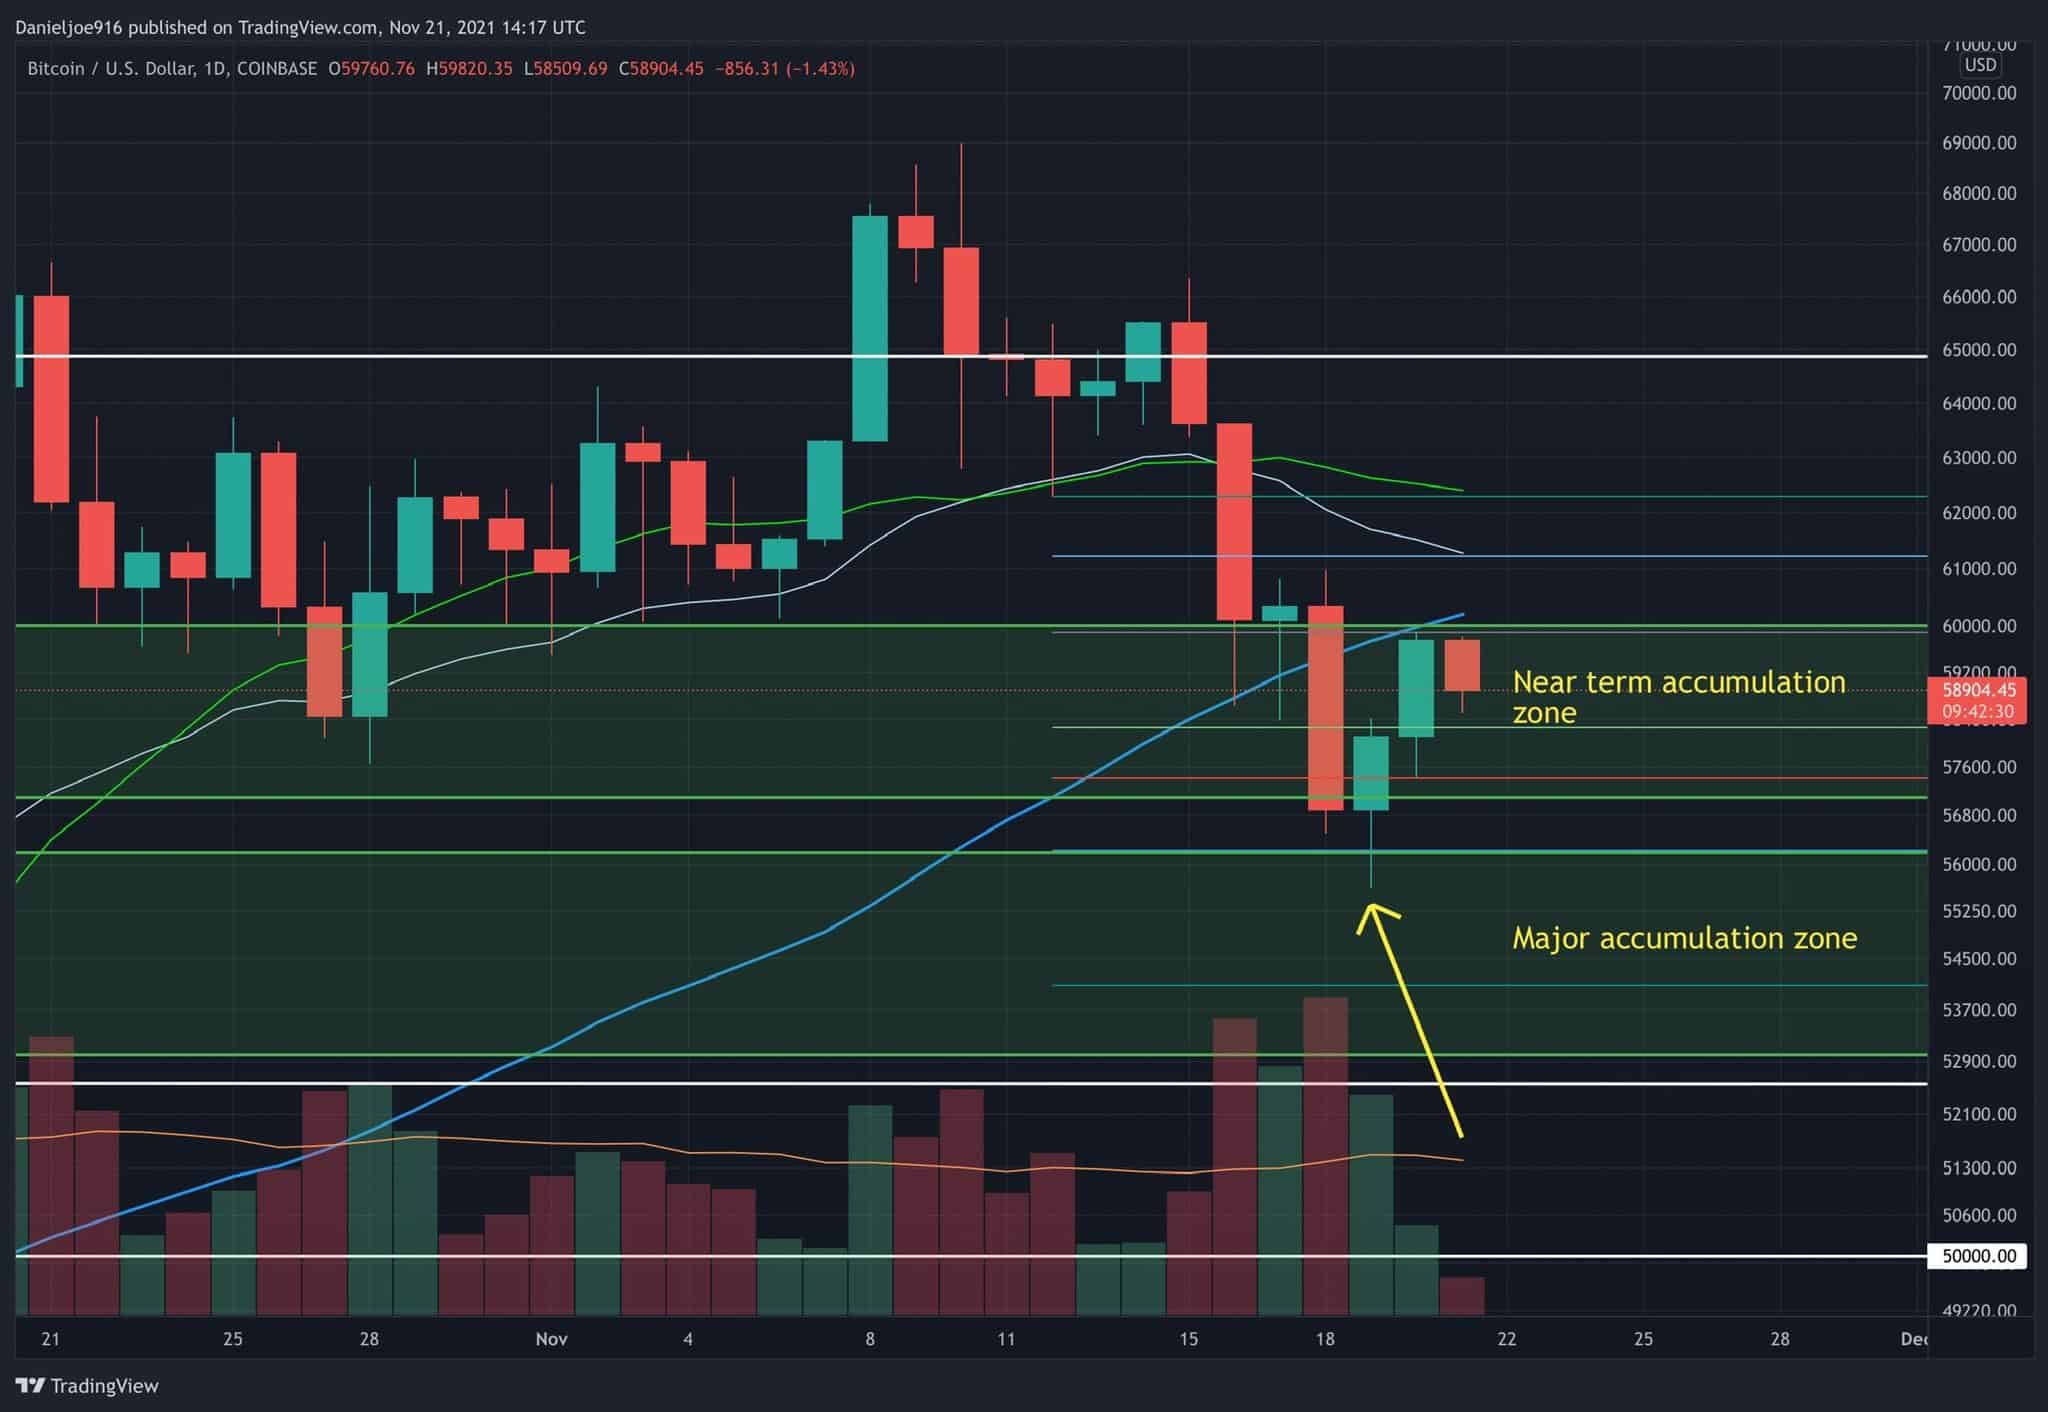
According to the analyst, “this is a near-term positive development for technicals, but we need to see higher highs and higher lows for validation.”
We noted on more than one occasion that the current drawdown is caused predominantly by leveraged long positions being liquidated and weak hands panic selling mostly newer coins. Long-term holders (LTHs) and miners, on the other hand, have been holding through and show no serious interest in selling at these levels.
This is firmly attested by the fact that the Mean Coin Age (MCA) has been trending higher for a considerable period, despite some short-term pullbacks, as seen in the chart below:

The analyst also notes that he believes this to be an excellent buying opportunity as there are no serious signs of aggressive distribution from older coins and miners as the price was declining.
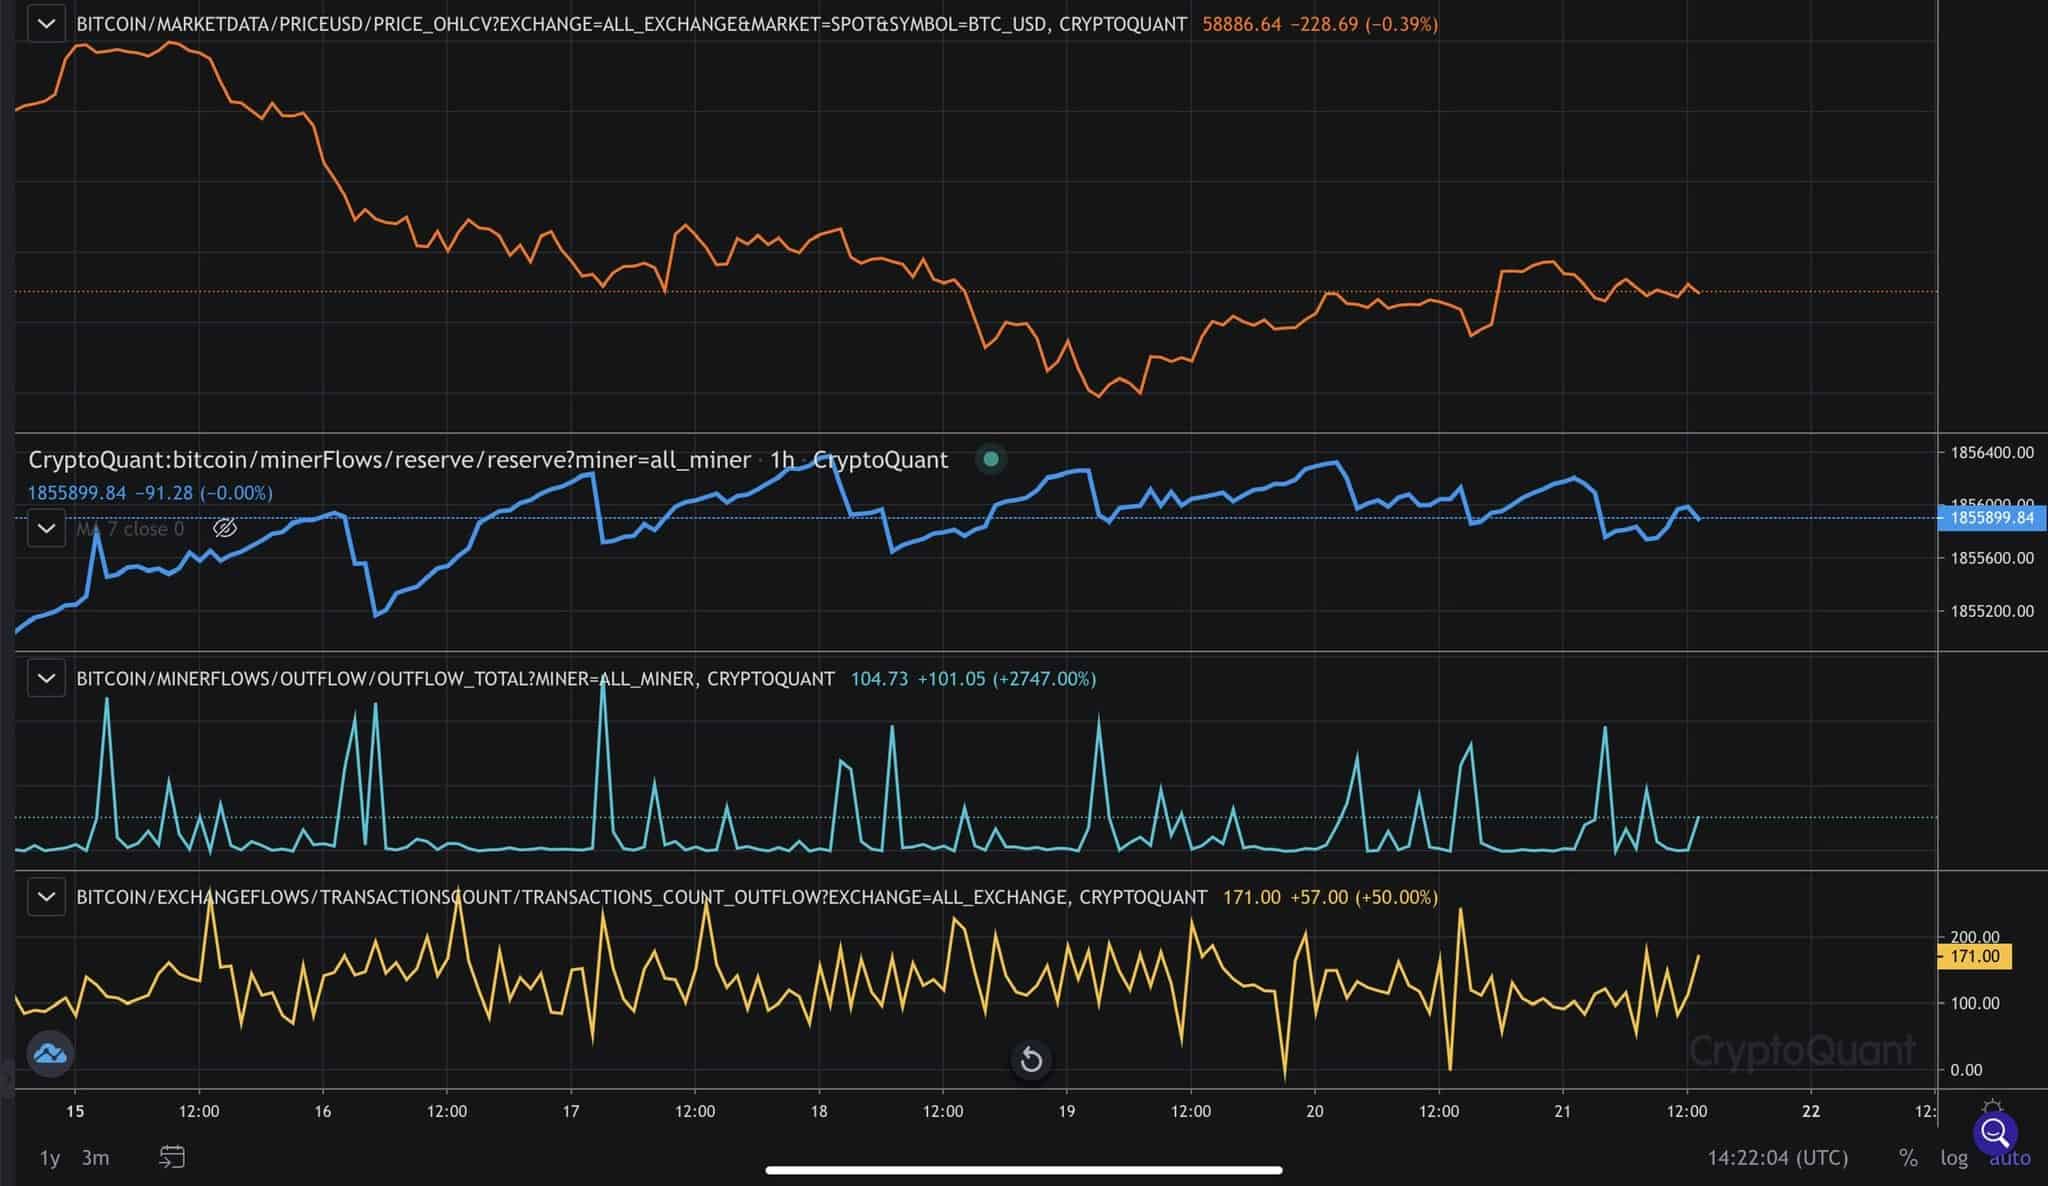
I think this pullback is a solid buying opportunity because we saw no major signs of aggressive distribution from older coins and miners as price fell.
So this is likely a shakeout in the middle of the bull market.
Always feels amazing to accumulate in times like this. Thank the leverage longs and the weak hands for causing short-term dislocations in price. – Joe concluded.