Key Support levels: 6 Key Resistance levels: 0 After AVAX turned the previous resistance at 6 into support, the price has not stopped moving higher. The momentum is very strong, and bulls have full control of the market. The next key resistance to consider can be found at 0. Chart by TradingViewTechnical Indicators Trading Volume: The break of resistance happened on good volume. However, the current increase in price appears to happen with a decreasing volume. This is not ideal, but the momentum remains in favor of the bulls, at least for now. RSI: The RSI on the daily timeframe is above 80 points which indicates a strong bullish presence. Nevertheless, it’s important to be careful because if the RSI reaches over 90 points and into oversold territory, this
Topics:
Duo Nine considers the following as important: Avalanche (AVAX) Price, AVAXBTC, AVAXUSD, Price Analysis
This could be interesting, too:
Chayanika Deka writes Everything You Need to Know About Avalanche9000 Network Upgrade with Etna on Mainnet
Dimitar Dzhondzhorov writes Top 10 Cryptocurrencies by ‘Notable Development Activity’ (Santiment)
CryptoVizArt writes ETH’s Path to K Involves Maintaining This Critical Support (Ethereum Price Analysis)
Dimitar Dzhondzhorov writes Important Binance Announcement Concerning Numerous Altcoin Traders: Details
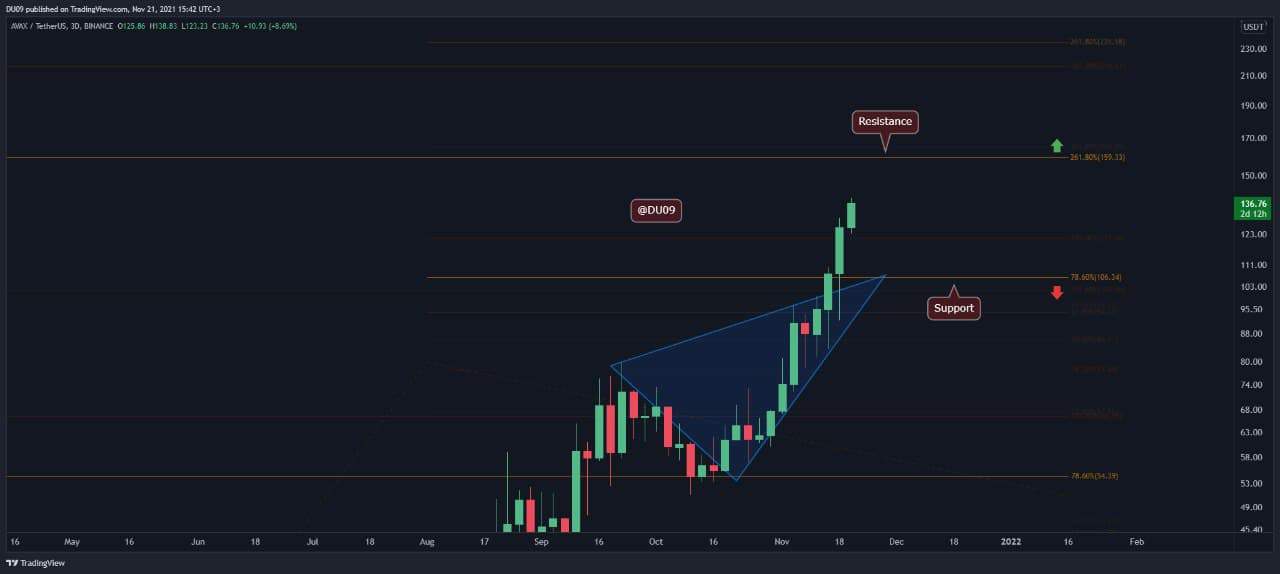
Key Support levels: $106
Key Resistance levels: $160
After AVAX turned the previous resistance at $106 into support, the price has not stopped moving higher. The momentum is very strong, and bulls have full control of the market. The next key resistance to consider can be found at $160.
Technical Indicators
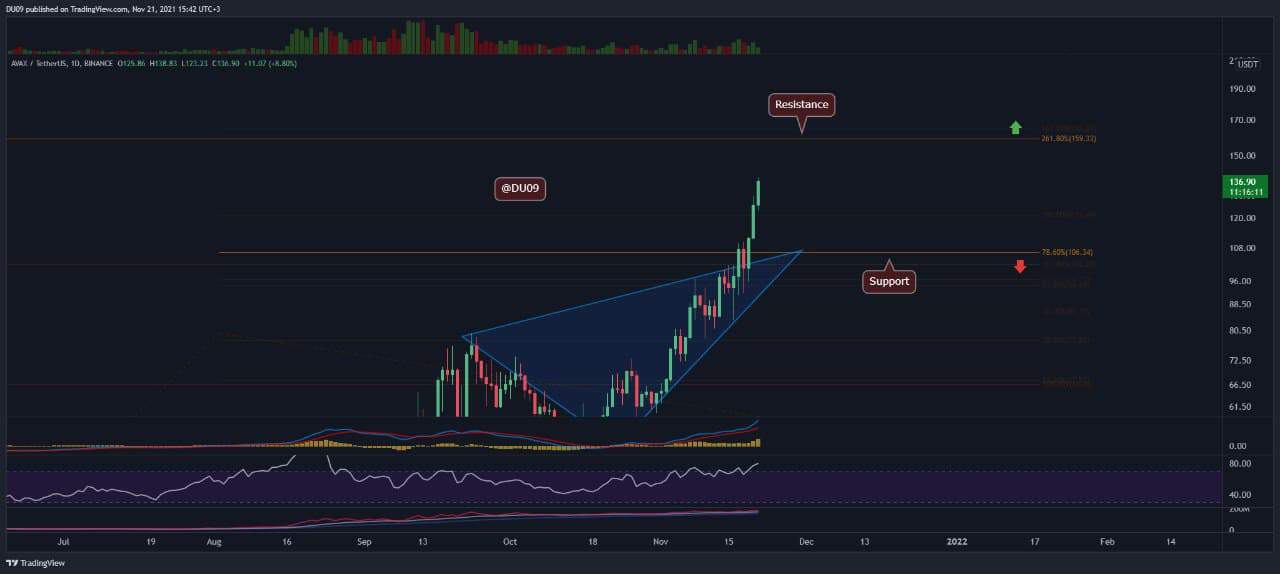
Trading Volume: The break of resistance happened on good volume. However, the current increase in price appears to happen with a decreasing volume. This is not ideal, but the momentum remains in favor of the bulls, at least for now.
RSI: The RSI on the daily timeframe is above 80 points which indicates a strong bullish presence. Nevertheless, it’s important to be careful because if the RSI reaches over 90 points and into oversold territory, this might present an issue.
MACD: The MACD on the daily timeframe is bullish with moving averages that are expanding and a histogram that is making higher highs. So long as this continues, there is very little to stop AVAX from going higher.
Bias
The bias for AVAX is bullish and will remain so until the price faces some resistance.
Short-Term Price Prediction for AVAX
AVAX has surprised the market with this breakout, considering the correction in BTC and ETH. Therefore, there’s a lot of attention towards the cryptocurrency, and this might propel it to go higher. A tentative target at this time is $160, where the situation needs to be reassessed based on the market’s reaction.