The technical indicators are showing potential signs of a bottom at .4K. Bitcoin’s price has built a base of support in the mid K area recently, with bullish divergence forming on the 4-hour RSI. It appears that bulls have stepped in and protected .2K, which is a technical level of support. The overall trend in on-chain metrics continues to remain bullish despite the recent volatility. The Technicals The longer-term trend and structure remain bullish despite the recent drawdown. BTC has been making higher highs and higher lows since the mid-cycle pullback bottom in July. In case of another liquidation, it’s important to look for the critical technical uptrend support at around .2K. This is a key level the bulls must protect in addition to the confluent support
Topics:
Daniel Joe considers the following as important: Bitcoin (BTC) Price, BTC Analysis, BTCEUR, BTCGBP, btcusd, btcusdt
This could be interesting, too:
Chayanika Deka writes XRP, SOL, and ADA Inclusion in US Crypto Reserve Pushes Traders on Edge
Chayanika Deka writes Why Arthur Hayes Is Bullish on Bitcoin Under Trump’s Economic Strategy
Mandy Williams writes Why the Bitcoin Market Is Stuck—and the Key Metric That Could Change It: CryptoQuant CEO
Wayne Jones writes Metaplanet Acquires 156 BTC, Bringing Total Holdings to 2,391
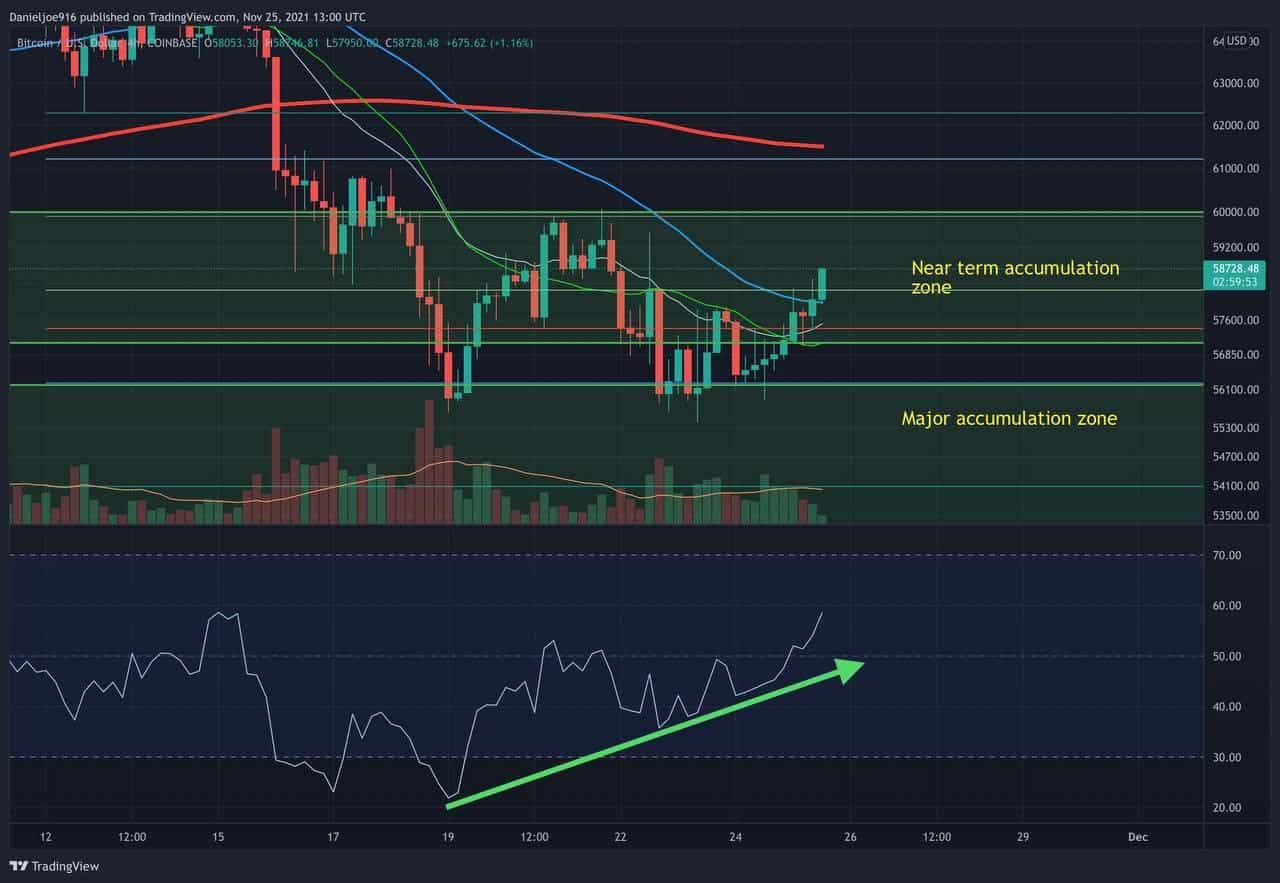
The technical indicators are showing potential signs of a bottom at $55.4K. Bitcoin’s price has built a base of support in the mid $50K area recently, with bullish divergence forming on the 4-hour RSI.
It appears that bulls have stepped in and protected $56.2K, which is a technical level of support. The overall trend in on-chain metrics continues to remain bullish despite the recent volatility.
The Technicals
The longer-term trend and structure remain bullish despite the recent drawdown. BTC has been making higher highs and higher lows since the mid-cycle pullback bottom in July.
In case of another liquidation, it’s important to look for the critical technical uptrend support at around $53.2K. This is a key level the bulls must protect in addition to the confluent support at $53K to $52.7K.
There are near-term signs of a bottom forming with the 4-hour RSI trending higher with the second test of the lows of $55.4K. In the short term, it’s critical for the bulls to protect $55.4K and start forming higher highs and higher lows. It is also very important to see BTC make a weekly close above $60K to turn near-term technicals even more bullish.
Forming higher highs and higher lows will increase the probability of a bottom at $55.4K and will help the momentum indicators progress from low time frame to higher time frame charts.
The On-Chain
Overall, the drawdown didn’t see aggressive distribution from long-term holders and miners. This suggests that the pullback is a near-term shakeout rather than the start of a bear market. It was driven by long liquidations and younger coins panic selling.
Despite the volatility, miners are back in accumulation, with their reserves increasing for over a week. Overall, older cohorts continue to hold BTC with no signs of a trend of aggressive distribution showing.
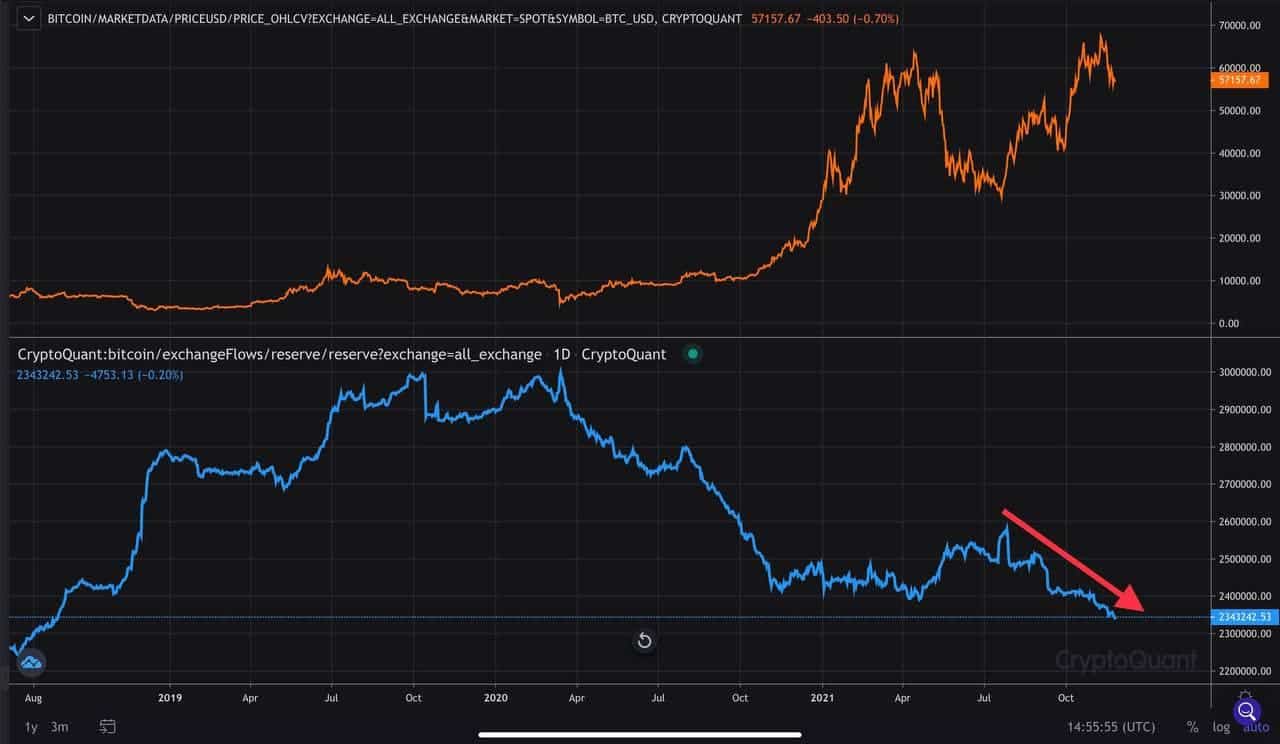
Even with BTC correcting nearly 20%, exchange reserves continue to fall, making new multi-year lows. So far today, 12-to-18-month and 6-to-12-month cohorts distributed, causing a spike in LTH SOPR and CDD.
This is likely not a concern as we usually see periodic distribution from some older cohorts. We will have to keep an eye on them to watch for more distribution. It will be more concerning if we see consistent aggressive distribution from these groups, especially if BTC continues falling and closes below $53K.
Considering all other older cohorts and miners are not aggressively distributing at the moment, and exchange reserves continue to make multi-year lows, the overall trend in on-chain remains bullish.
Conclusion
Bullish on-chain data continues to make the recent pullback an attractive buying opportunity between $58.3K to $53K. As long as older coins and miners do not start a trend of aggressive distribution while the price falls, we can expect a bull market continuation.
The bulls need to protect the near-term lows at $55.4K to confirm and validate a bottom has formed. A trend of distribution similar to the 2017 bull market has yet to start, which strongly suggests the probability of the bull market extending into Q1 2022 or later is increasing.
This will be very bullish for BTC as it will make the rally more sustainable.