After an initial rejection at the 200-day moving average, BTC staged another attempt to break out and managed to successfully make a daily close above the crucial line. The daily close at .2k above the 200MA and a key downtrend line can be seen as a very bullish technical buy signal. Chart by TradingViewIt is important for BTC to hold above this key level and follow through higher in the next few weeks to validate the buy signal. A daily close above the 200-day moving average is a bullish signal, but it is even more important for BTC to follow-through higher, especially in the next few weeks. For the near term, the 4-hour chart is still showing some signs of bearish divergence. The relative strength index on the 4-hour has failed to push above 71.66, the most recent
Topics:
Daniel Joe considers the following as important: Bitcoin (BTC) Price, BTC Analysis, BTCEUR, BTCGBP, btcusd, btcusdt
This could be interesting, too:
Chayanika Deka writes XRP, SOL, and ADA Inclusion in US Crypto Reserve Pushes Traders on Edge
Chayanika Deka writes Why Arthur Hayes Is Bullish on Bitcoin Under Trump’s Economic Strategy
Mandy Williams writes Why the Bitcoin Market Is Stuck—and the Key Metric That Could Change It: CryptoQuant CEO
Wayne Jones writes Metaplanet Acquires 156 BTC, Bringing Total Holdings to 2,391
After an initial rejection at the 200-day moving average, BTC staged another attempt to break out and managed to successfully make a daily close above the crucial line. The daily close at $46.2k above the 200MA and a key downtrend line can be seen as a very bullish technical buy signal.
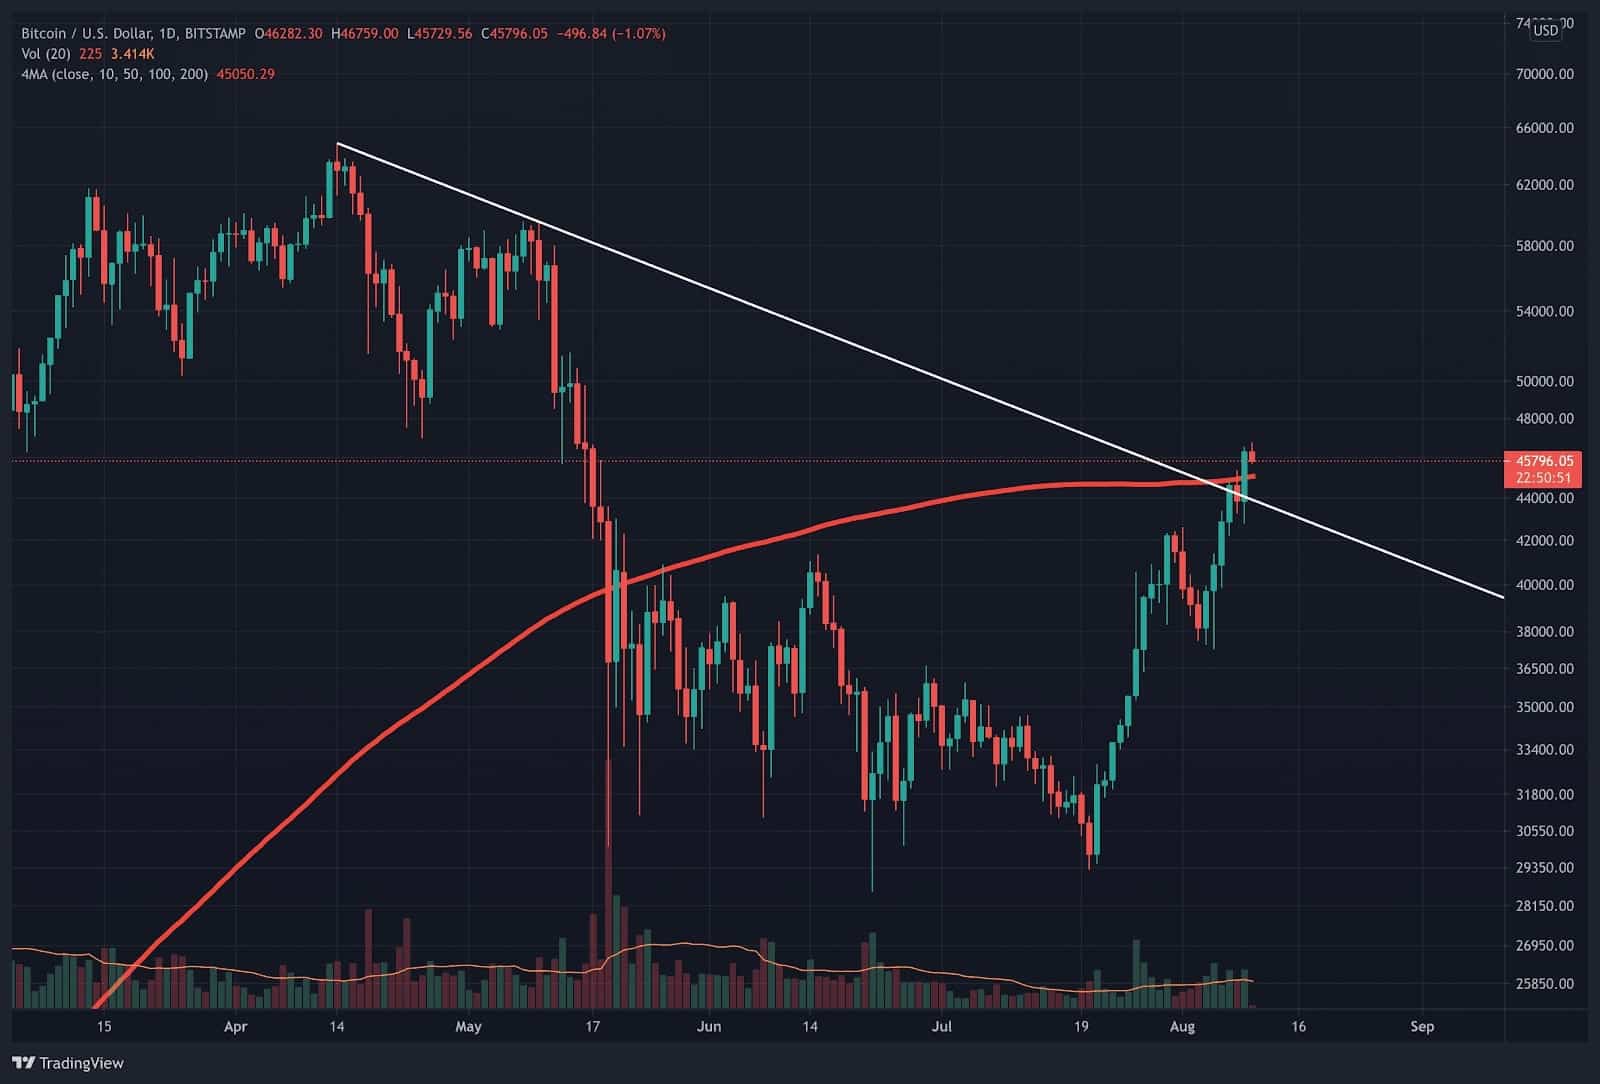
It is important for BTC to hold above this key level and follow through higher in the next few weeks to validate the buy signal. A daily close above the 200-day moving average is a bullish signal, but it is even more important for BTC to follow-through higher, especially in the next few weeks.
For the near term, the 4-hour chart is still showing some signs of bearish divergence. The relative strength index on the 4-hour has failed to push above 71.66, the most recent closing high. To break this bearish divergence, BTC needs to rally significantly to the upside to form a higher high on the relative strength index. This signals an increased risk of a cool-off period for BTC.
It’s common to see relief rallies above the 200-day moving average after spending time below this key level. In bear markets, prices could rally up to the 200-day moving average and close above this level but fail to hold support or follow through higher. This is known as a false breakout, where the price fails to push higher after the first buy signal.
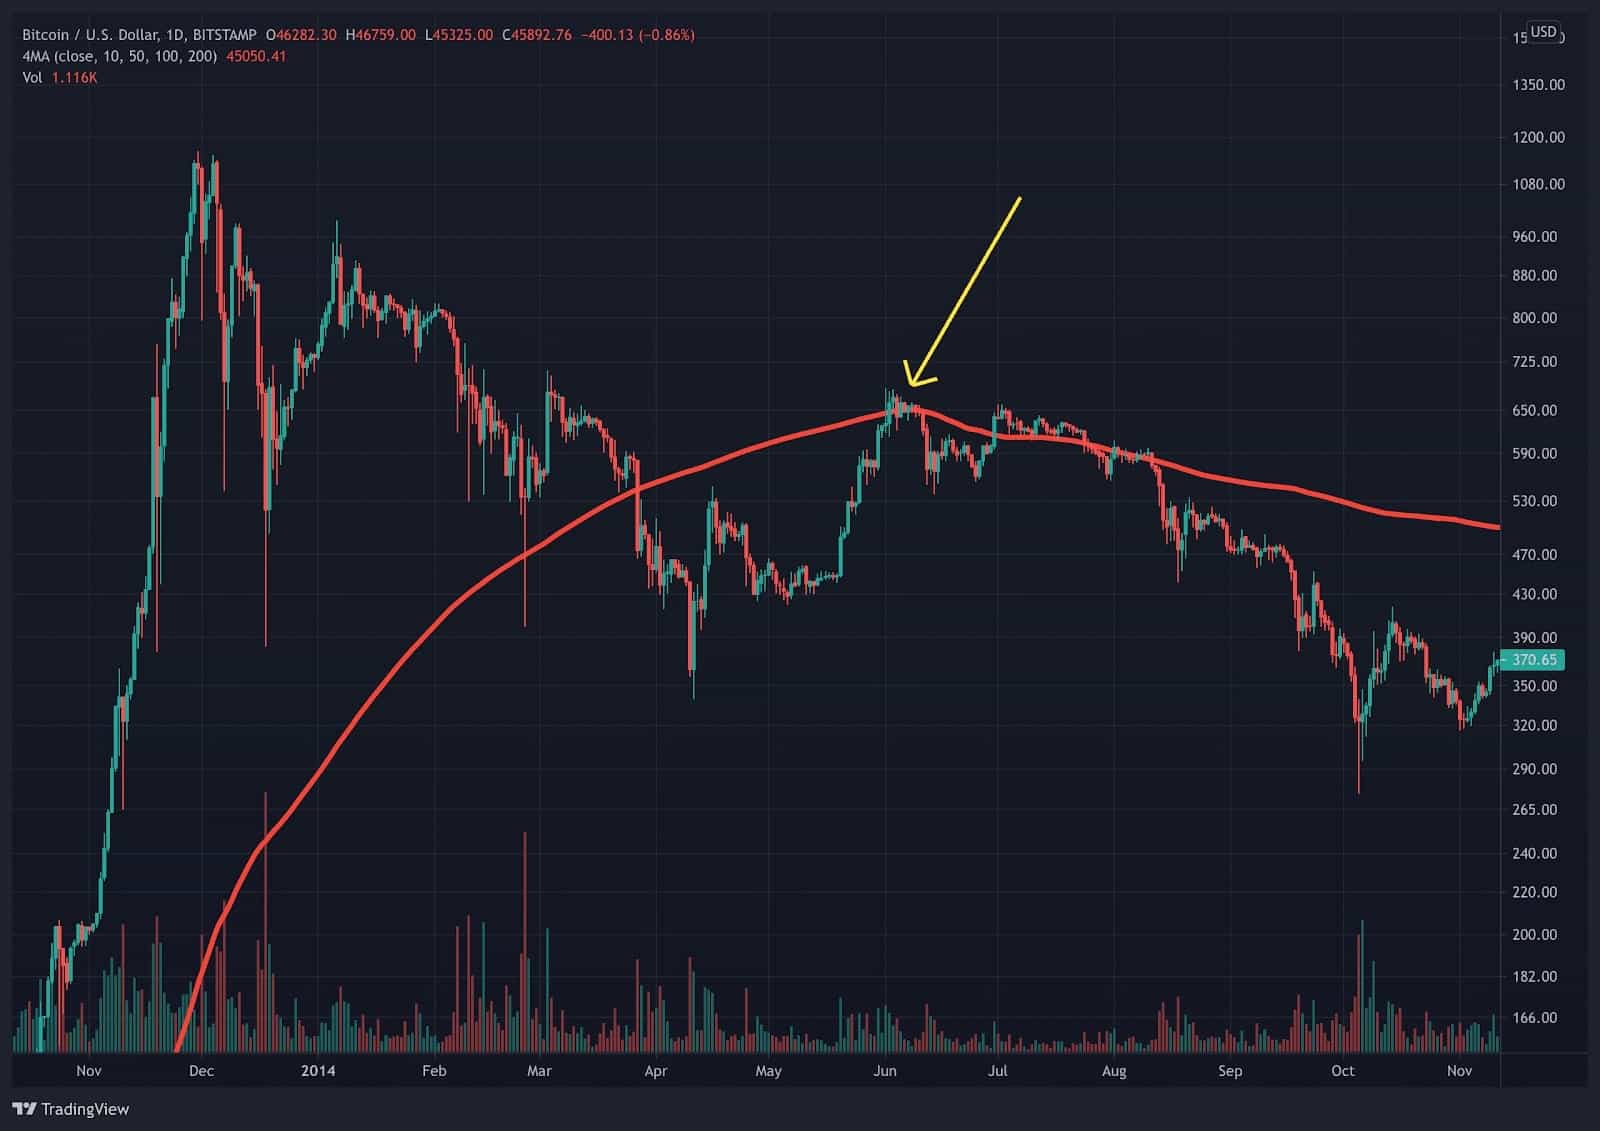
For the current setup, if BTC pushes sideways for the next 1 to 2 months and fails to retest the all-time highs, this could significantly increase the downside risk. This will likely cause the 21-week moving average to fall below the 40-week moving average, a historical signal of a bear market. This bearish crossover occurred after the 2013 and 2017 bull market peaks, leading to a significant downside, with multiple exit rallies from whales.
Current Onchain Signals Remain Bullish – No Signs of Whales Exiting
BTC bears have been claiming the recent 62% rally from the lows at $29.2k is a bear market rally where whales sell into strength, leaving retail holding the bag. The latest on-chain data from Glassnode contradicts the bear’s claims showing the age of coins being moved recently is 3 to 6 months. Older coins held by HODLers have remained relatively flat, signaling the long-term holders are not selling this rally.
Glassnode also highlighted the 2018 bear market where long-term holders exited en-masse every time BTC had a huge relief rally, as shown the large spikes in coins moved older than 6 months of age.
In addition, yesterday’s BTC close showed strong spot buying, especially on Coinbase, registering a net outflow of 3490 BTC on spot exchanges. Coinbase saw more than 10,000 BTC withdrawn on the day BTC closed above the 200-day moving average.

With an early buy signal flashing, the bulls have taken one major step forward in reclaiming the most critical technical level. It is important for the bulls to hold the 200-day moving average in case of a backtest of support and to continue pushing higher to make multiple weekly closes above the 200-day moving average for further validation of the signal.
As long as on-chain data shows no signs of long-term holders selling, and BTC continues to follow through higher in the next few weeks, this should set BTC on the path to retesting all-time highs.