BTC has definitely surprised market participants lately after a 10-day green streak, managing to break above K. Just overnight, BTC staged a last-minute rally and made the first daily close above the top of the trading range closing at .2k. Chart by TradingViewBitcoin Overcomes K On July 28th, 2021, the third-largest BTC whale transferred 3000 BTC to Coinbase, signaling near-term caution on price. As we reported, this has been a local top indicator on quite a few occasions in the past. The cryptocurrency then saw a minor correction from a high of .9k to a low of .3k. The bulls managed to stage a solid recovery, marking the first daily close above the 2-month long trading range between k and k. This is the first major step in transitioning from the
Topics:
Daniel Joe considers the following as important: Bitcoin (BTC) Price, BTC Analysis, BTCEUR, BTCGBP, btcusd, btcusdt
This could be interesting, too:
Chayanika Deka writes XRP, SOL, and ADA Inclusion in US Crypto Reserve Pushes Traders on Edge
Chayanika Deka writes Why Arthur Hayes Is Bullish on Bitcoin Under Trump’s Economic Strategy
Mandy Williams writes Why the Bitcoin Market Is Stuck—and the Key Metric That Could Change It: CryptoQuant CEO
Wayne Jones writes Metaplanet Acquires 156 BTC, Bringing Total Holdings to 2,391
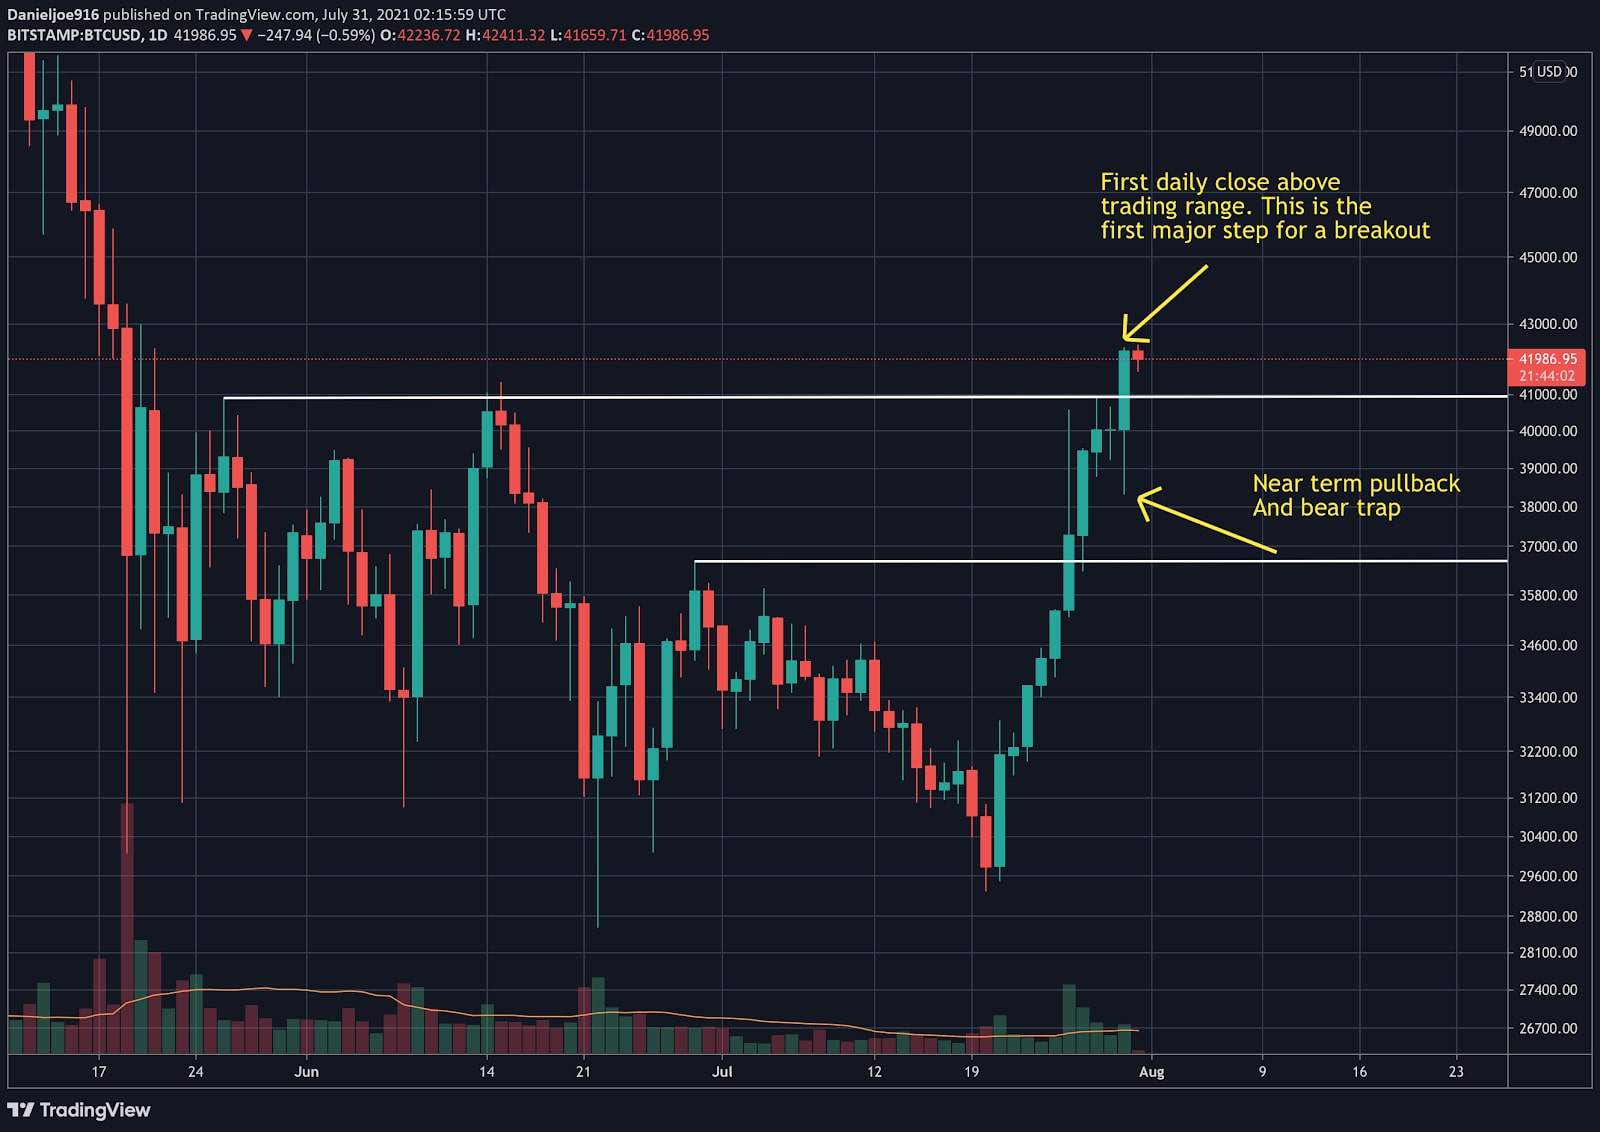
BTC has definitely surprised market participants lately after a 10-day green streak, managing to break above $40K. Just overnight, BTC staged a last-minute rally and made the first daily close above the top of the trading range closing at $42.2k.
Bitcoin Overcomes $40K
On July 28th, 2021, the third-largest BTC whale transferred 3000 BTC to Coinbase, signaling near-term caution on price. As we reported, this has been a local top indicator on quite a few occasions in the past. The cryptocurrency then saw a minor correction from a high of $40.9k to a low of $38.3k.
The bulls managed to stage a solid recovery, marking the first daily close above the 2-month long trading range between $30k and $40k. This is the first major step in transitioning from the accumulation phase back into bull market continuation.
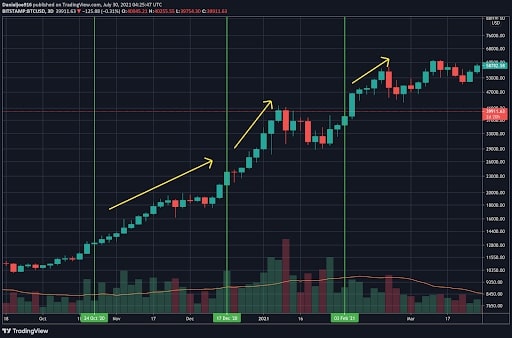
Throughout the impressive 10-day streak, BTC momentum on multiple time frames continued to trend higher, pushing above neutral zones. This is a very bullish signal of another large leg higher mid-term as these signals have flashed multiple times before in previous bull markets.
Notably, when BTC makes 9 consecutive daily candles higher, this has historically led to mid-term rallies, as shown in the chart below.
Previous resistances are now near-term support at $41.3k, $40.9k, and $40k. Ideally, these levels need to hold on a backtest.
Confirmation Needed
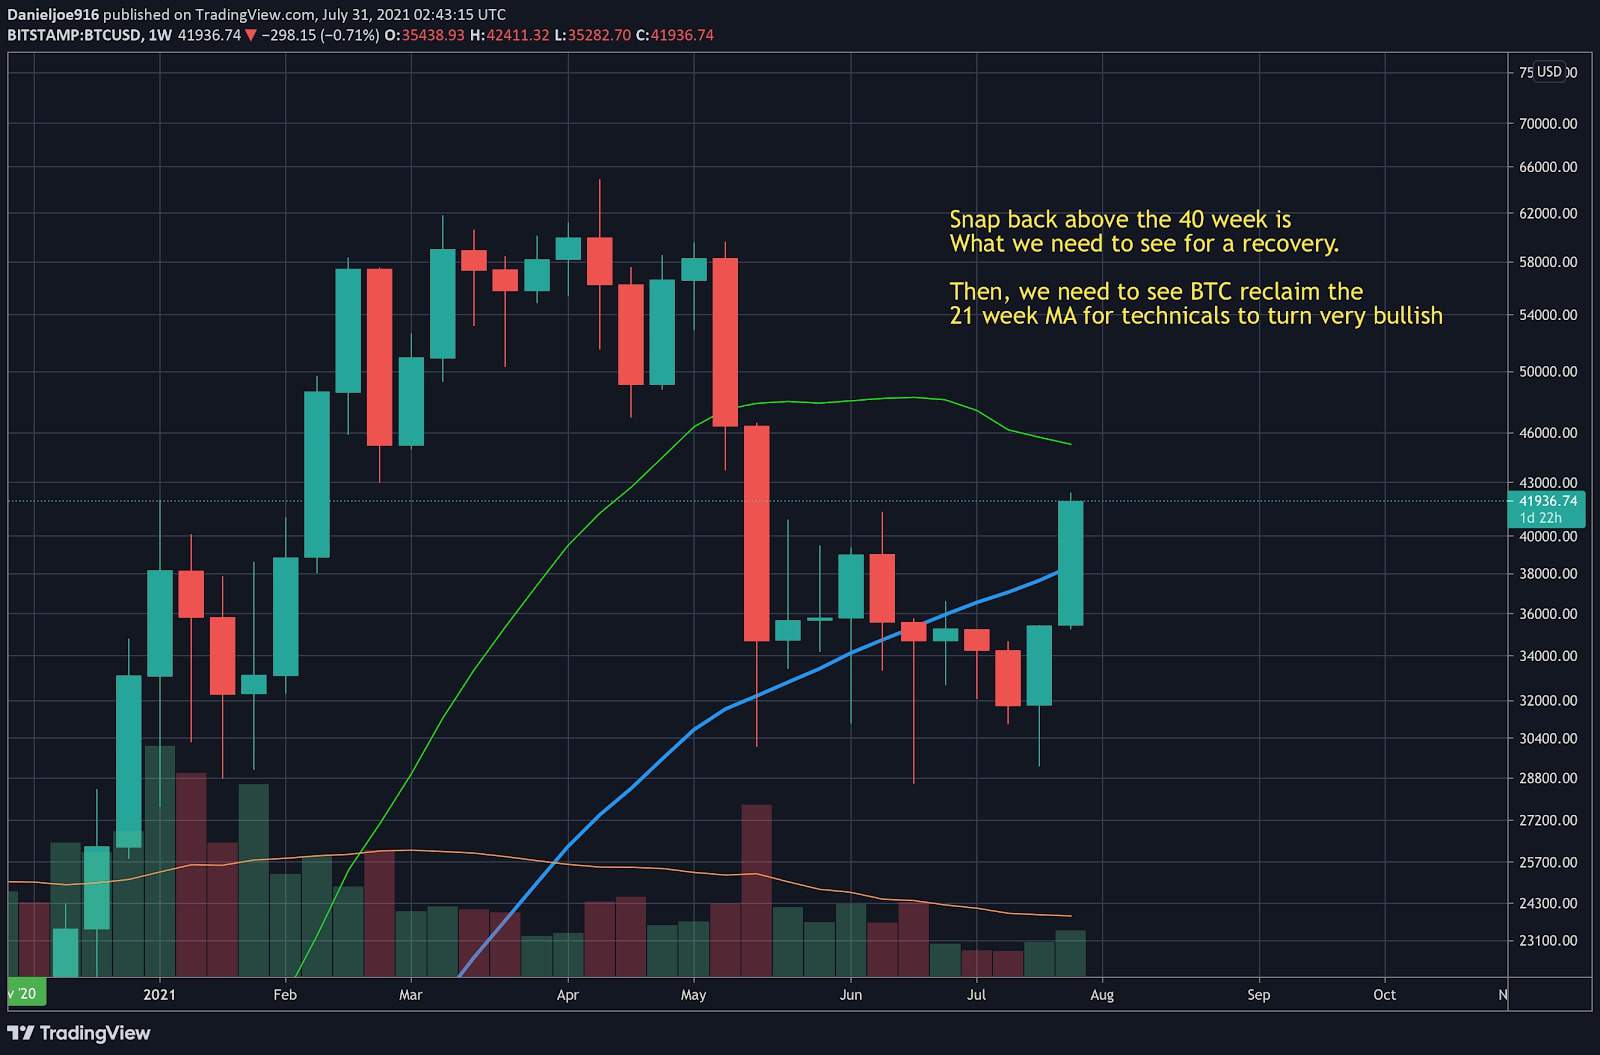
The recent price action is very bullish for BTC, but we have to wait for the weekly close for validation. Last week, BTC printed a weekly hammer candle, a signal of a potential reversal, especially after snapping back above $30k. The cryptocurrency needs to close at the highs this week to validate the pattern.
Although near-term price action is bullish, BTC remains below resistance at the 200-day MA and the 21-week MA, both critical levels to reclaim. The technicals will turn very bullish if BTC can successfully close and stay above these levels.
In aggregate, when considering bullish technicals, significantly improving momentum, bullish on-chain metrics in net outflow exceeding inflows, accumulation, and the recent drop in exchange reserves, BTC hash rate recovering, and record network user growth, the current set-up looks very favorable for the bulls.