BTC continues to consolidate with multiple retests of the critical .7k higher low. Recent global risk-off added some selling pressure to BTC, but so far, it appears .7k is holding support with a solid push higher, reaching .3k at the time of writing. BTC continues to hold a larger technical structure as k has been established as significant support. Even with negative news, macro risk-off, and a rising dollar, Bitcoin has been showing resilience by holding .7k multiple times in the past week. Chart by TradingView.7k is a very important level to hold, as it is the deepest higher low BTC can make to complete the Wave 2 corrective wave. Falling below .7k will increase the probability of retesting k or potentially wicking down to .3k to .3k due to
Topics:
Daniel Joe considers the following as important: Bitcoin (BTC) Price, BTC Analysis, BTCEUR, BTCGBP, btcusd, btcusdt
This could be interesting, too:
Chayanika Deka writes XRP, SOL, and ADA Inclusion in US Crypto Reserve Pushes Traders on Edge
Chayanika Deka writes Why Arthur Hayes Is Bullish on Bitcoin Under Trump’s Economic Strategy
Mandy Williams writes Why the Bitcoin Market Is Stuck—and the Key Metric That Could Change It: CryptoQuant CEO
Wayne Jones writes Metaplanet Acquires 156 BTC, Bringing Total Holdings to 2,391
BTC continues to consolidate with multiple retests of the critical $40.7k higher low. Recent global risk-off added some selling pressure to BTC, but so far, it appears $40.7k is holding support with a solid push higher, reaching $42.3k at the time of writing.
BTC continues to hold a larger technical structure as $40k has been established as significant support. Even with negative news, macro risk-off, and a rising dollar, Bitcoin has been showing resilience by holding $40.7k multiple times in the past week.
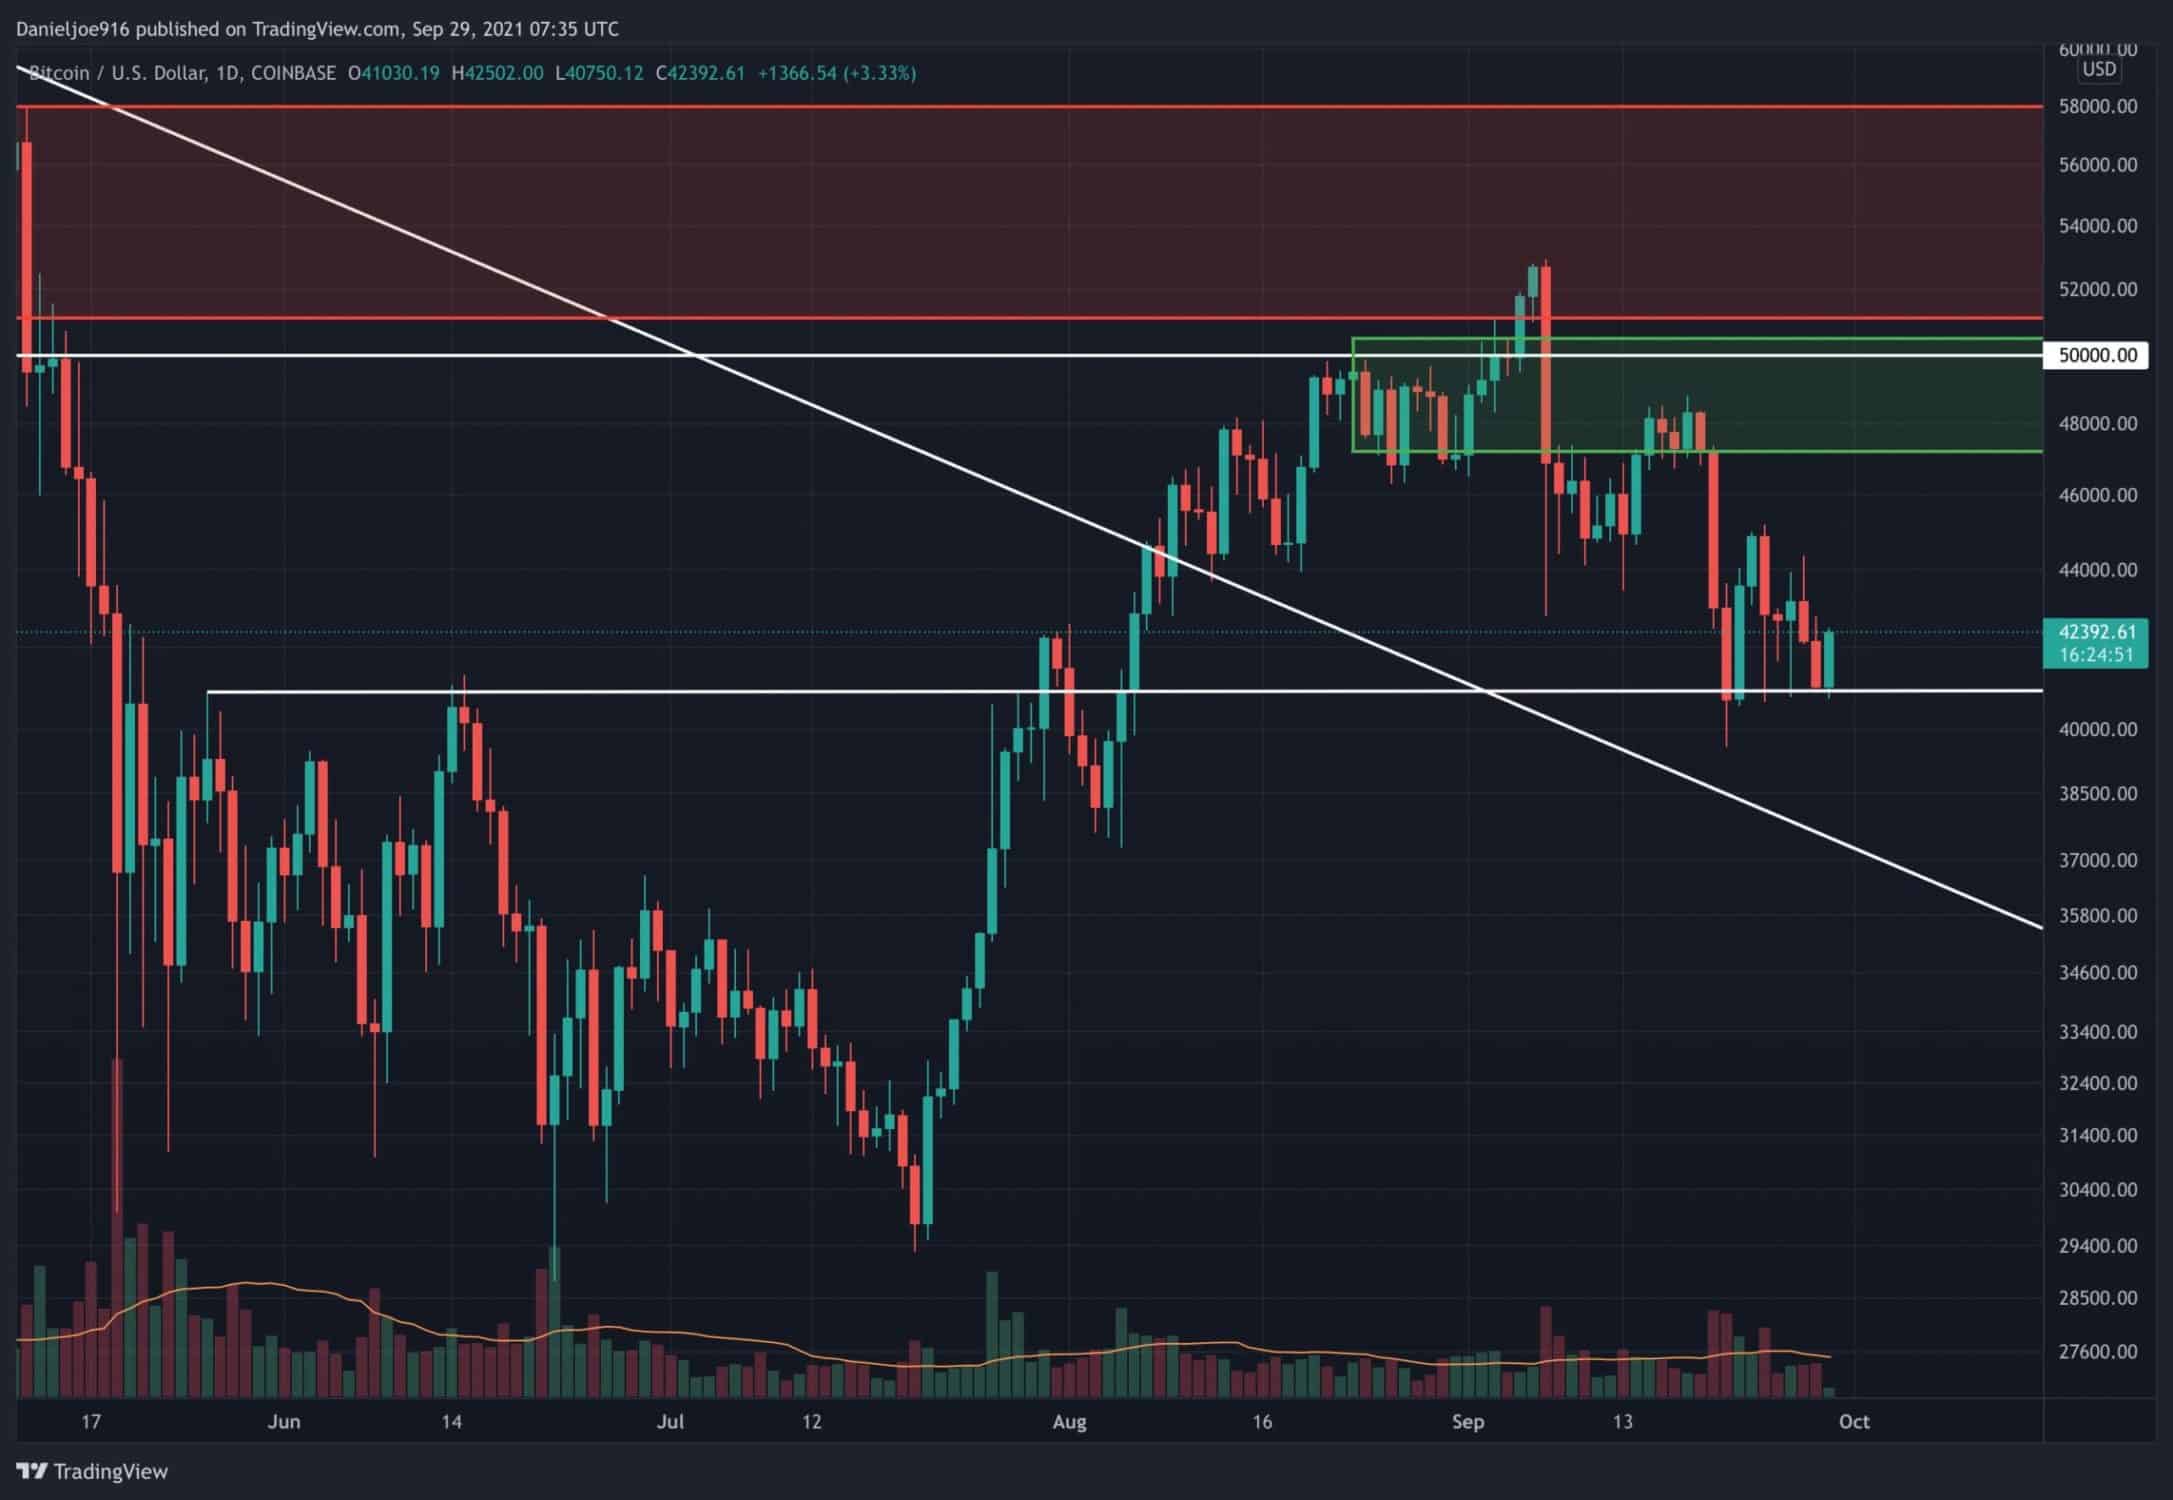
$40.7k is a very important level to hold, as it is the deepest higher low BTC can make to complete the Wave 2 corrective wave. Falling below $40.7k will increase the probability of retesting $40k or potentially wicking down to $37.3k to $39.3k due to liquidations or further risk-off in global stocks.
Open Interest Remains Flat
Near term, open interest has remained flat, holding around $8B even with the drawdown from $45.2k to $40.7k in the past week. Previous drawdowns from $52.9k had very large multi-billion dollar liquidations, which triggered cascades of forced selling, pushing spot prices lower as weak hands panic sold.
For the past two weeks, the size of liquidations has been trending lower, which is a positive signal, suggesting less weak hands are positioned and remaining in the market looking to sell at current prices.
This could explain why BTC continues to hold $40.7k despite the dollar rising and global stocks falling. For the short term, it is critical for BTC to hold $40.7k as support. If $40.7k is retested for the fourth time, the probability of breaking support will increase, potentially sending BTC lower towards $37.3k to $40k.
On-Chain Metrics Continue Showing Strong Accumulation
As we reported for weeks, the long-term holders have not sold the recent drawdowns and have continued to accumulate. Most of the selling pressure came from liquidation events and panic selling from weak hands.
Although the near-term price action has been weak, on-chain metrics are showing no major warnings of a bear market.
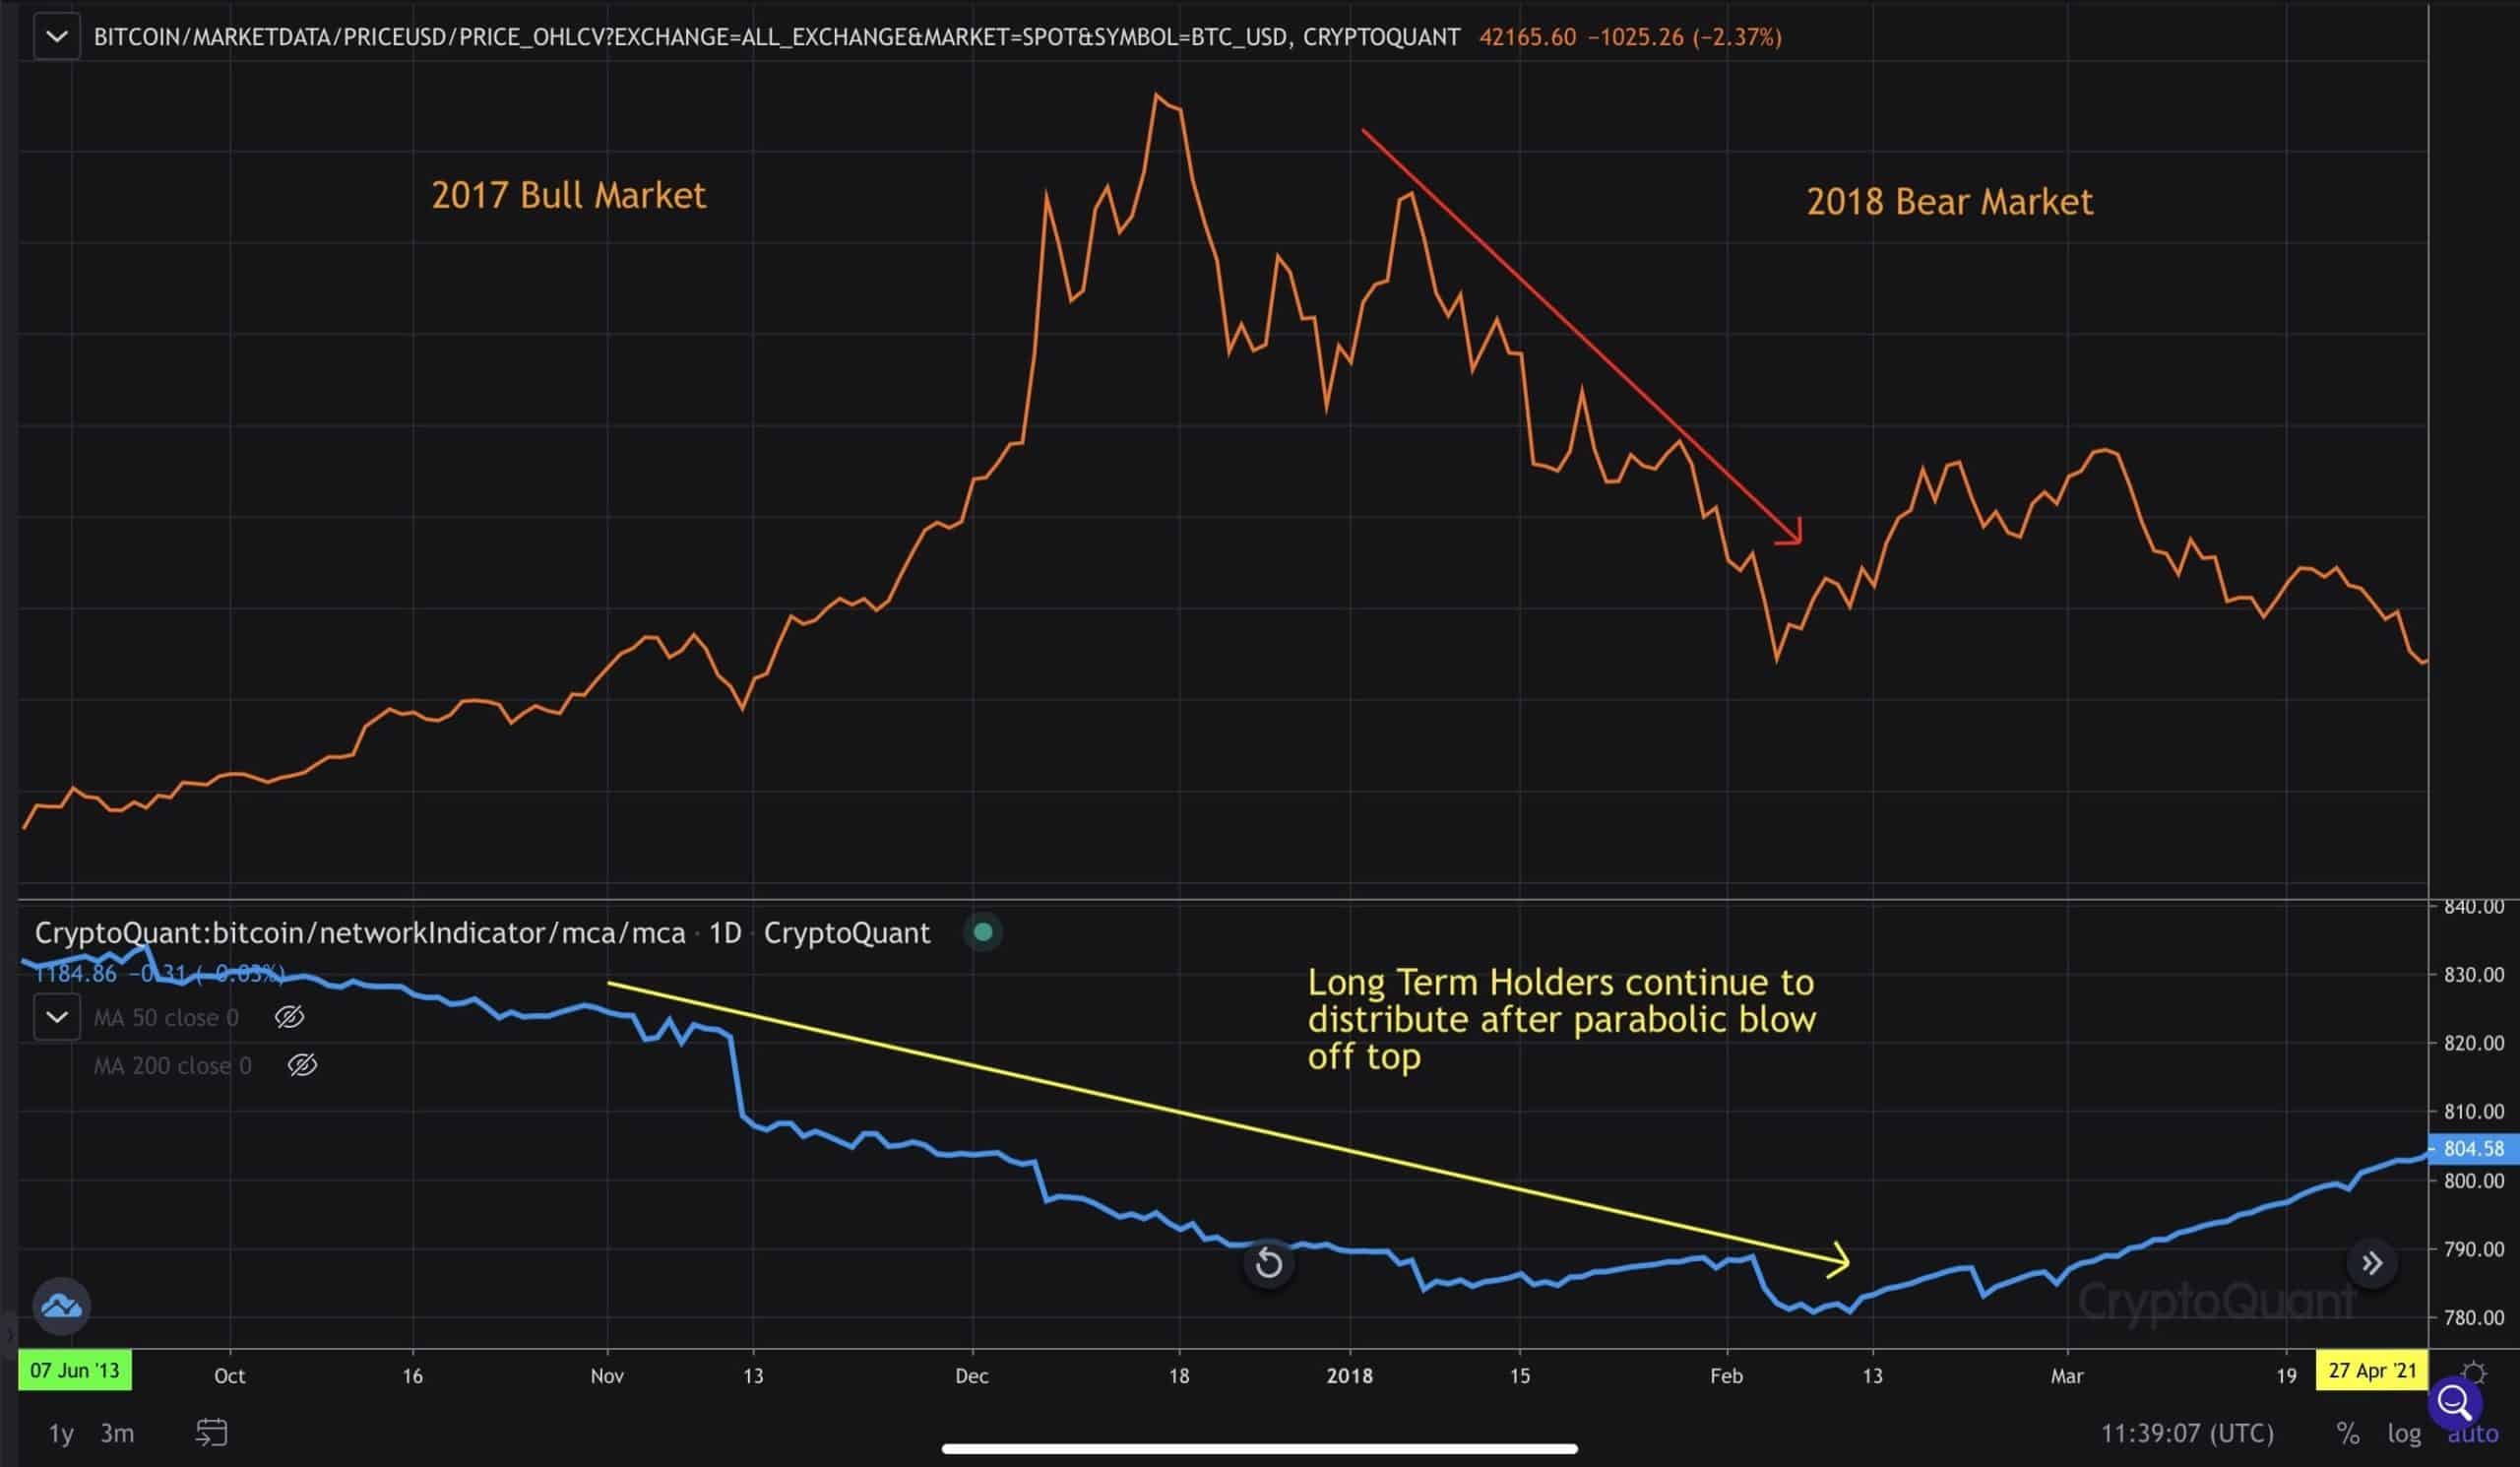
Bear markets occur after parabolic blow-off tops, with deep price corrections, where long-term holders and miners continue to aggressively distribute.
The 55% crash in May 2021 did not lead to further distribution from long-term holders and miners. Instead, they began to accumulate, strongly suggesting this is not a bear market.
The charts below highlight the Mean Coin Age movement during BTC’s post bull market runs in 2013 and 2017, heading into the bear market. The Mean Coin Age continued falling after BTC peaked, which confirms further distribution from long-term holders.
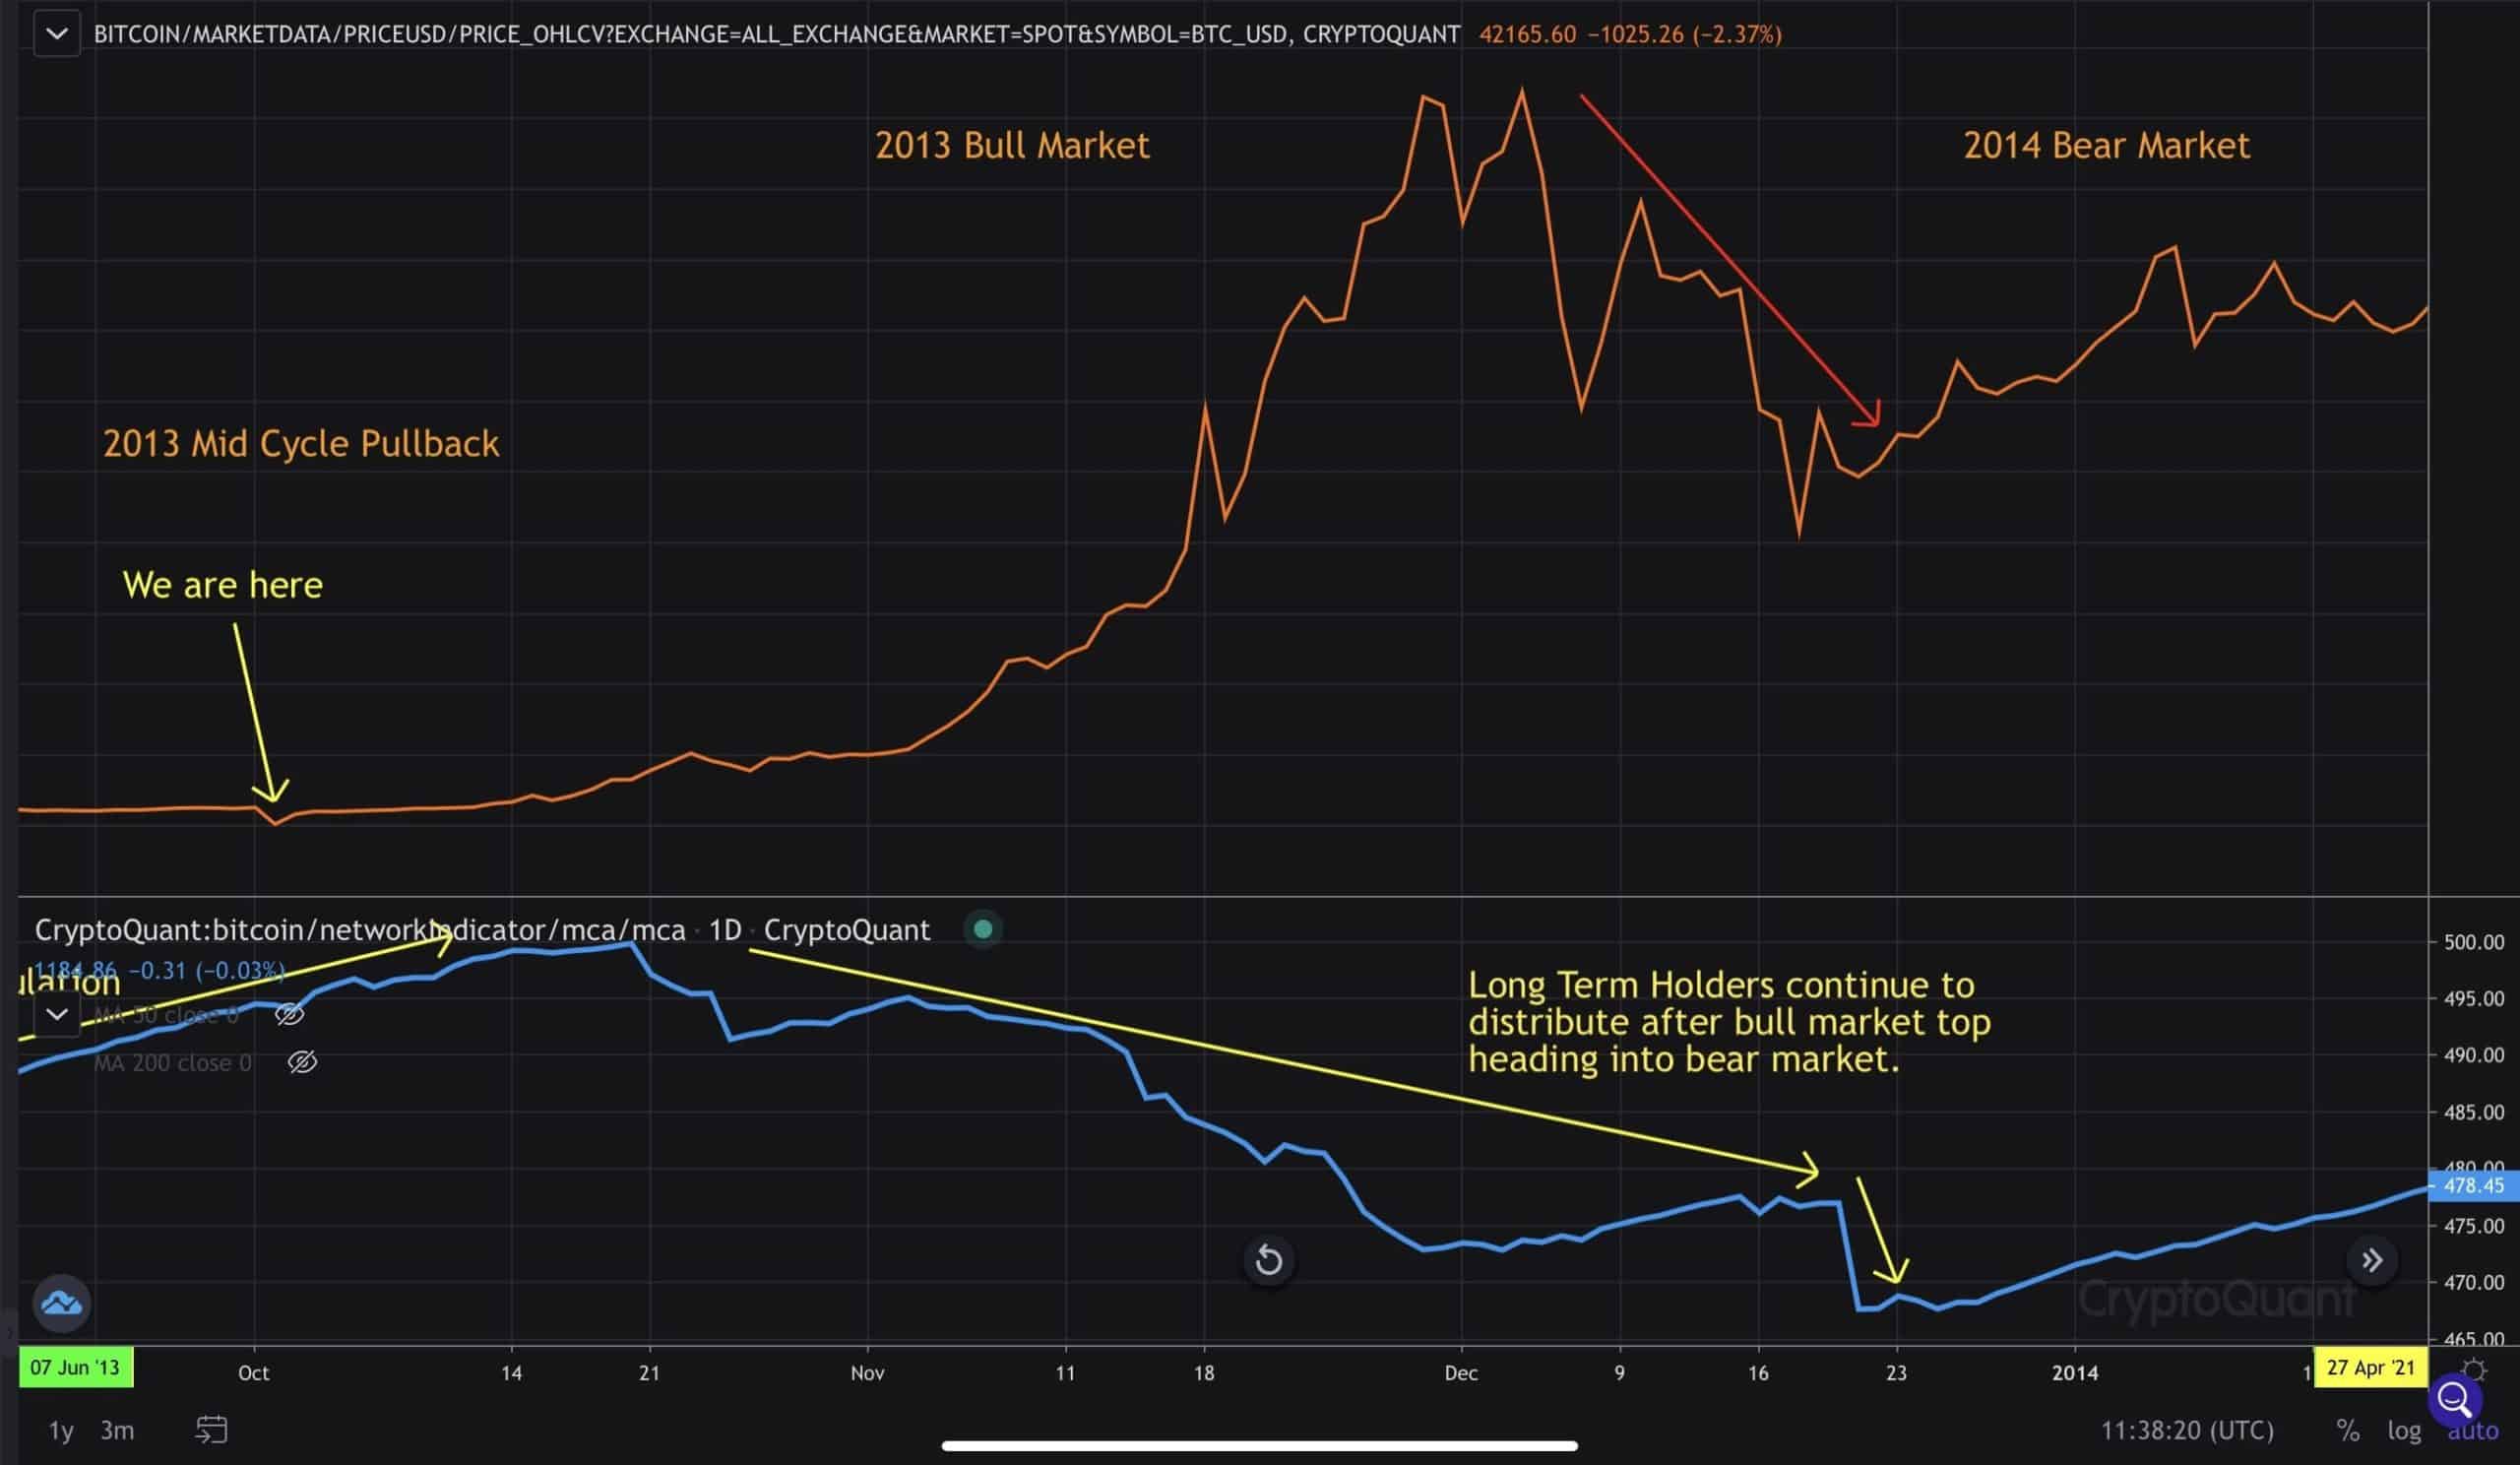
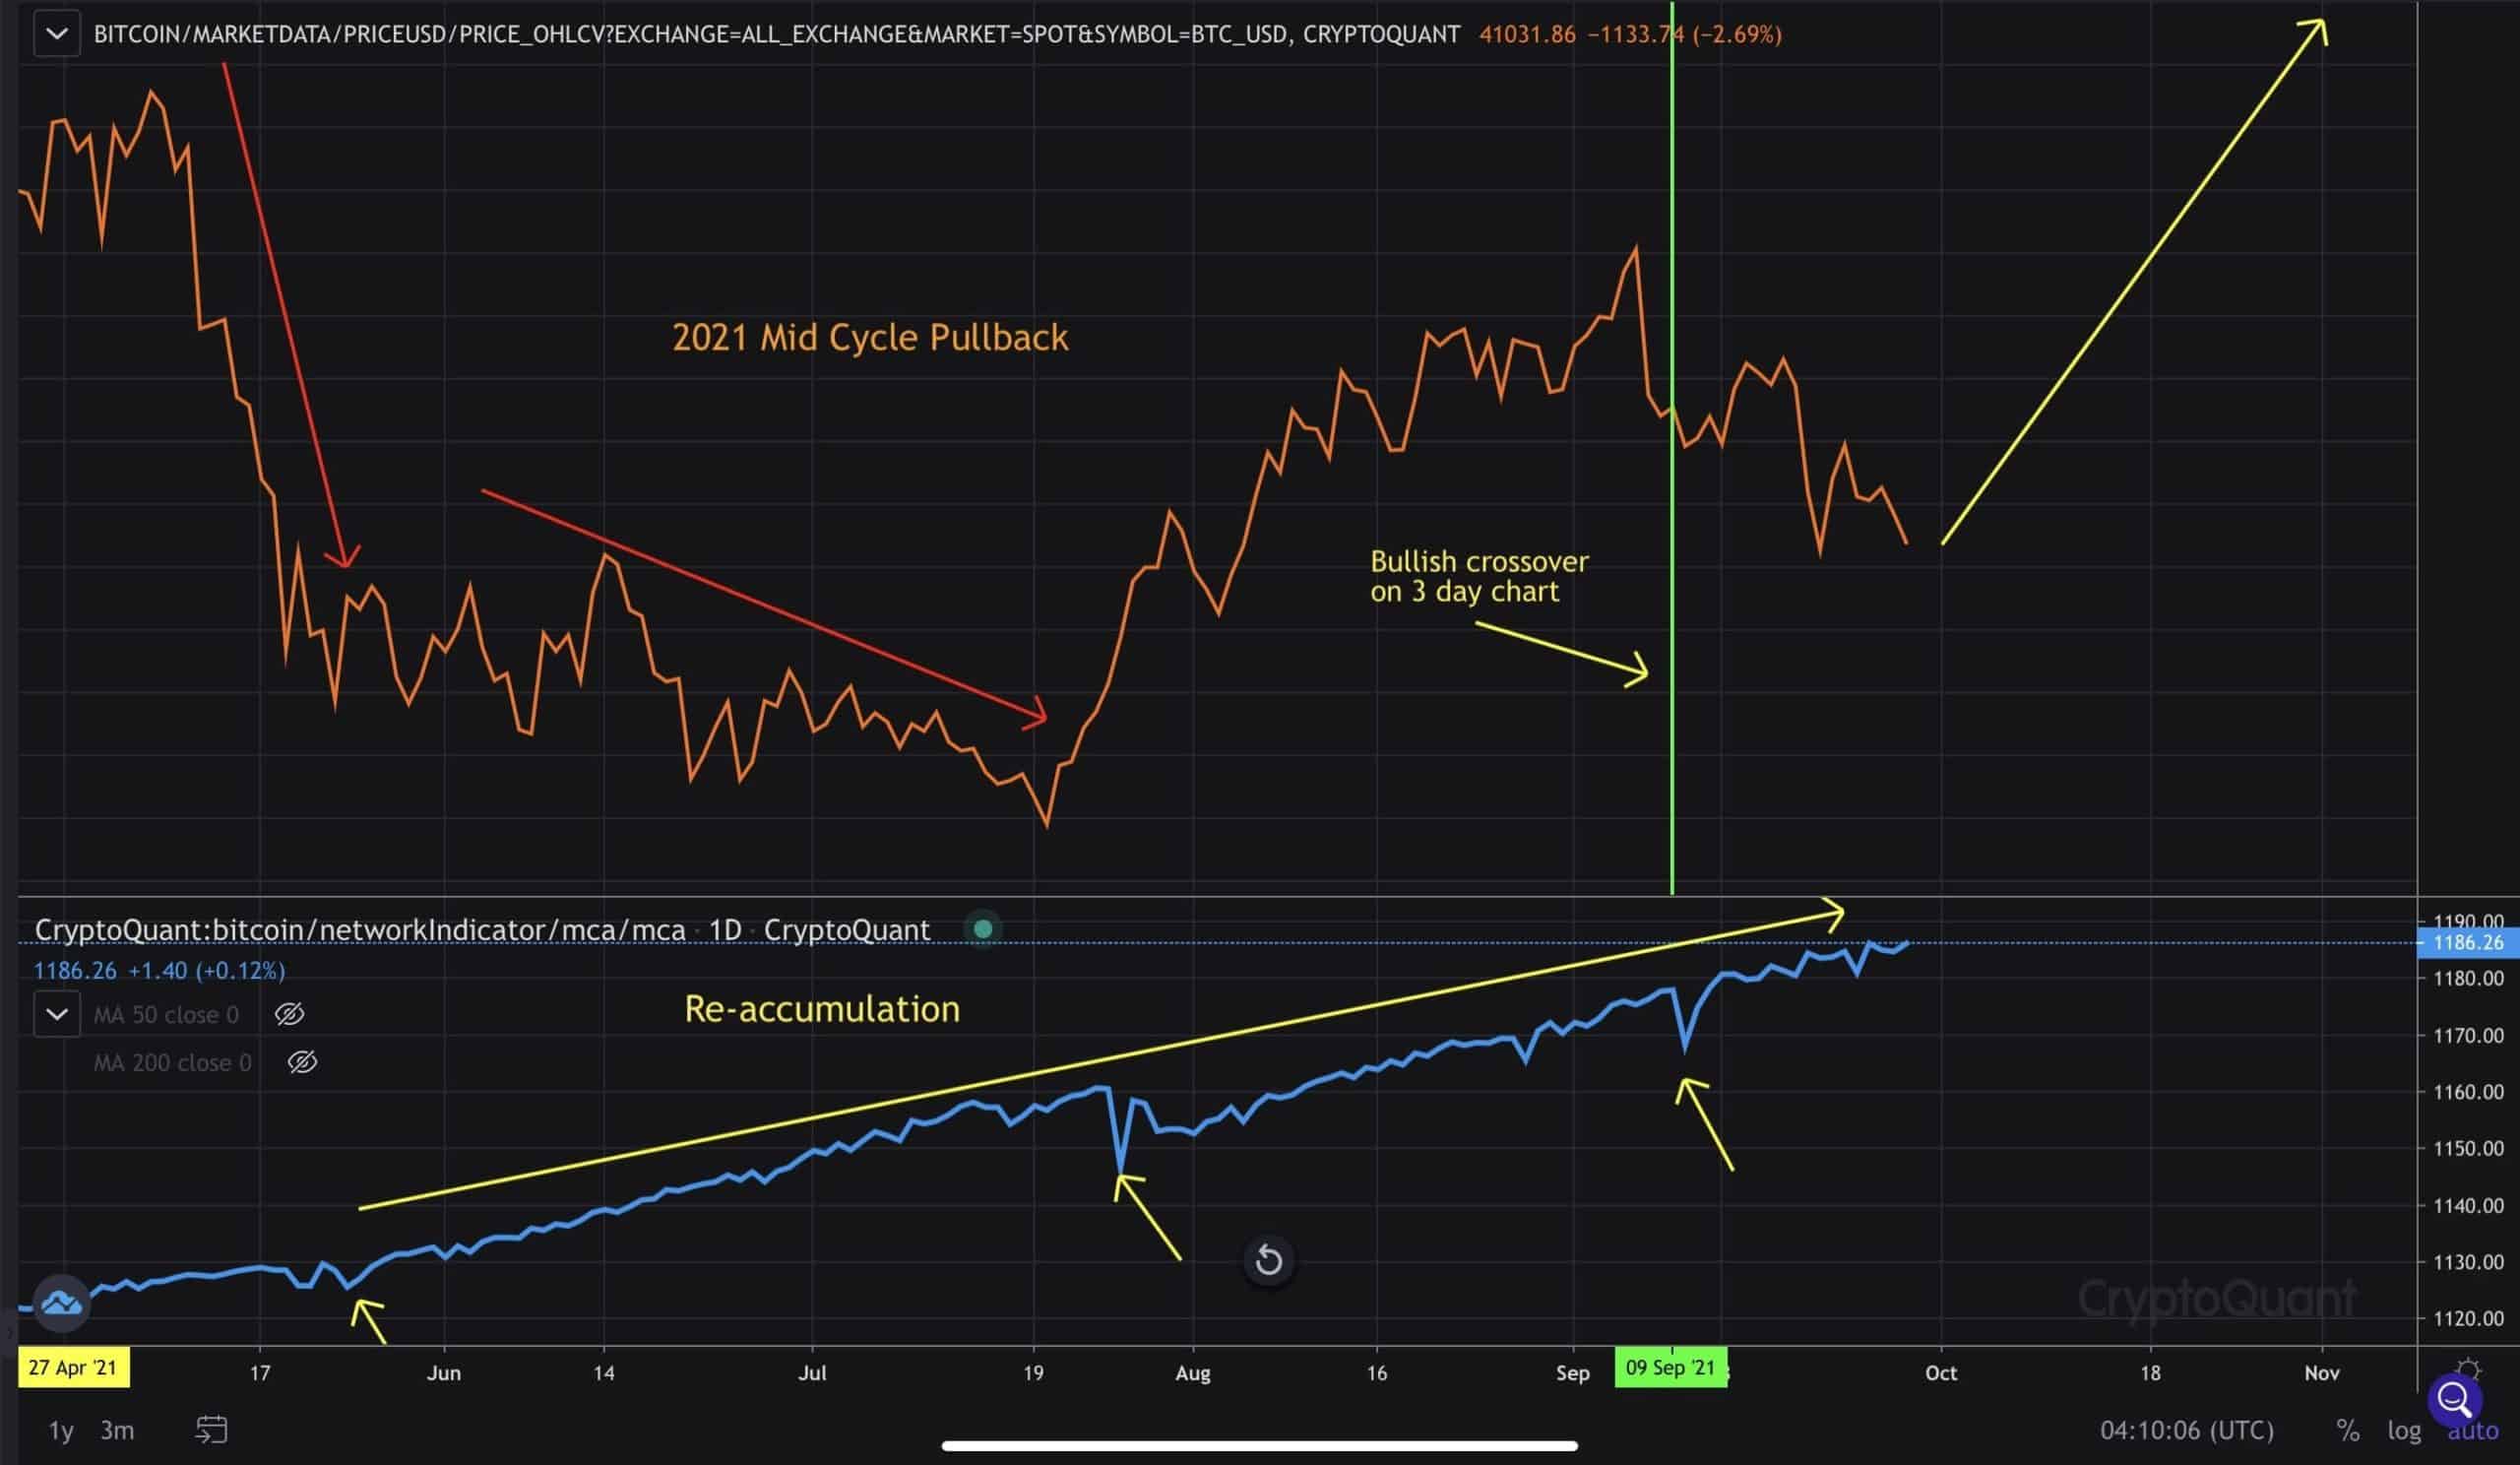
The next chart shows the 2021 mid-cycle pullback where BTC fell 55% from the highs at $64.8k to $30k. The Mean Coin Age started to trend higher, confirming long-term holders were accumulating instead of selling.
This is exactly what occurred in the 2013 mid-cycle pullback. After BTC spent around six months consolidating with the Mean Coin Age trending higher, BTC made new all-time highs and began the parabolic blow-off top phase to complete the 2013 bull market.
What to Watch
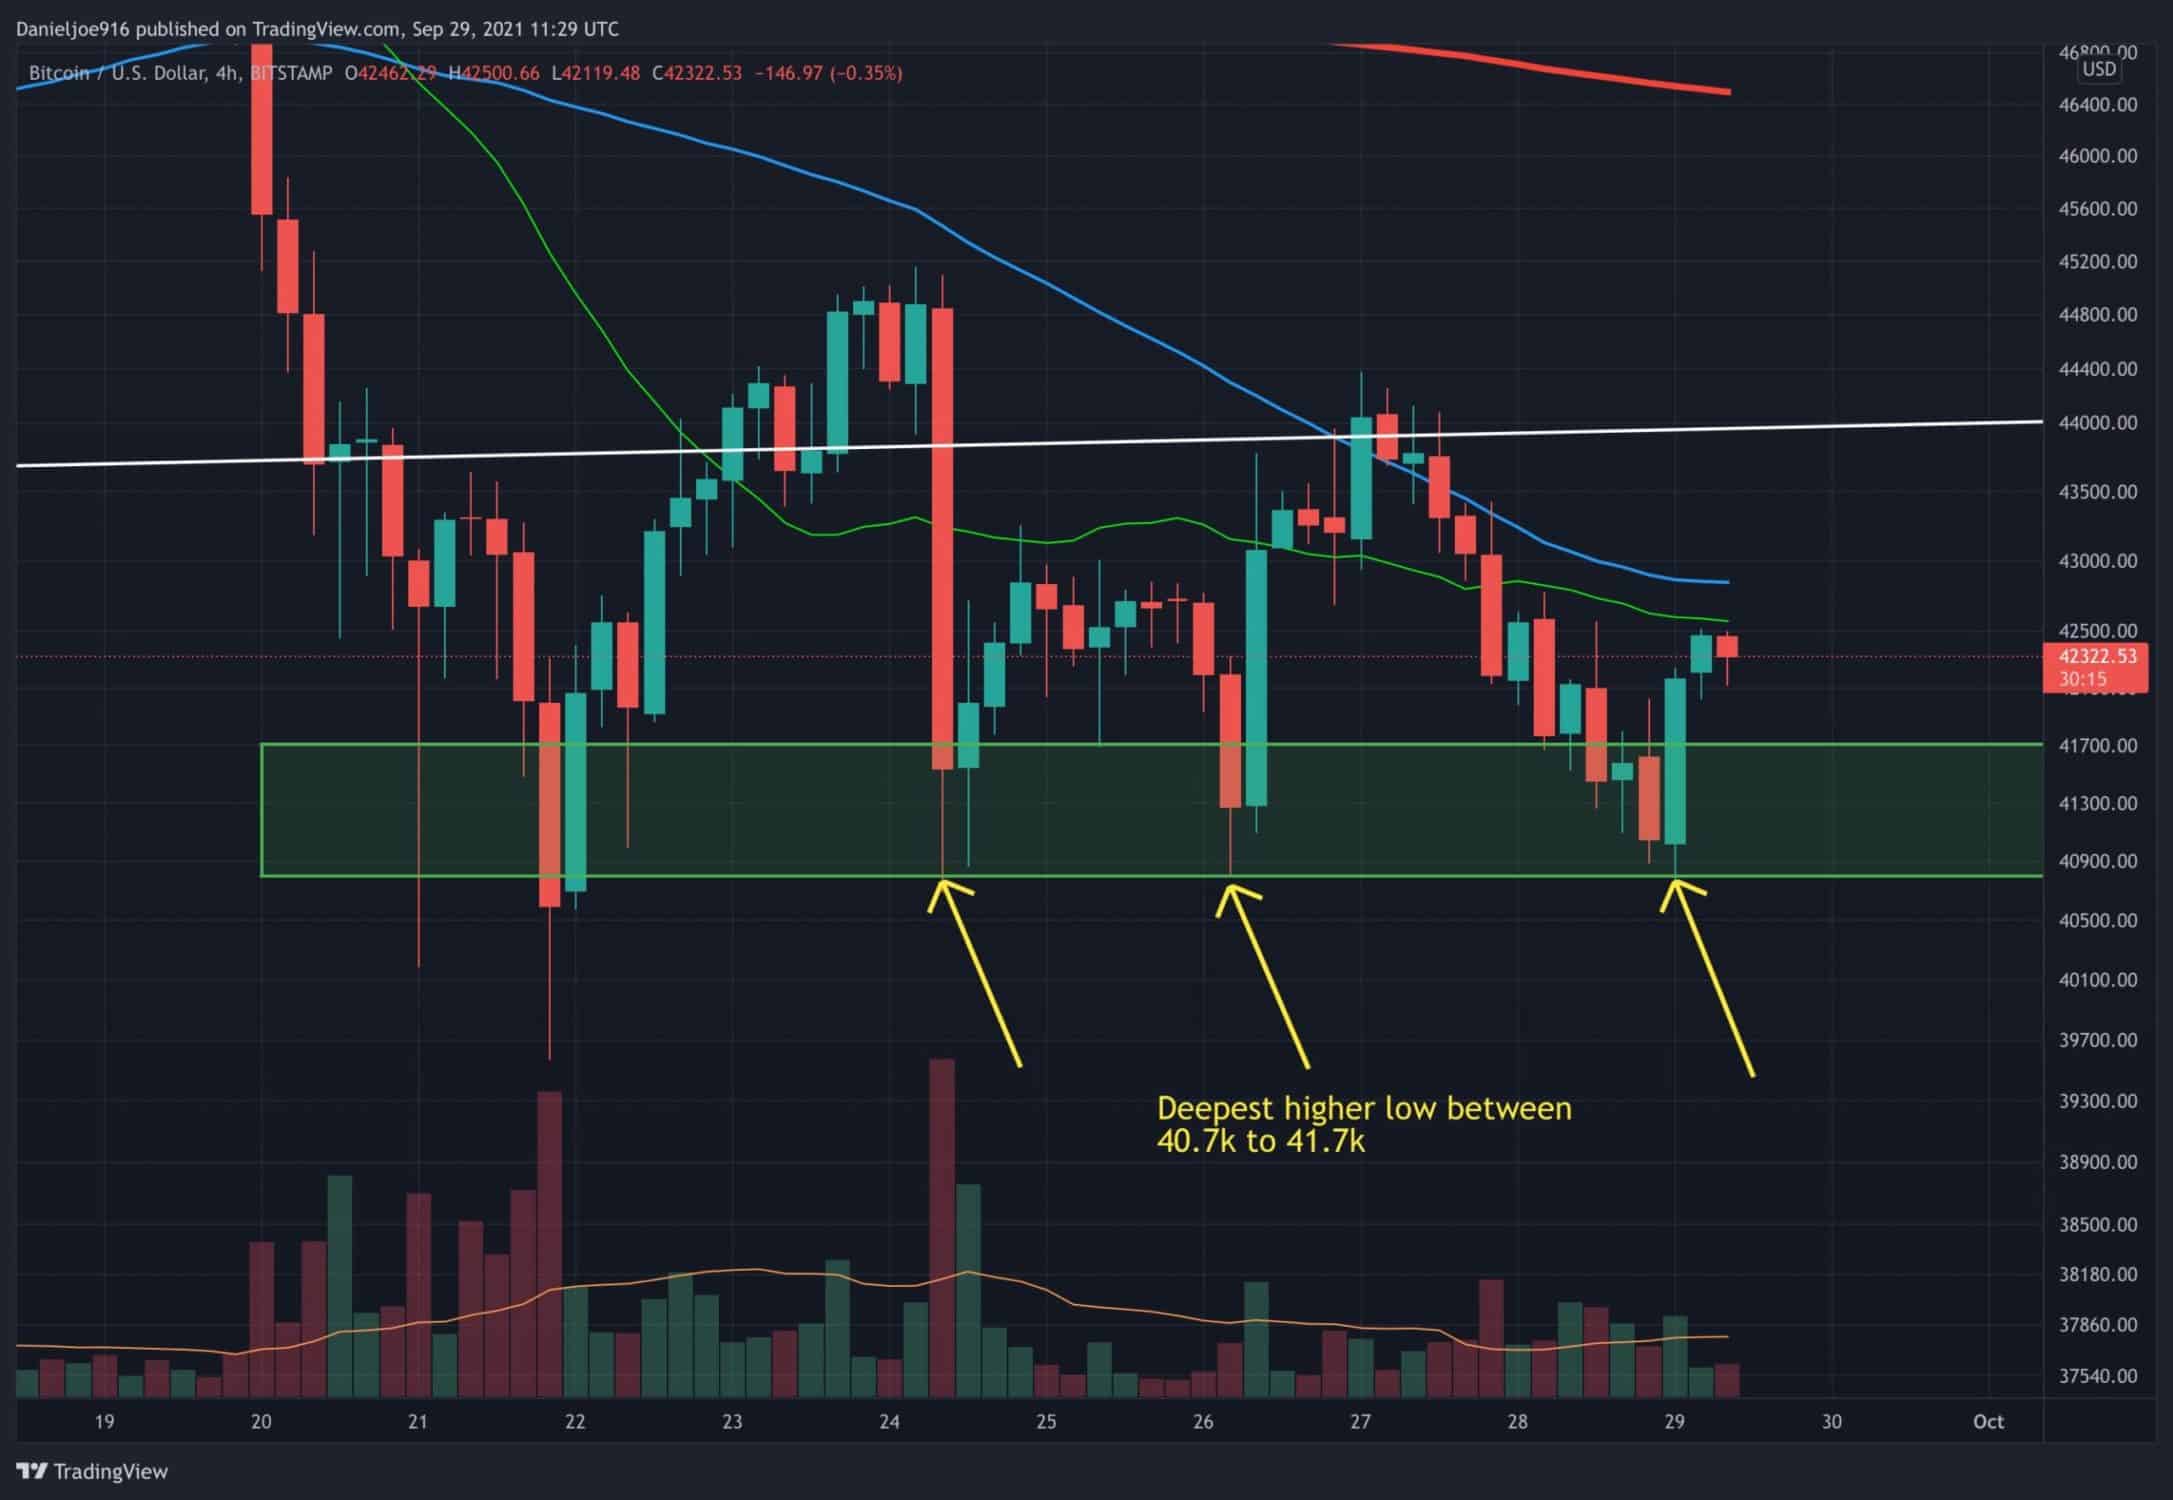
Near term, it is critical for BTC to continue holding $40.7k as the higher low for Wave 2 completion. The more $40.7k is tested, the higher the probability it will be broken. It is important for BTC to continue pushing higher to make a high above $45.1k this week.
The 4-hour chart is showing signs of consolidation with the 21 and 50 hours moving average flattening. This indicates a potential attempt for BTC to push towards the key $45.1k level, completing the near-term consolidation. If the breakout attempt fails, and $40.7k struggles to hold support, BTC could see downside risk from $37.3k to $40k.
Despite the near-term uncertainty and risk-off, the overall trend in fundamental and on-chain remains firmly bullish as long-term holders and miners are not distributing aggressively. The strong accumulation and HODL behavior of these entities is a positive sign. This pullback could be a near-term shake-out, in the middle of a bull market, with significant upside ahead later this year.