BTC made another attempt to reclaim the 200-day moving average but was met with selling pressure as global stocks fell again amid fear of the Federal Reserve tapering asset purchases. This may be a near-term headwind for the largest cryptocurrency, but the overall fundamentals, on-chain data, technicals, and momentum remain strong. Chart by TradingViewAs we covered last week, there has been a bearish divergence forming on the 4-hour and daily chart, a near-term warning of a local top and downside risk. Since forming a local top at .1k, BTC has lost around 8% and is now entering a short-term support zone between .9k to .5k. This level shows a high level of confluence as there are many support points such as the rising trendline, the previous downtrend line now
Topics:
Daniel Joe considers the following as important: Bitcoin (BTC) Price, BTC Analysis, BTCEUR, BTCGBP, btcusd, btcusdt
This could be interesting, too:
Chayanika Deka writes XRP, SOL, and ADA Inclusion in US Crypto Reserve Pushes Traders on Edge
Chayanika Deka writes Why Arthur Hayes Is Bullish on Bitcoin Under Trump’s Economic Strategy
Mandy Williams writes Why the Bitcoin Market Is Stuck—and the Key Metric That Could Change It: CryptoQuant CEO
Wayne Jones writes Metaplanet Acquires 156 BTC, Bringing Total Holdings to 2,391
BTC made another attempt to reclaim the 200-day moving average but was met with selling pressure as global stocks fell again amid fear of the Federal Reserve tapering asset purchases. This may be a near-term headwind for the largest cryptocurrency, but the overall fundamentals, on-chain data, technicals, and momentum remain strong.
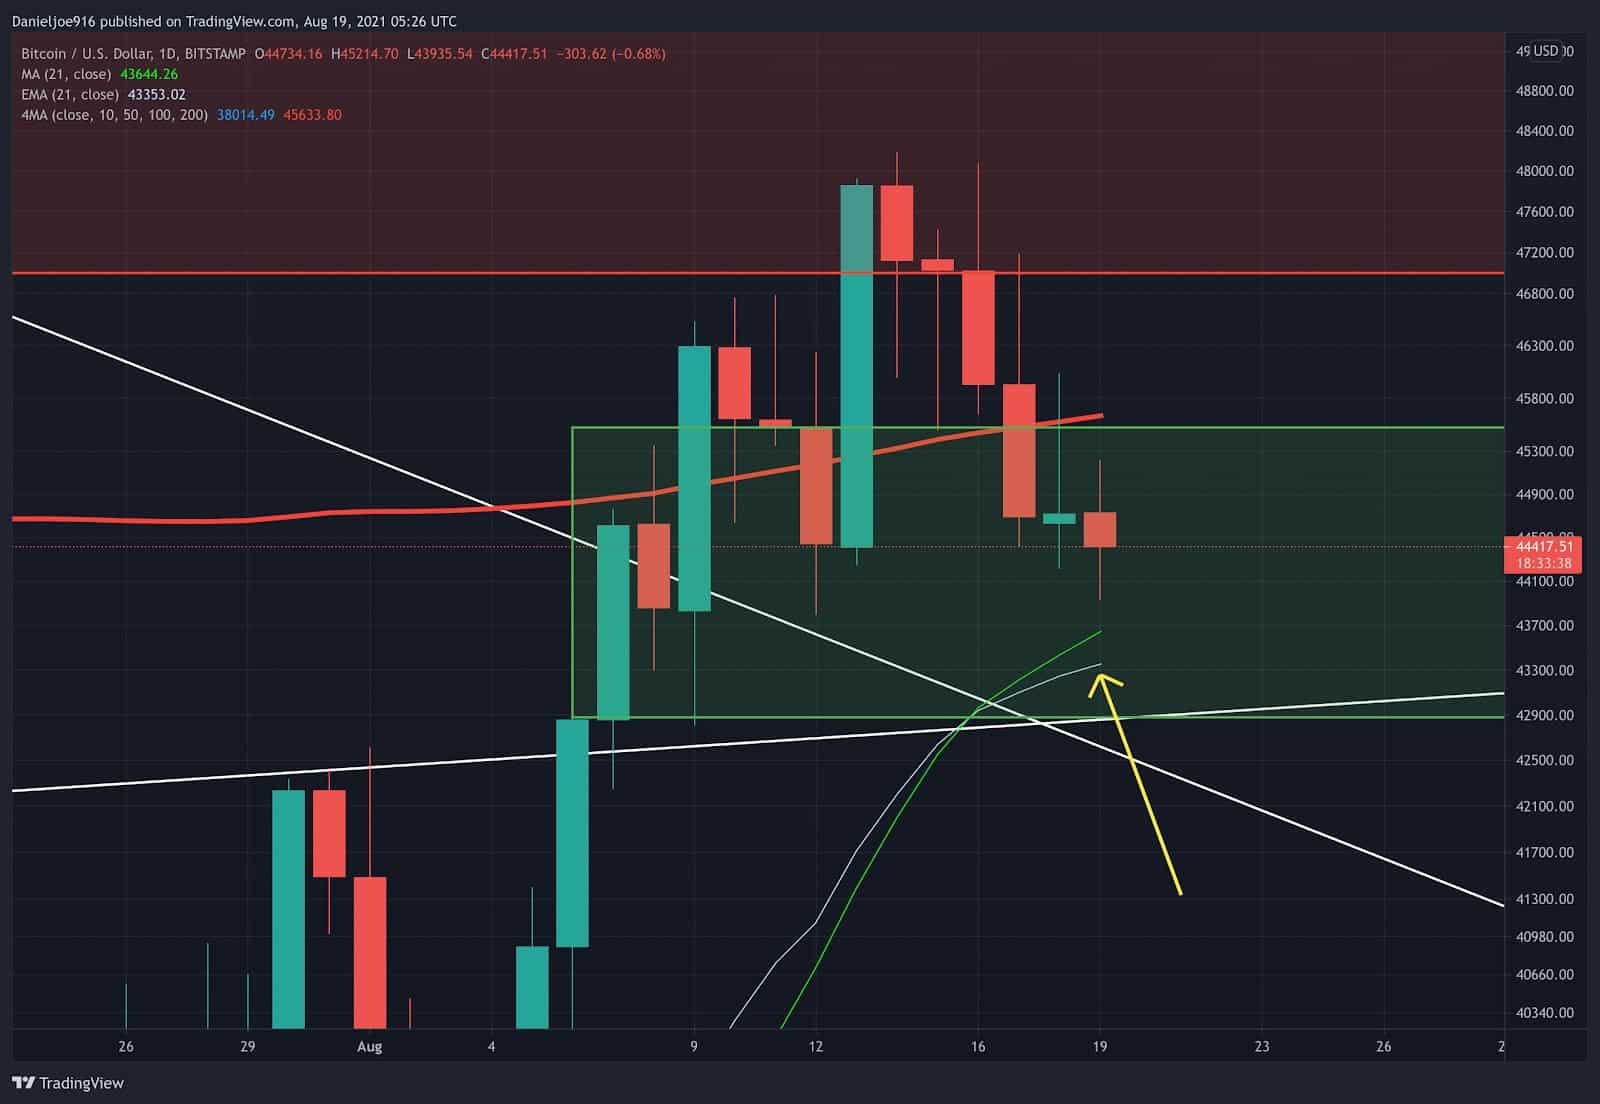
As we covered last week, there has been a bearish divergence forming on the 4-hour and daily chart, a near-term warning of a local top and downside risk. Since forming a local top at $48.1k, BTC has lost around 8% and is now entering a short-term support zone between $42.9k to $45.5k. This level shows a high level of confluence as there are many support points such as the rising trendline, the previous downtrend line now support, the 21-day moving average, and other key technical support levels.
BTC Must Hold This Support Zone
It is important for BTC to hold this zone of support and push back up to reclaim the 200-day moving average heading into the weekly close to validate the largest technical buy signal flashing since April 2020.
Failure to hold $42.9k could send BTC back towards the top of the trading range at $40.9k to $41.3k, which could damage the market structure and increase the risk to the downside. This is a scenario the bulls must avoid because it would invalidate the buy signal and show a false break out, which could lead to a bear market.
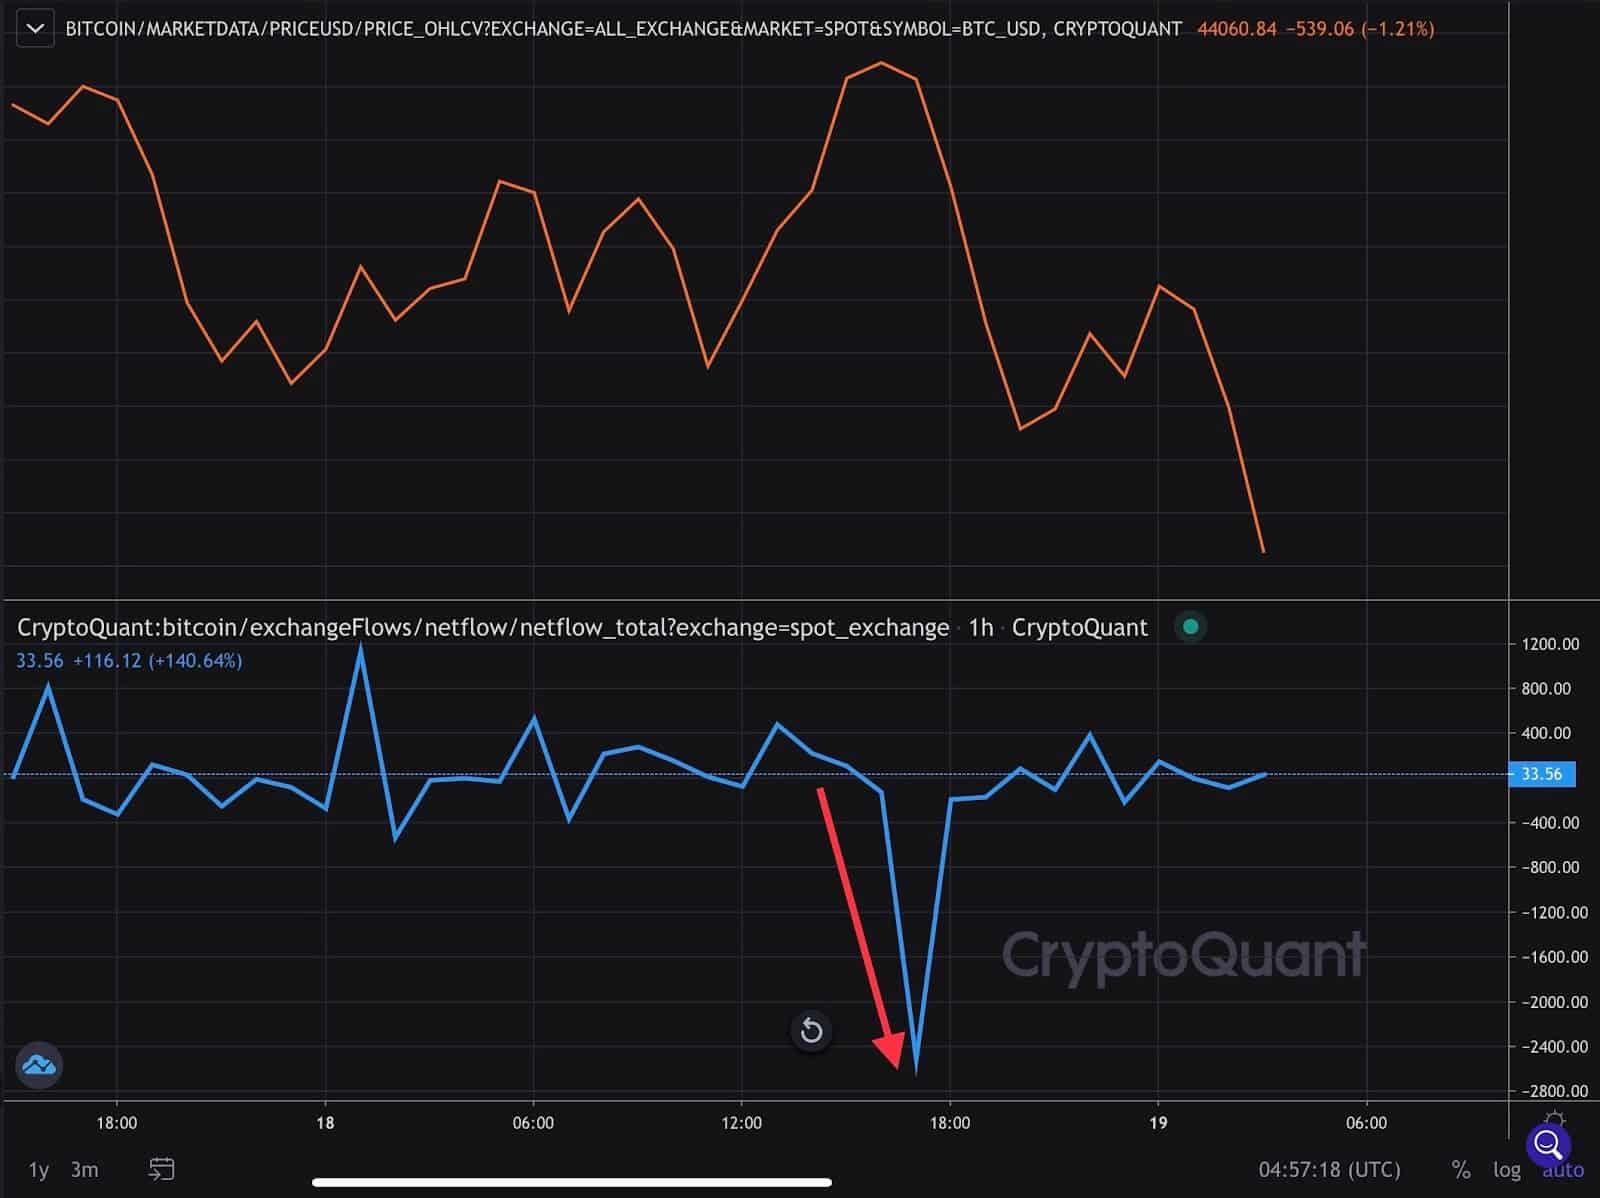
As of now, the on-chain analysis continues to show no major signs of selling pressure from entities holding illiquid supply. Just yesterday, spot exchange net outflow registered a whopping 2,500 BTC in 1 hour, also causing spot exchange reserves to drop. For the past 24 hours, spot exchange net flows have been negative – indicating accumulation.
Miner reserves continue to hold as they are not showing any signs of selling BTC at current prices. The funding rate remains neutral to negative, and the futures open interest is flat. This continues to indicate that the market is skeptical of the BTC rally and is likely net short. This means if spot buying pressure continues, the probability of a short squeeze will increase, sending BTC significantly higher.
BTC Outperforming Stocks
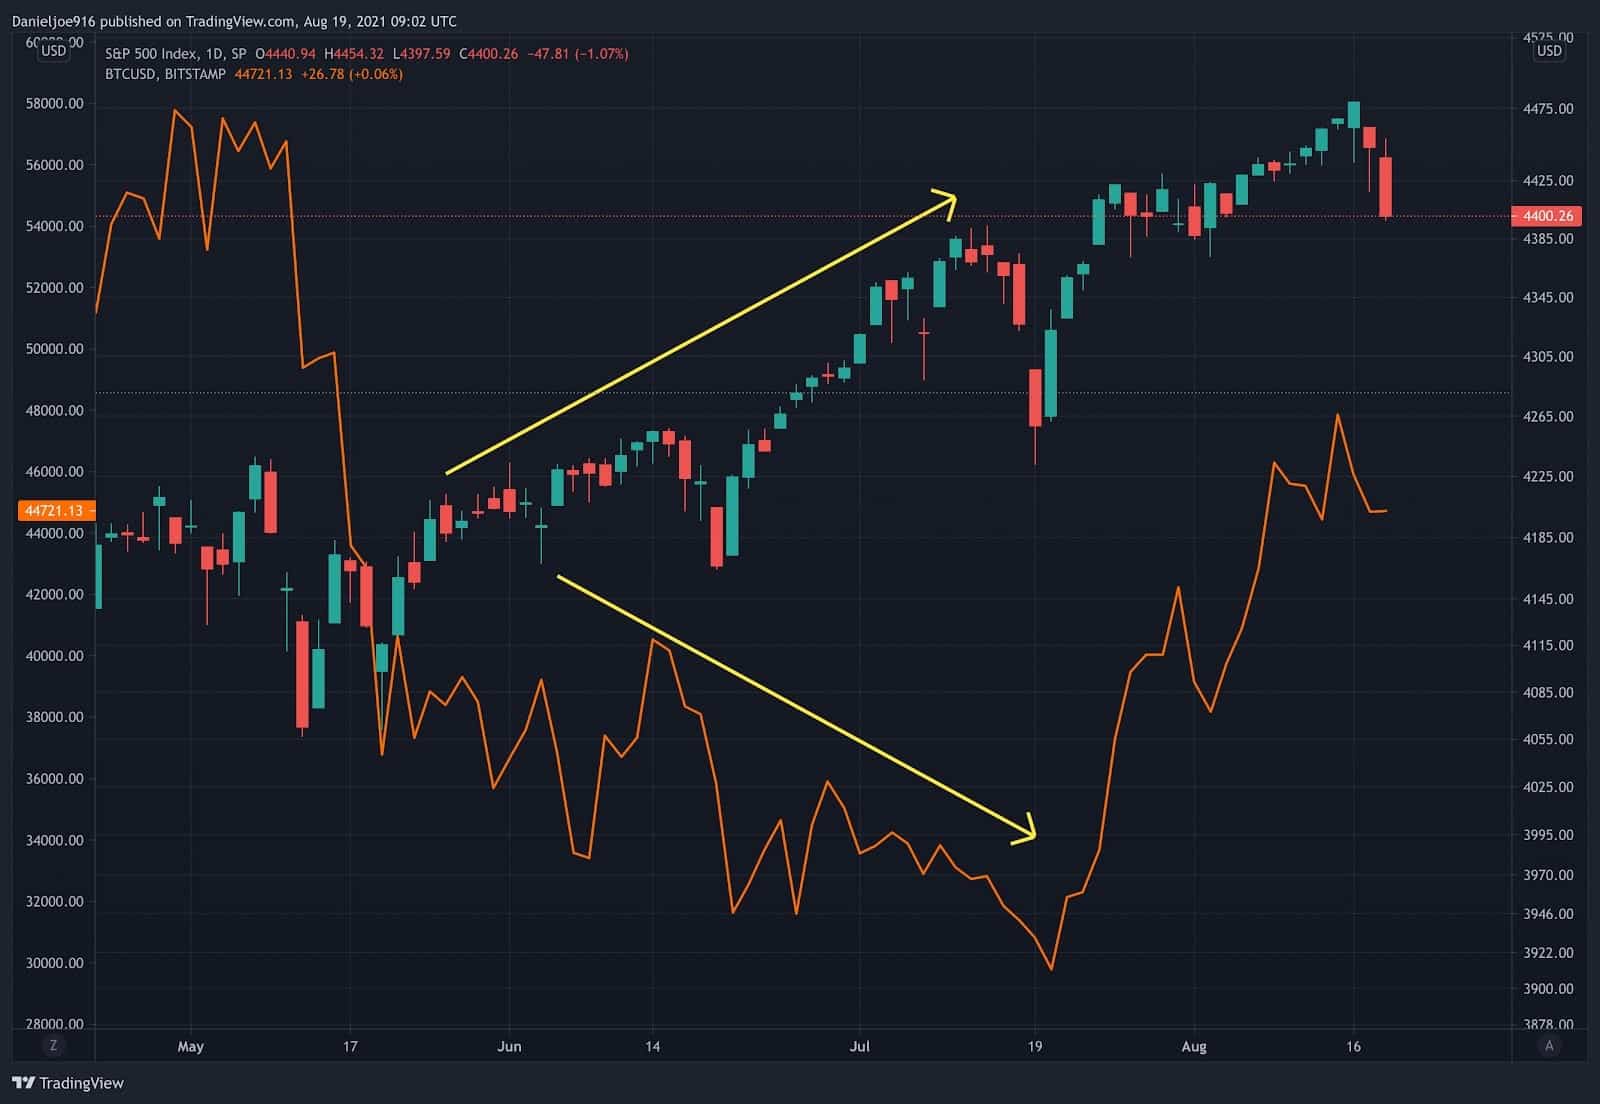
Looking from a macro perspective, BTC has been outperforming the SPX since July. During the long consolidation between $30k to $40k, it significantly underperformed relative to the SPX.
Once July came around, BTC managed to find a bottom at $29.3k and saw a major trend reversal while breaking the divergence from the SPX. Since then, BTC has risen 33% compared to the SPX’s 1.86% gain as of yesterday’s closing prices.
What’s just as impressive is BTC outperforming the DXY or the dollar index. Usually, BTC and the DXY are inversely correlated. If the DXY rises, BTC typically falls. The DXY has been rising lately due to uncertainty in the market, but BTC has been pushing higher, which is a signal of strength for BTC.
At the time of writing, it’s very impressive to see BTC increasing while SPX futures are dropping .9%. This is a significant decrease in futures and could lead to price volatility when the stock market opens later today. In a risk-off environment, it’s notable to see BTC moving higher while the SPX is dropping significantly. Usually, bitcoin would also decline.

On-chain analysis has been strongly suggesting the long-term holders are not selling this rally and near-term pullback. The recent outperformance of BTC could be validating the on-chain signal.
With some time remaining until the weekly close, market participants will be watching closely to see how BTC performs in the current environment, and especially if it can successfully reclaim the 200-day moving average and make a weekly close higher to help validate the buy signal.