BTC’s impressive rally from .3k to .6k has significantly improved the technicals and especially the momentum for the largest cryptocurrency. Since finding a local top at .6k as we reported, the 4-hour and daily conditions for BTC became extremely overbought and overextended, with an increased risk of a near-term correction. When looking at market structure, it appears BTC has exited Phase C in the Wyckoff Accumulation schematic and is now in the early parts of Phase D. Chart by TradingViewBTC Reaches Supply Exhaustion When supply reaches exhaustion, meaning the majority of sellers willing to sell at a certain price range drops significantly, large operators may begin marking up the price as it would require less effort (volume) now that there are fewer sellers
Topics:
Daniel Joe considers the following as important: Bitcoin (BTC) Price, BTC Analysis, BTCEUR, BTCGBP, btcusd, btcusdt
This could be interesting, too:
Chayanika Deka writes XRP, SOL, and ADA Inclusion in US Crypto Reserve Pushes Traders on Edge
Chayanika Deka writes Why Arthur Hayes Is Bullish on Bitcoin Under Trump’s Economic Strategy
Mandy Williams writes Why the Bitcoin Market Is Stuck—and the Key Metric That Could Change It: CryptoQuant CEO
Wayne Jones writes Metaplanet Acquires 156 BTC, Bringing Total Holdings to 2,391
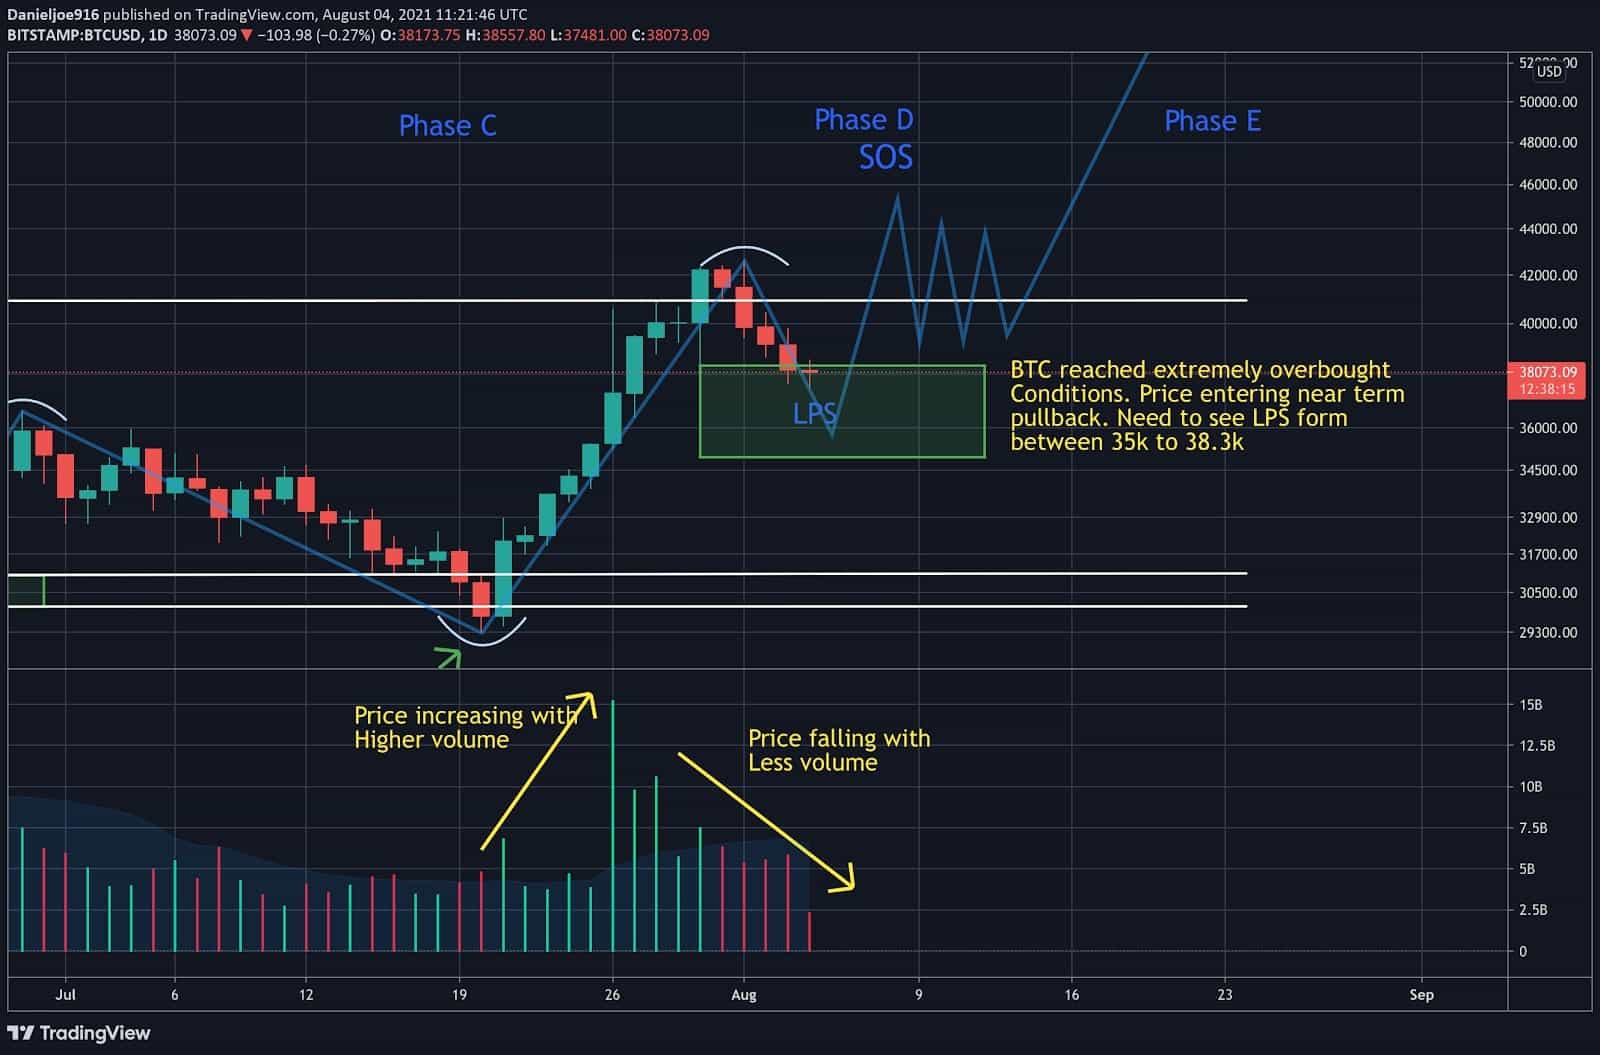
BTC’s impressive rally from $29.3k to $42.6k has significantly improved the technicals and especially the momentum for the largest cryptocurrency. Since finding a local top at $42.6k as we reported, the 4-hour and daily conditions for BTC became extremely overbought and overextended, with an increased risk of a near-term correction.
When looking at market structure, it appears BTC has exited Phase C in the Wyckoff Accumulation schematic and is now in the early parts of Phase D.
BTC Reaches Supply Exhaustion
When supply reaches exhaustion, meaning the majority of sellers willing to sell at a certain price range drops significantly, large operators may begin marking up the price as it would require less effort (volume) now that there are fewer sellers remaining. At this stage, large operators have likely completed building big positions after slowly absorbing supply on the market for the past 3 months.
The on-chain metric – all exchange reserves – has significantly fallen in the past 2 weeks, indicating that large amounts of BTC have been flowing out of exchanges, reducing selling pressure.
Signs of Strength
The recent rally to $42.6k can be seen as a sign of strength for BTC, especially after the price rallied above the automatic rally phase at $42.2k in late May, after the initial selling climax. During this rally, BTC’s aggregate trading volume increased – an important confirmation of momentum and activity returning to the market.
BTC Must Hold This Key Zone
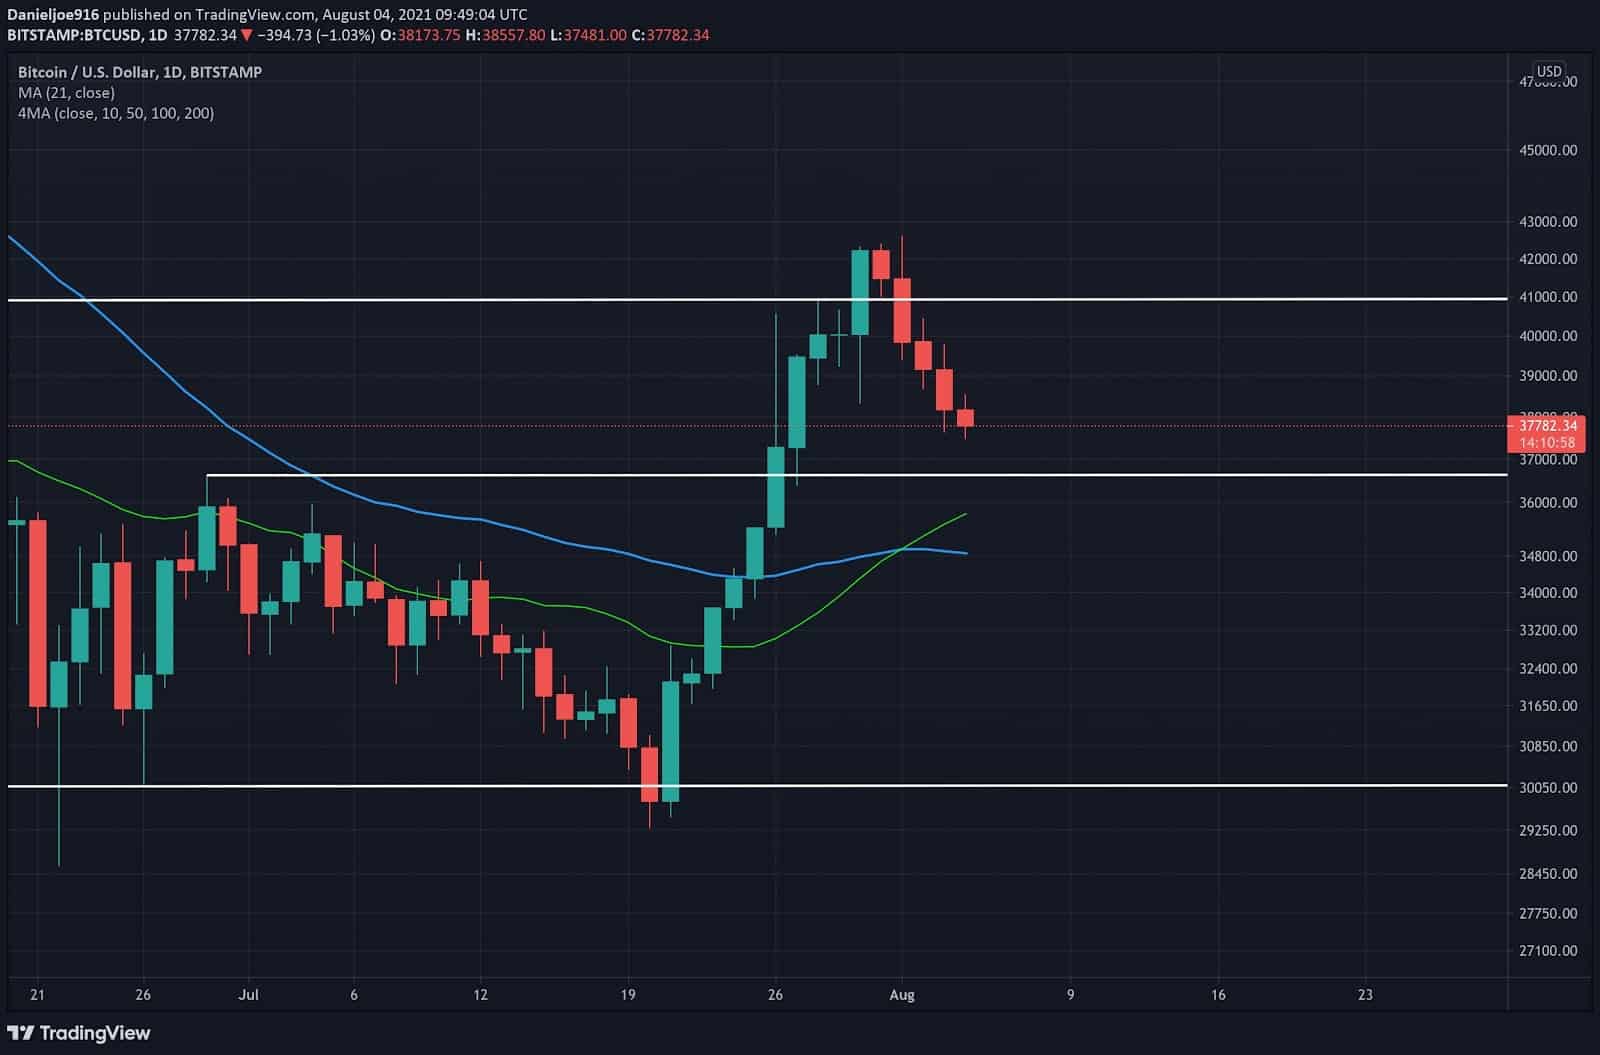
After reaching overbought conditions on the daily chart, BTC has entered a near-term pullback phase, which has been slowly liquidating leveraged longs. Near-term support is currently between $35k and $38.3k, an area confluent with key moving averages, fib retracement, previous resistance flipped as support, and price volume distribution.
This key zone marked in green must hold support to sustain a bullish market structure. A near-term pullback to this green zone, then a technical bounce to retest 40k, is exactly what the bulls need to see.
If BTC struggles to hold support at the 50-day moving average, the risk of retesting the lower part of the trading range at $30k significantly increases, along with a breakout below $30k. If the 50-day moving average is broken, this will also damage the structure and negatively impact Phase D in Wyckoff Accumulation.
Current on-chain analysis shows little signs of large selling pressure. All miner exchange flows have been significantly lower than previous peaks, illiquid supply continues to increase as large entities who rarely sell BTC continues to accumulate, and exchange flows are trending lower. This is supported by the recent BTC price correction with falling volume, indicative of large operators testing the market for any remaining supply before continuing to mark up.
Near-Term Technicals
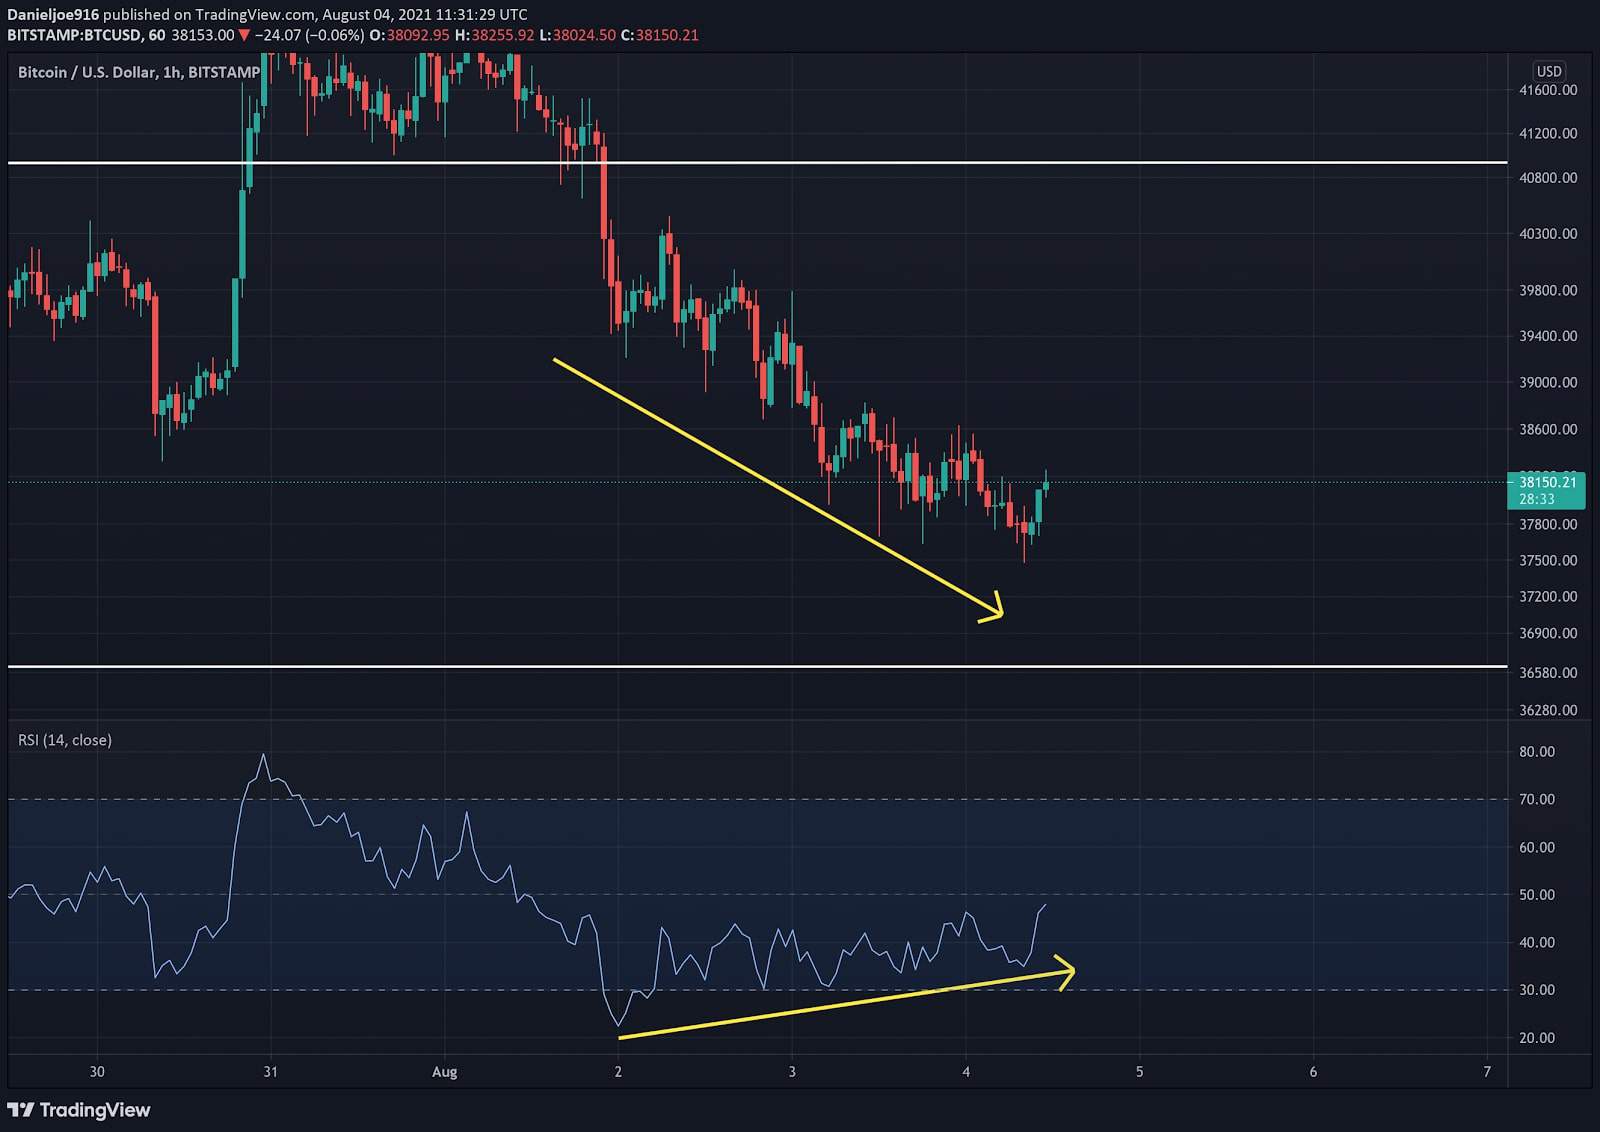
The near term technicals are showing early bullish signals of a potential local bottom. The hourly chart has been showing a bullish divergence as the price has been falling while the relative strength index has been rising. BTC has been building a base of around $37.6k, which is a signal of selling pressure weakening.
The 4-hour chart has been pushed to the extreme with the TD Sequential indicator flashing all five buy signals. This occurs when the price declines for 16 consecutive candles, something very rare to see in BTC price action.
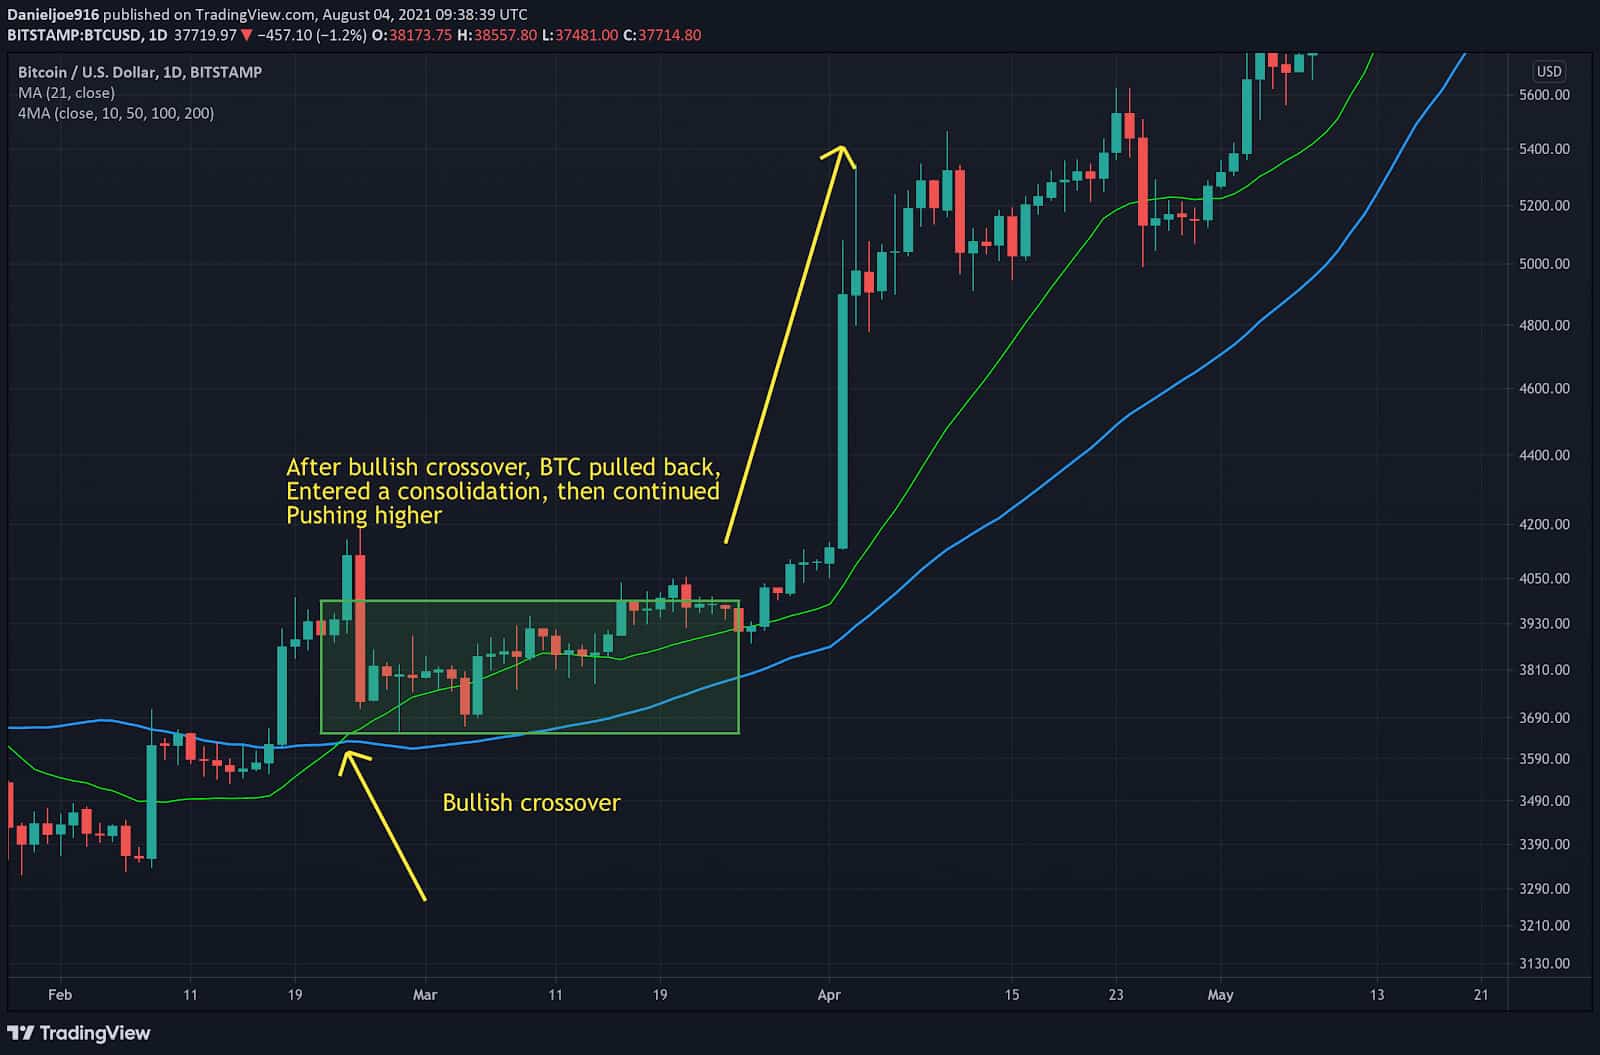
It is also important to keep in mind that the 21-day moving average has sharply crossed above the 50-day moving average, with momentum trending higher on multiple time frames. Similar conditions like this have led to significant rallies during previous bull market cycles. Usually, after the bullish cross of the two moving averages, BTC tends to pull back to near-term support, consolidate, then start the next leg higher.
Additionally, long liquidations on derivative exchanges have been cooling off with no large spikes. This suggests leveraged longs could have been completely liquidated, which further reduces selling pressure.
It remains to be seen if BTC can hold support in the green zone between $35k to $38.3k. With improving technicals on the hourly and 4-hour chart, daily and 3-day charts still showing bullish momentum, and no signs of large selling pressure from on-chain metrics, this suggests BTC should hold near term support, then reverse higher to retest $40k, ideally setting up for a breakout to continue Phase D.