Since the false breakdown below 30k and back up, BTC has shown signs of an early trend reversal. This week’s close (on Sunday – midnight) is definitely a one to watch closely, as it will likely determine the next major direction for BTC. The first bullish signal was the low volume close below k on July 20th. On-chain data strongly suggested that short-term holders, retailers, and small miners were selling, while larger entities continued to accumulate and hold. Bullish Momentum Continues Post B-Word Event Following the B-Word event where prominent figures like Elon Musk spoke, BTC consolidated and successfully retested a near-term downtrend line at .7k. Afterward, the primary cryptocurrency started its next push higher. 7-Month Downtrend Finally Broken The most
Topics:
Daniel Joe considers the following as important: Bitcoin (BTC) Price, BTC Analysis, BTCEUR, BTCGBP, btcusd, btcusdt
This could be interesting, too:
Chayanika Deka writes XRP, SOL, and ADA Inclusion in US Crypto Reserve Pushes Traders on Edge
Chayanika Deka writes Why Arthur Hayes Is Bullish on Bitcoin Under Trump’s Economic Strategy
Mandy Williams writes Why the Bitcoin Market Is Stuck—and the Key Metric That Could Change It: CryptoQuant CEO
Wayne Jones writes Metaplanet Acquires 156 BTC, Bringing Total Holdings to 2,391
Since the false breakdown below 30k and back up, BTC has shown signs of an early trend reversal. This week’s close (on Sunday – midnight) is definitely a one to watch closely, as it will likely determine the next major direction for BTC.
The first bullish signal was the low volume close below $30k on July 20th. On-chain data strongly suggested that short-term holders, retailers, and small miners were selling, while larger entities continued to accumulate and hold.
Bullish Momentum Continues Post B-Word Event
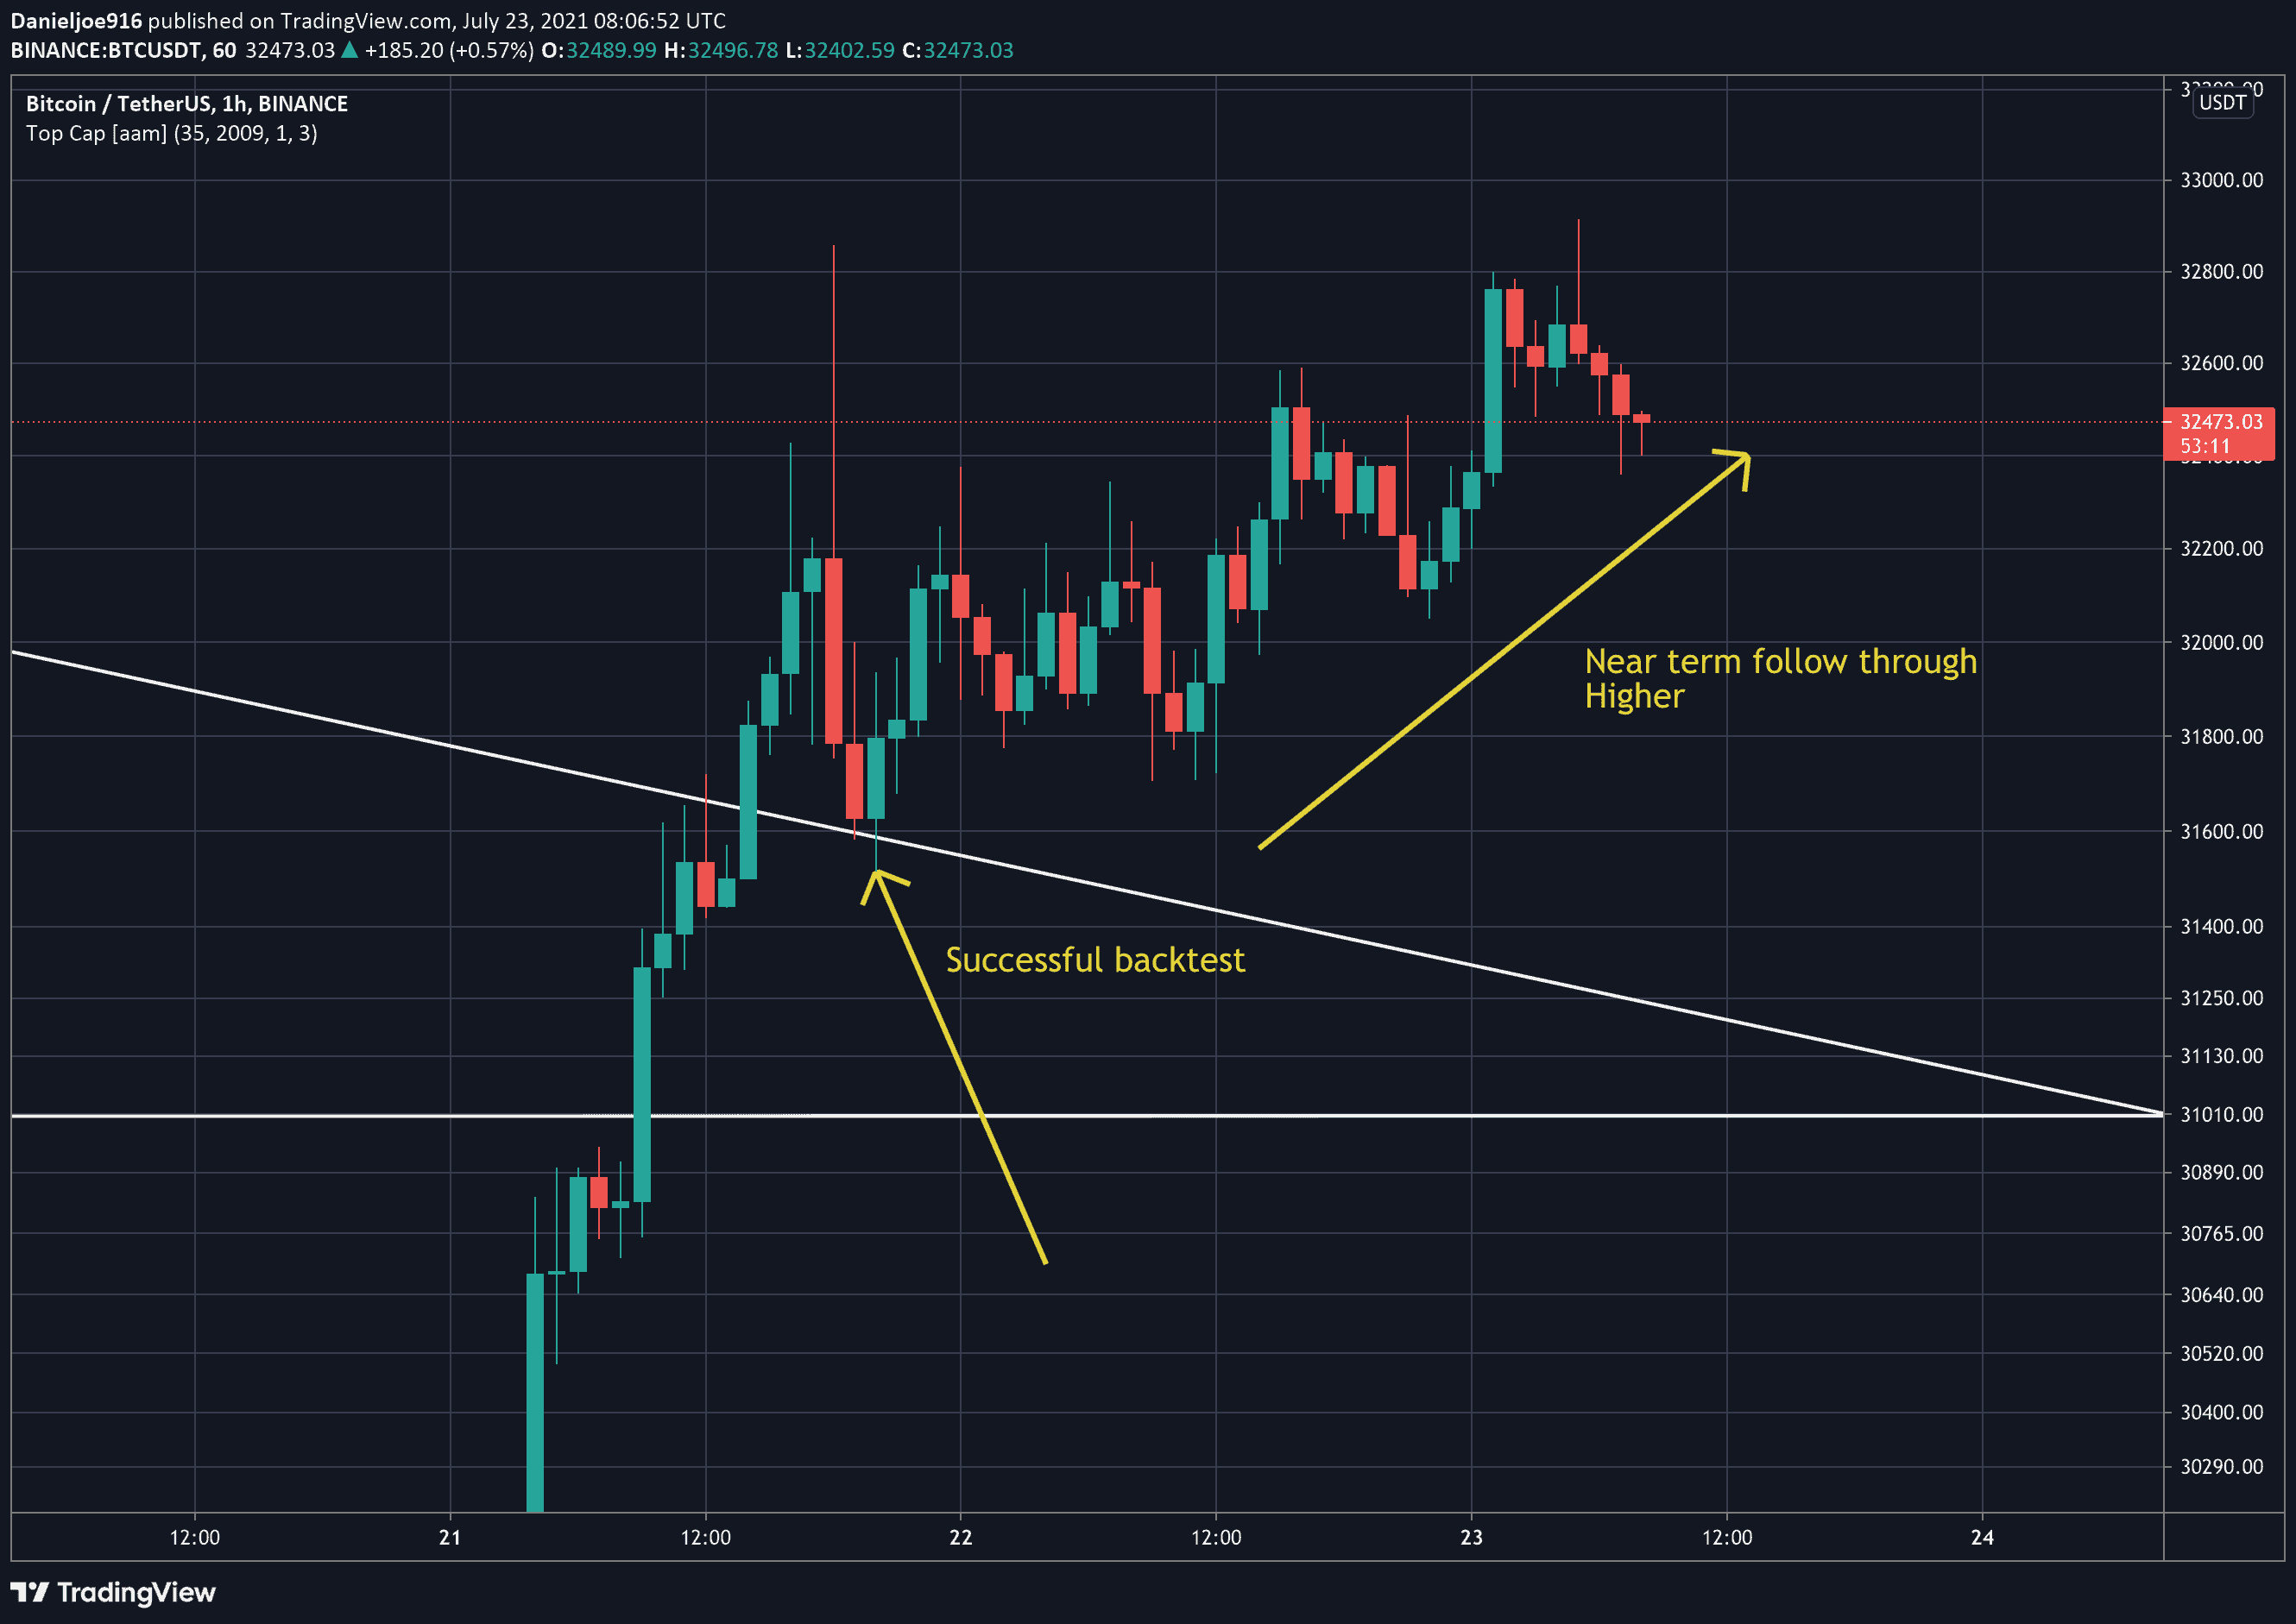
Following the B-Word event where prominent figures like Elon Musk spoke, BTC consolidated and successfully retested a near-term downtrend line at $31.7k. Afterward, the primary cryptocurrency started its next push higher.
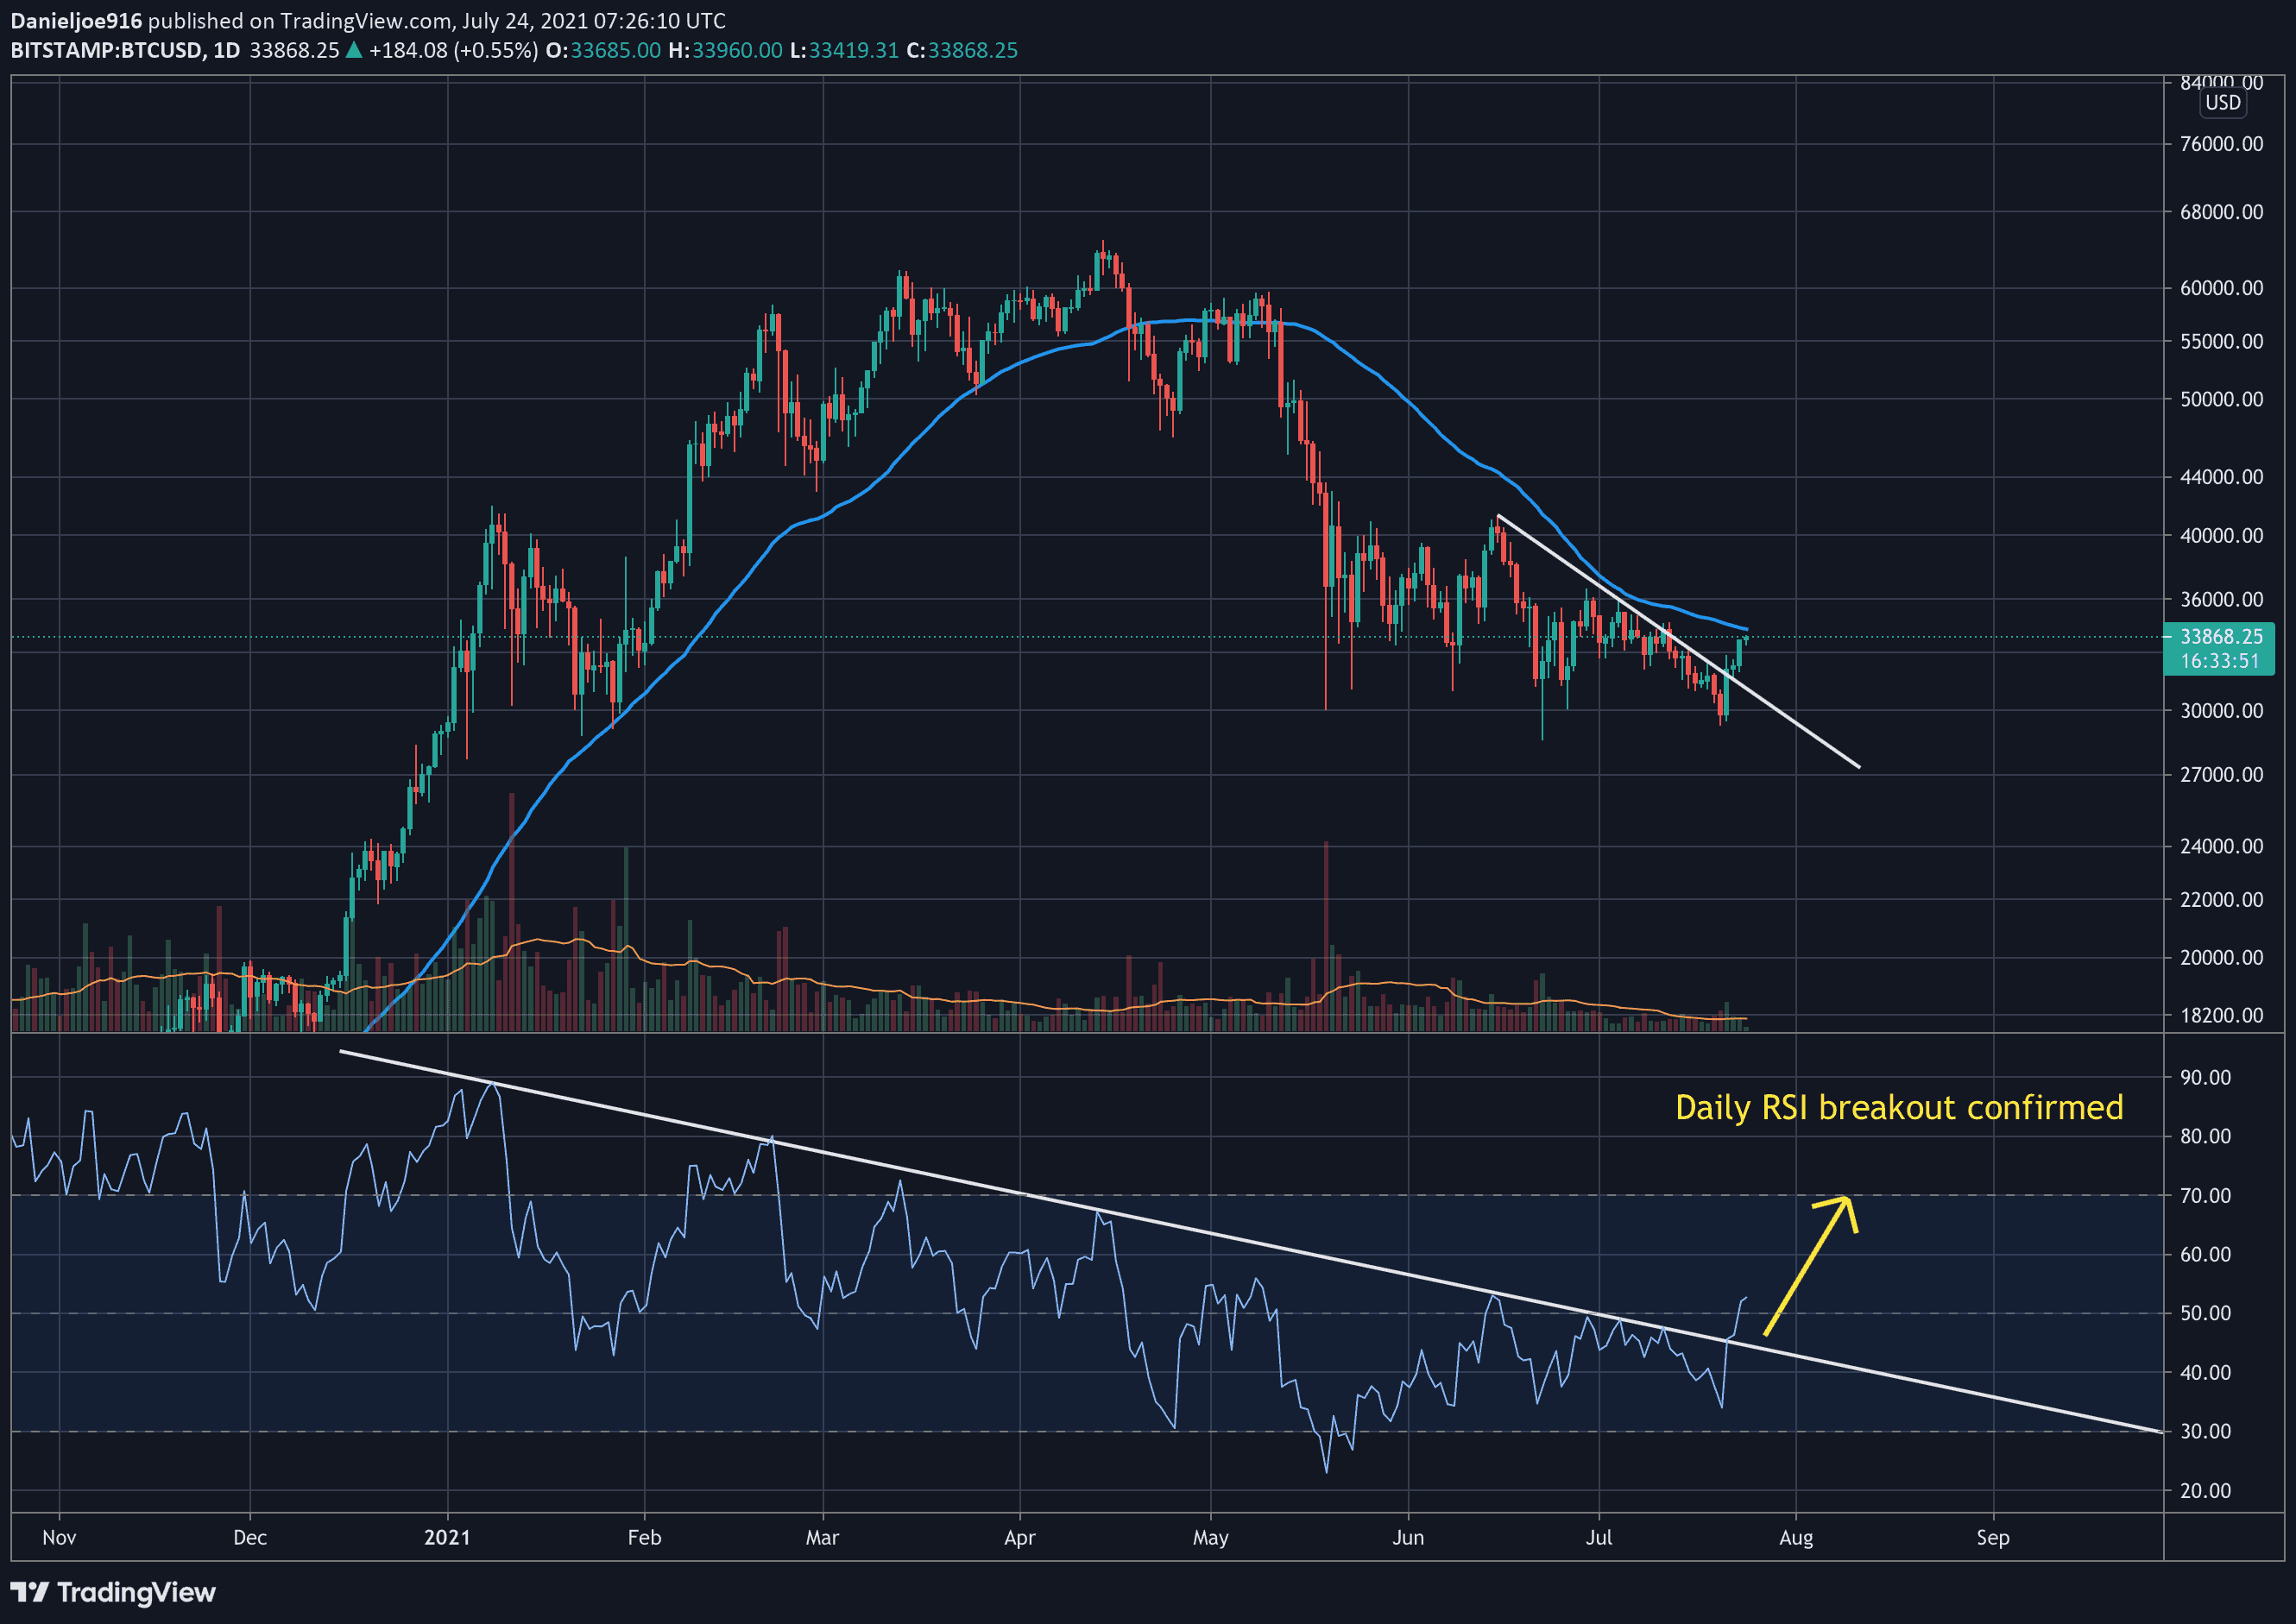
7-Month Downtrend Finally Broken
The most recent price increase managed to finally push the daily RSI above the 7-month descending trend-line, which started forming in January 2021, confirming a breakout in the Relative Strength Index. This is a very bullish signal in momentum, judging by past performance.
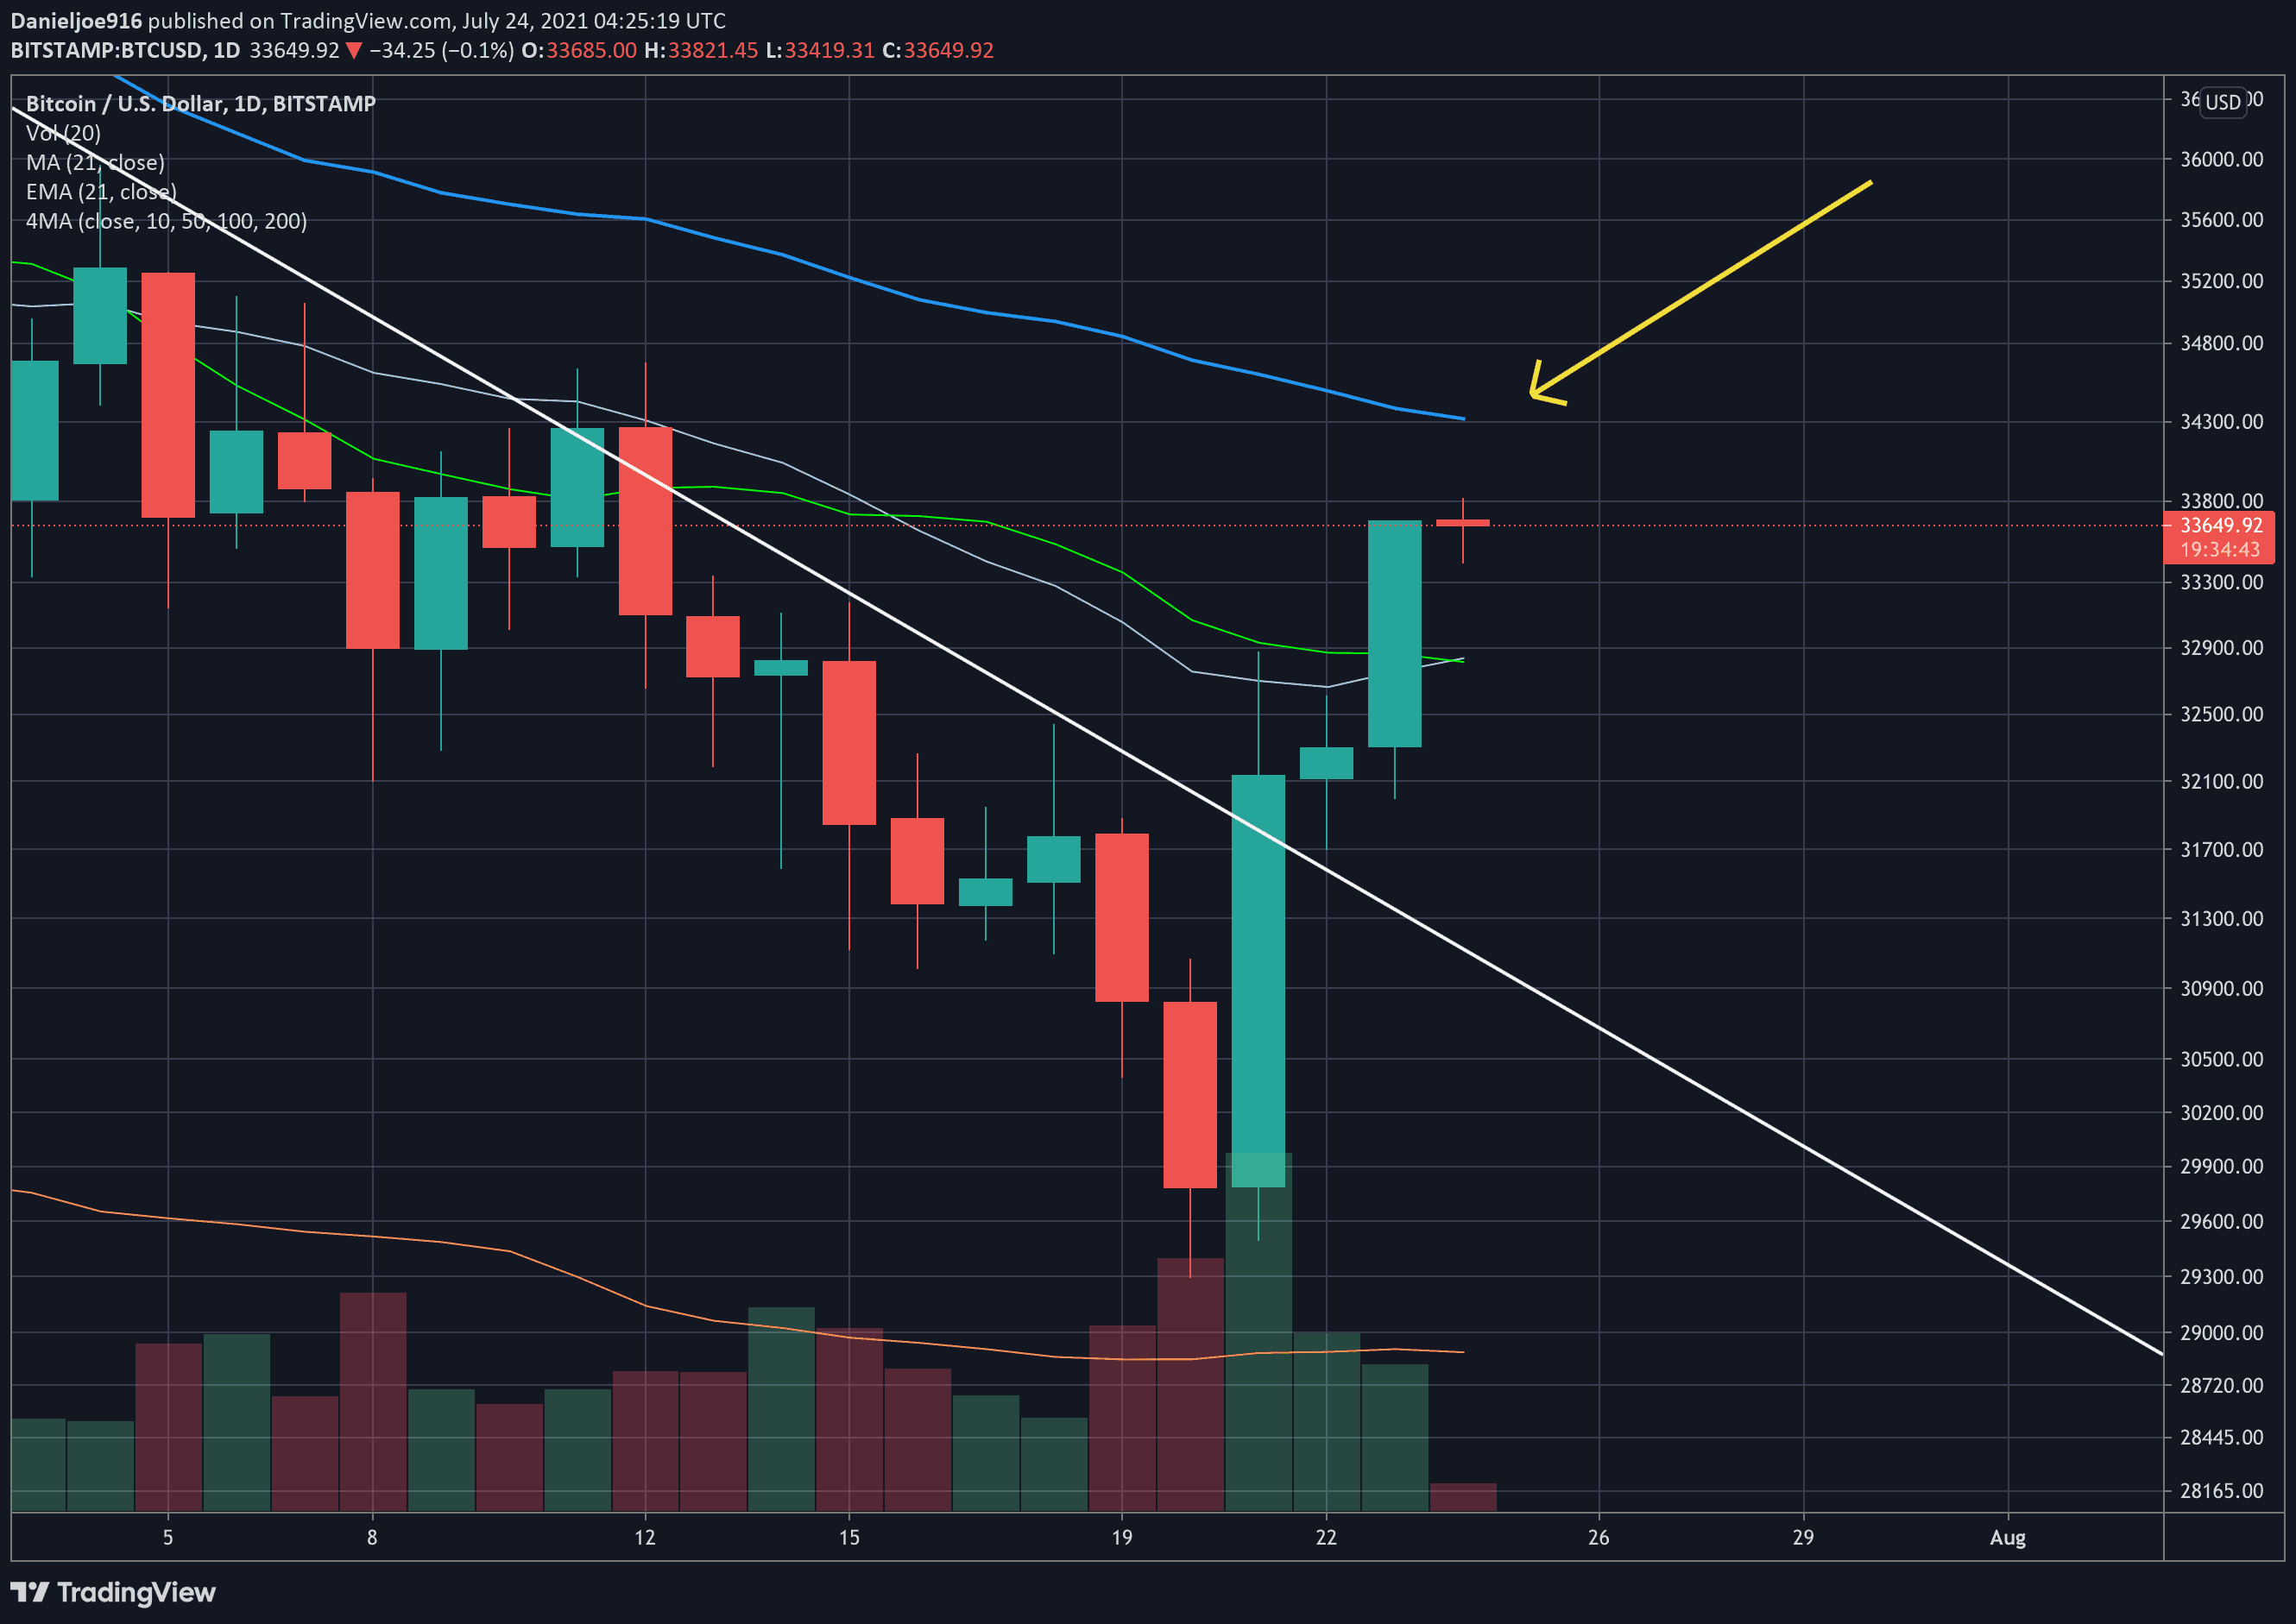
Additionally, BTC made a strong daily close above the 21-day MA, 100-MA, and 200-MA on the short-time frame’s 4-hour chart.
This is a near-term bullish signal that is likely to expand into the mid-term. If bullish momentum continues, the next area of interest is the 50-day MA, which lies around $34.3k.
A strong close, followed by high volume, above the latter, is likely to spark another wave of capital entering the market as we have yet to see higher volume.
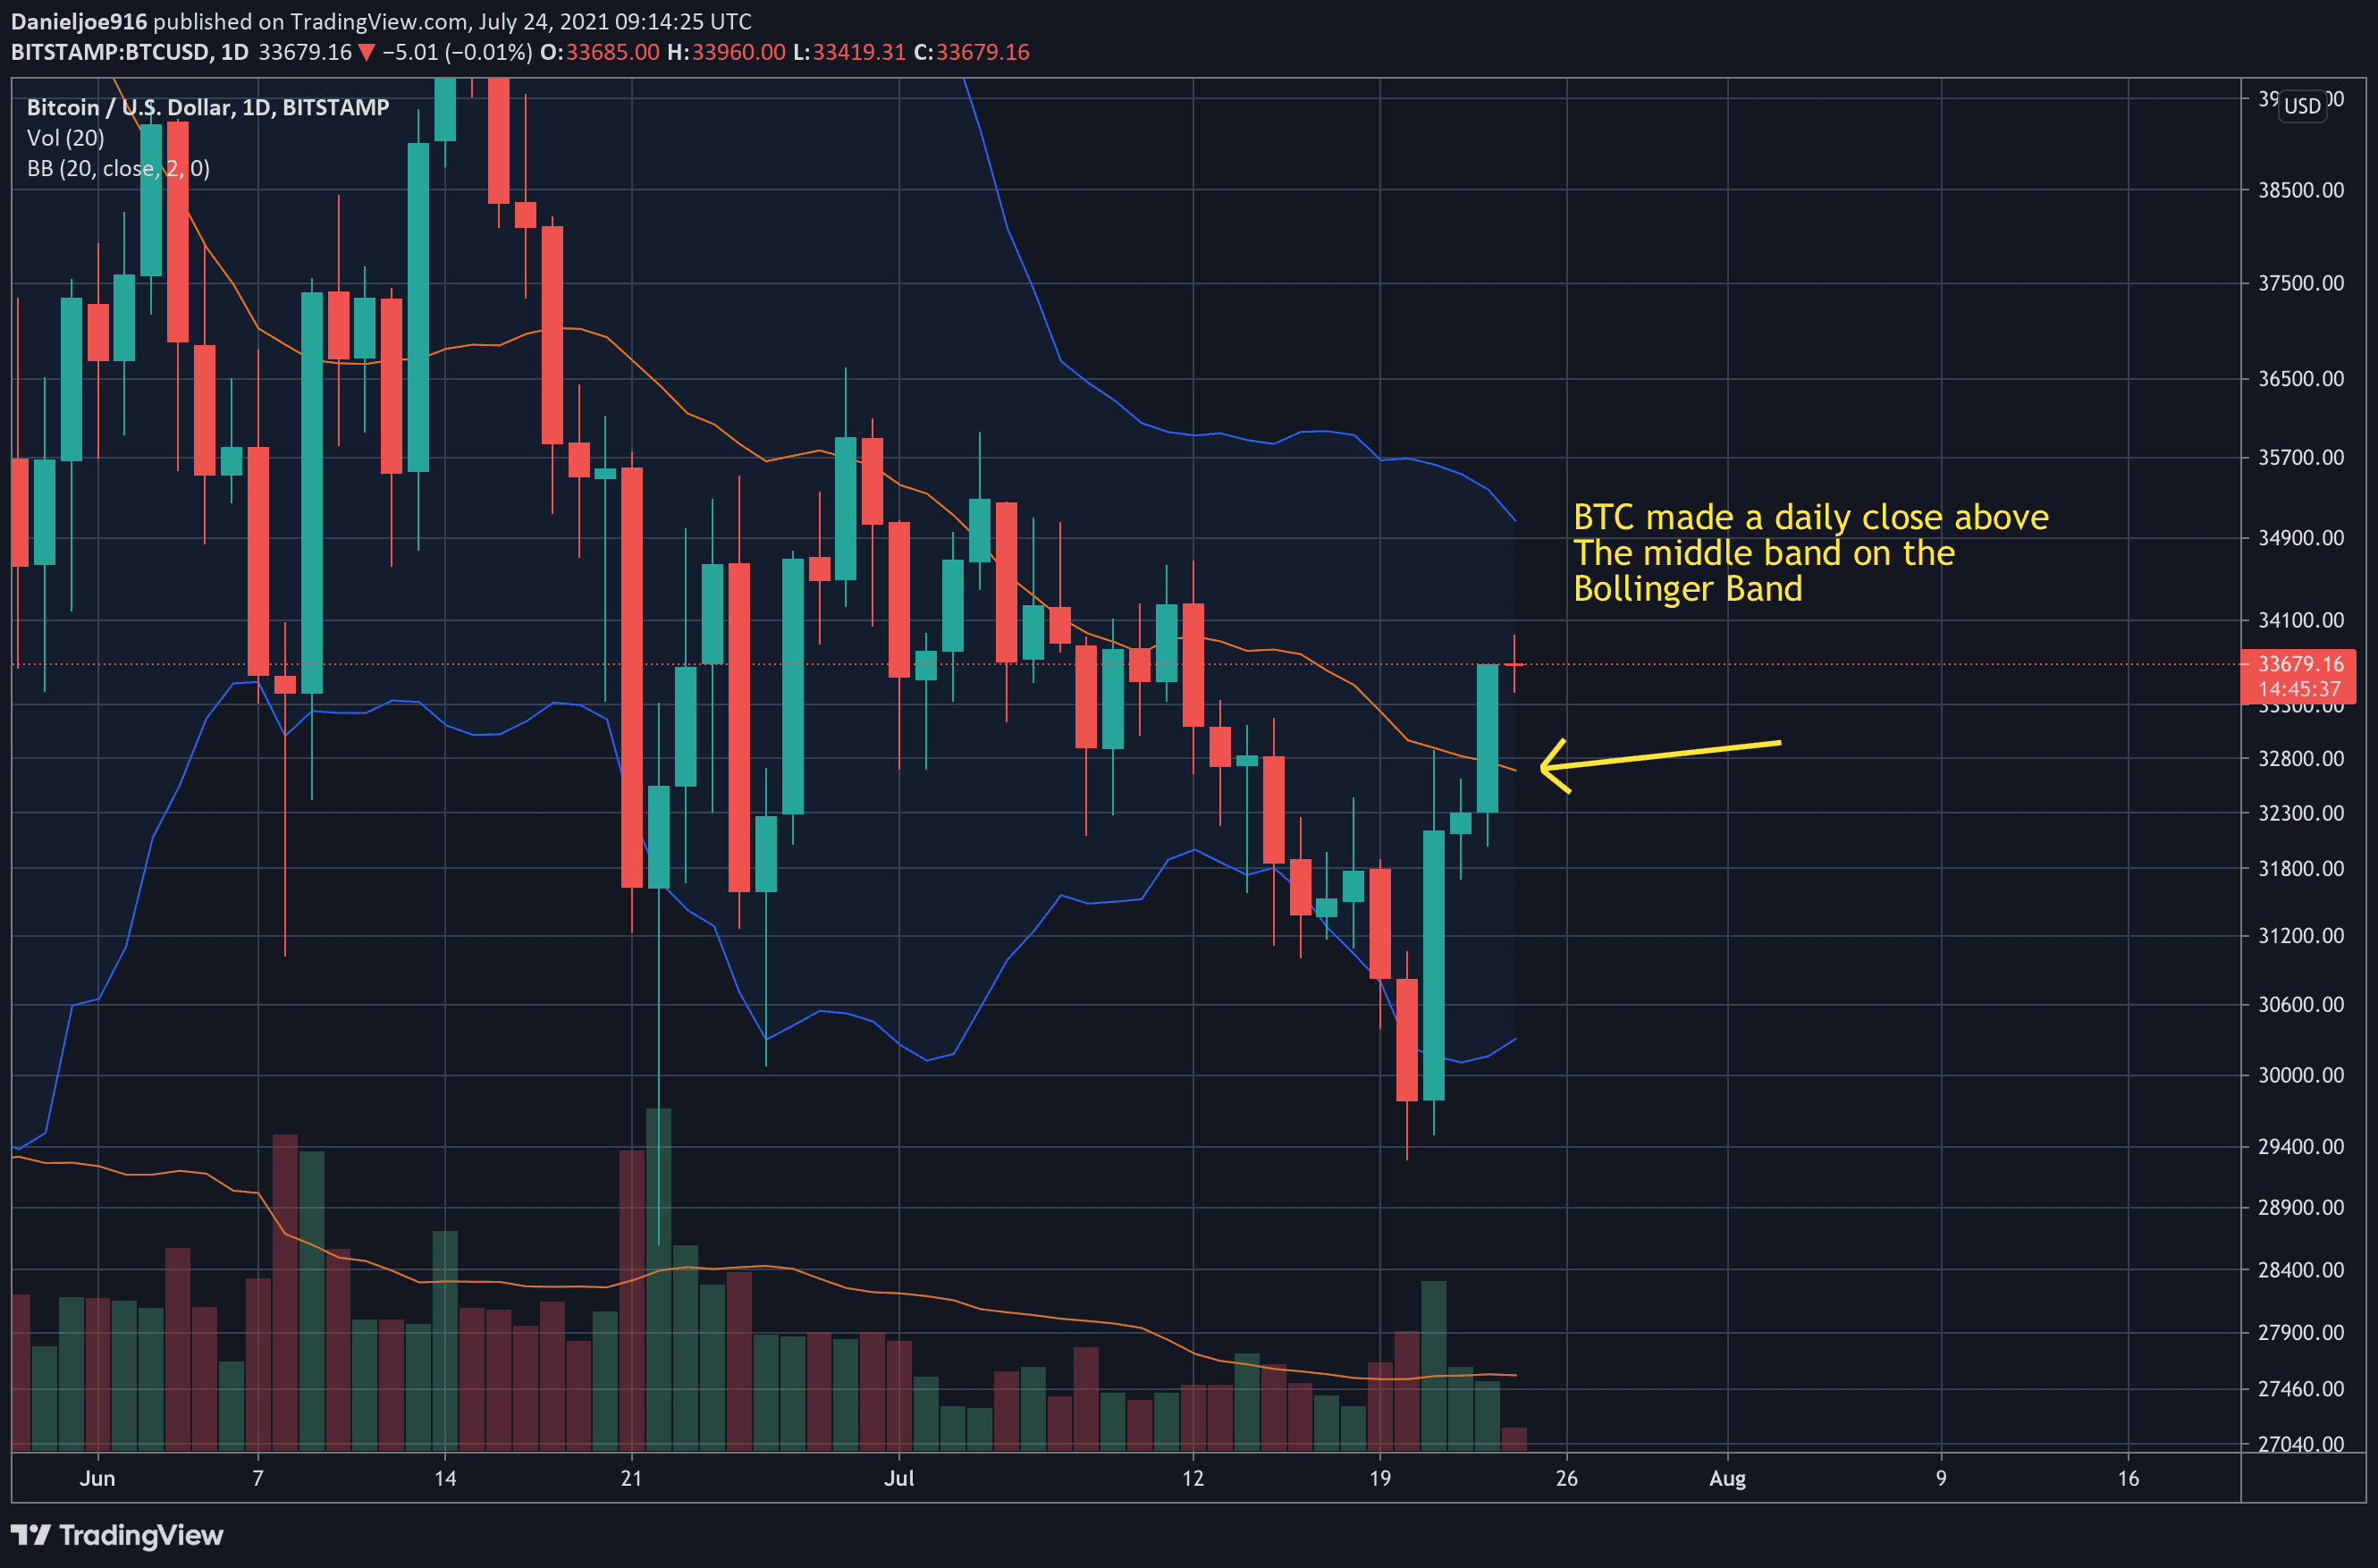
Another notable bullish technical signal is BTC making a daily close above the middle band on the Bollinger Band, as shown below. BTC struggled since mid-June to successfully push above this middle band.
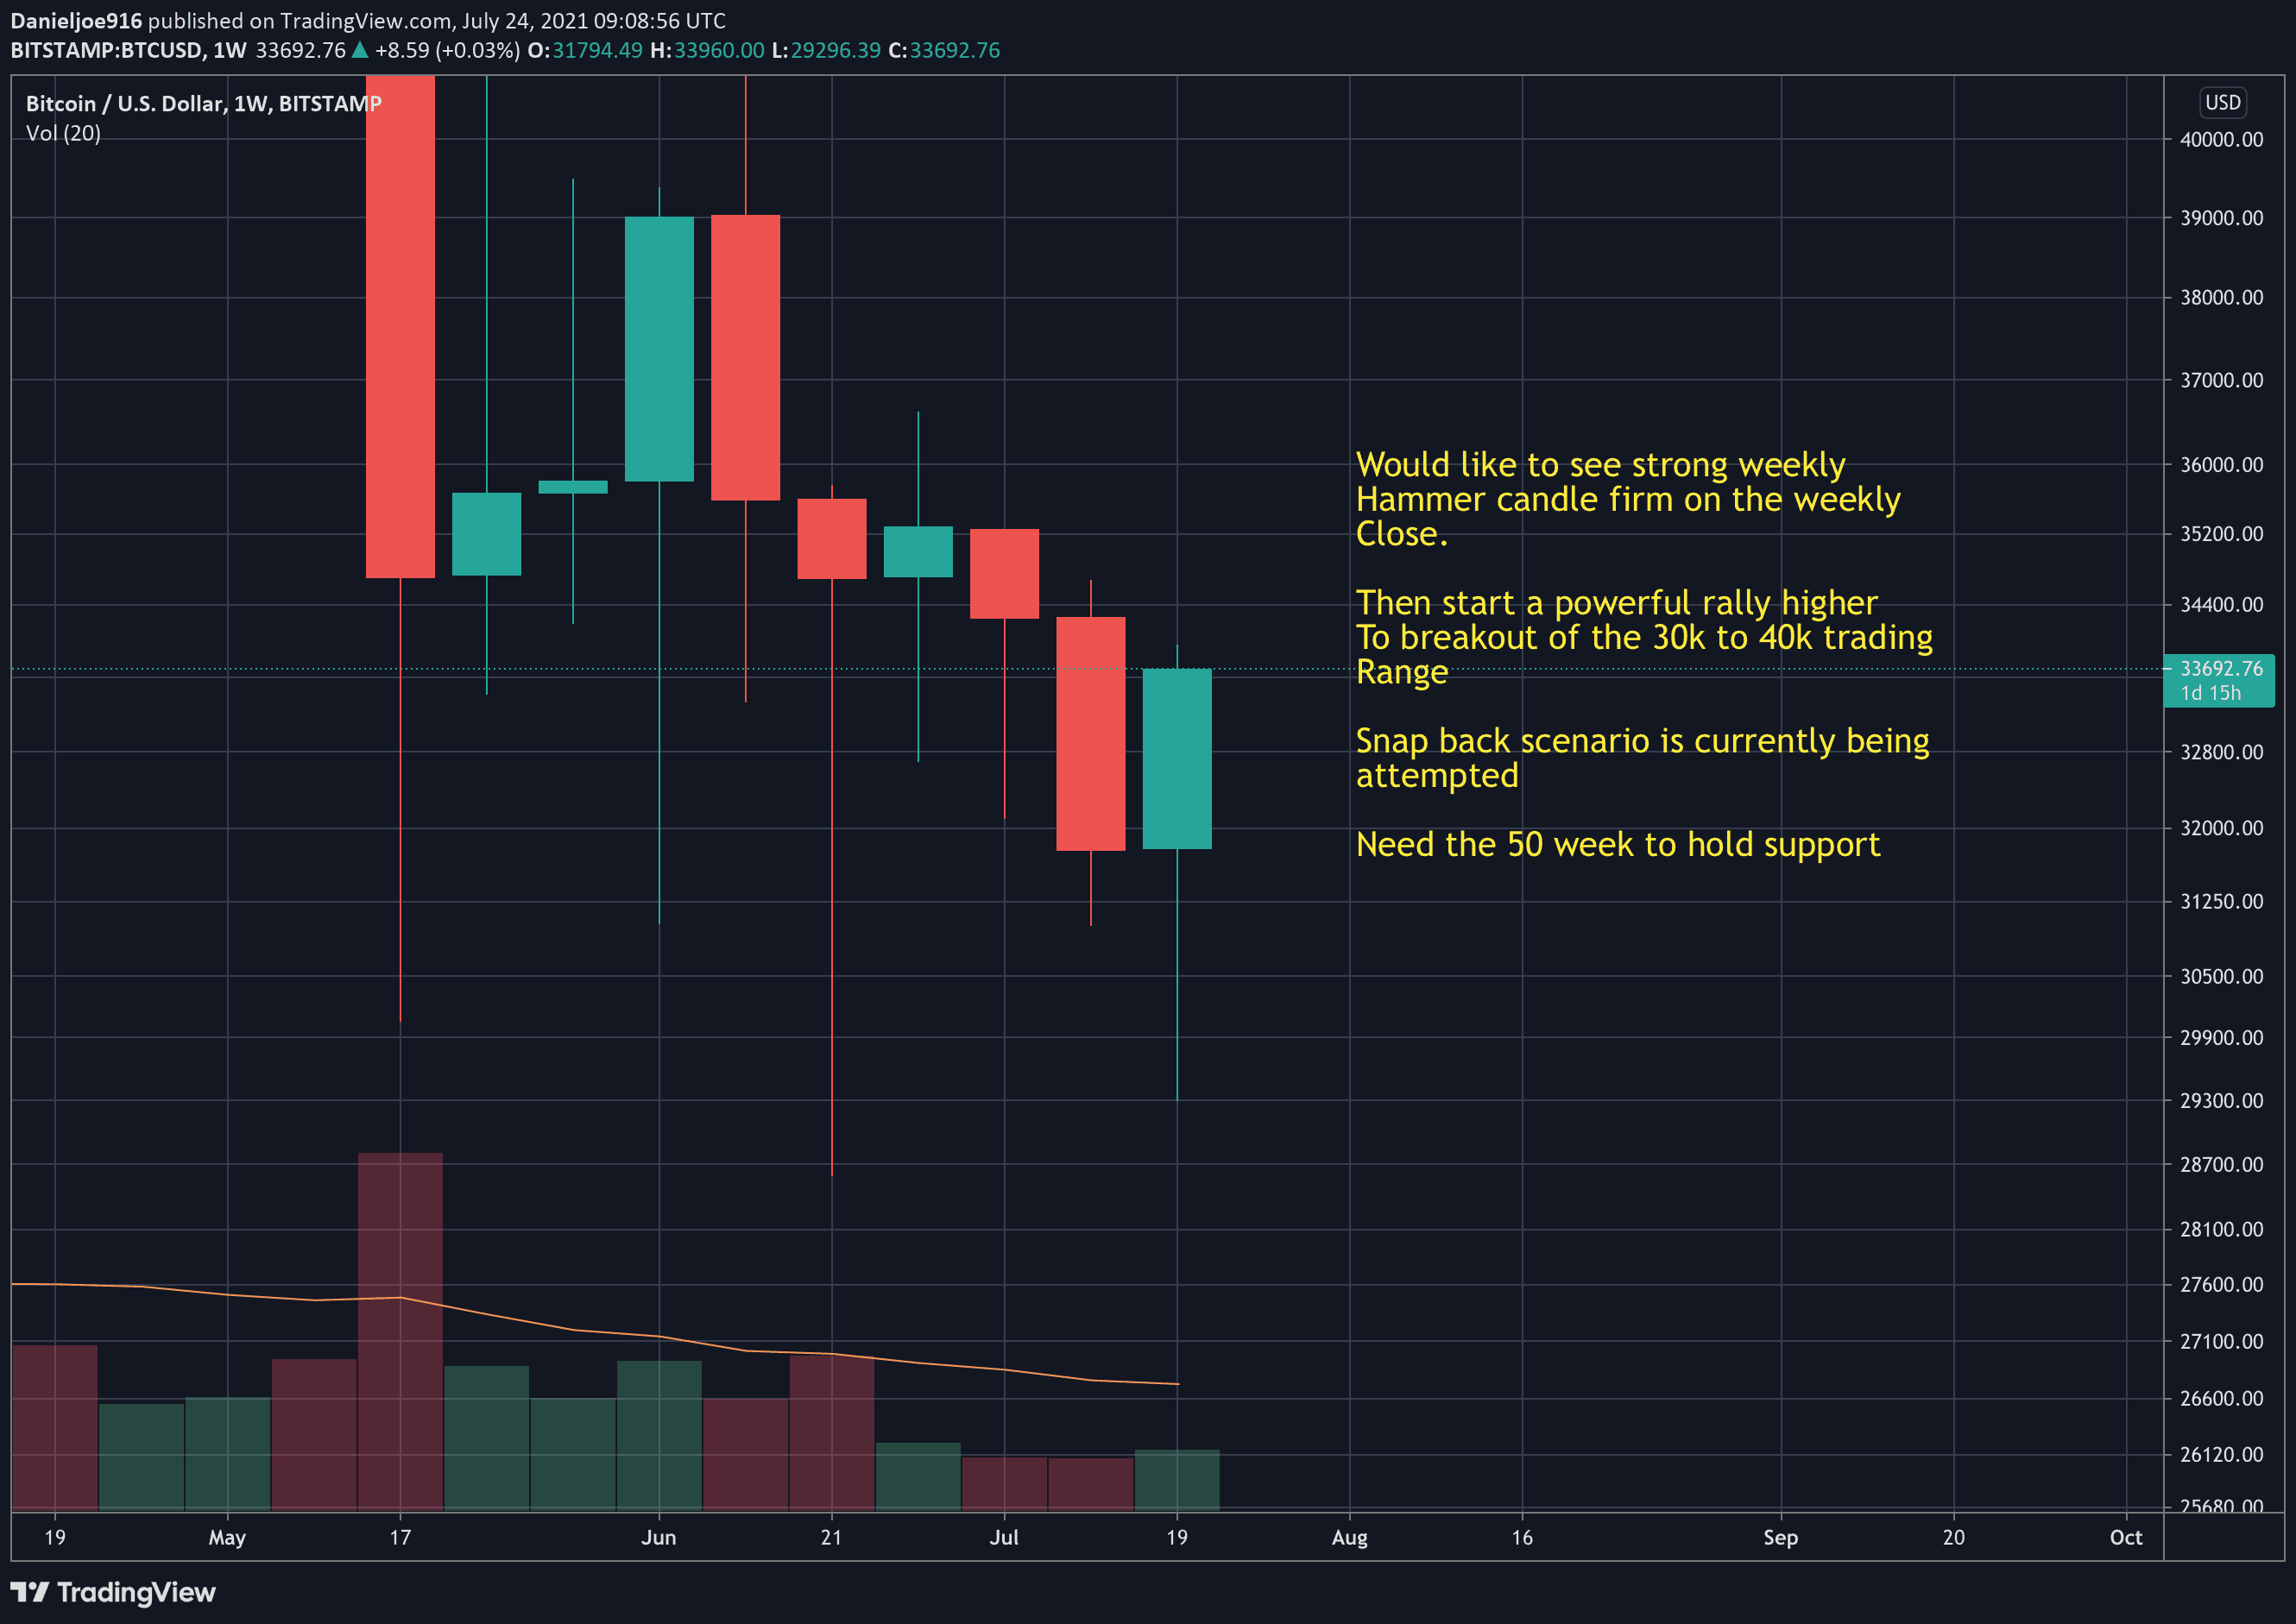
The Weekly Timeframe: Hammer Candle Is Forming
The weekly chart also shows strength as BTC is currently forming a large Hammer candle, a signal technical analysts identify with potential bottoms and trend reversals. It is crucial for BTC to make a weekly close at the highs, print a hammer candle, which is textbook bullish, and then follow through to the upside the next weekly candle. Pushing higher next week will help validate the weekly hammer.
For many weeks, on-chain data showed strong bullish signals of accumulation even while BTC struggled to push higher, retesting the lows of the trading range amid $30K.
This week’s price action and improving technicals can be interpreted as a gradual validation of the bullish on-chain data.
At this stage, the mentioned above early bullish signals need further validation, such as successful retest of the near-term support, increasing volume during rallies, and on-chain data continuing to show strength in market participants and the Bitcoin network.
Overall, the bulls should be glad to see this week’s price action, but there’s still a long way to go, particularly breaking out of the trading range and reclaiming the upper area of the 2-month trading range at $40k – $43k.