Key Support levels: ,000 | 0.070 BTC Key Resistance levels: ,350, 68 (ATH) | 0.080 BTC ETH’s price is currently consolidating between the support at ,000 and the resistance at ,350. However, on the Bitcoin pair, ETH looks much more interesting as it has just hit a 2-month high (0.076 BTC) and appears ready to break above a key resistance spanning all the way back to 2018. If ETH can do this successfully, it may outperform Bitcoin in the near future. Chart by TradingViewTechnical Indicators Trading Volume: Volume remained steady in the past few days with a good influx of buyers around support. However, the resistance level continues to stop bulls from advancing forward. RSI: The RSI on the daily and the 4-hour timeframe is making higher lows. This is a bullish
Topics:
Duo Nine considers the following as important: ETH Analysis, ETHBTC, Ethereum (ETH) Price, ethusd
This could be interesting, too:
Mandy Williams writes Ethereum Derivatives Metrics Signal Modest Downside Tail Risk Ahead: Nansen
Jordan Lyanchev writes Weekly Bitcoin, Ethereum ETF Recap: Light at the End of the Tunnel for BTC
CryptoVizArt writes Will Weak Momentum Drive ETH to .5K? (Ethereum Price Analysis)
Jordan Lyanchev writes Bybit Hack Fallout: Arthur Hayes, Samson Mow Push for Ethereum Rollback
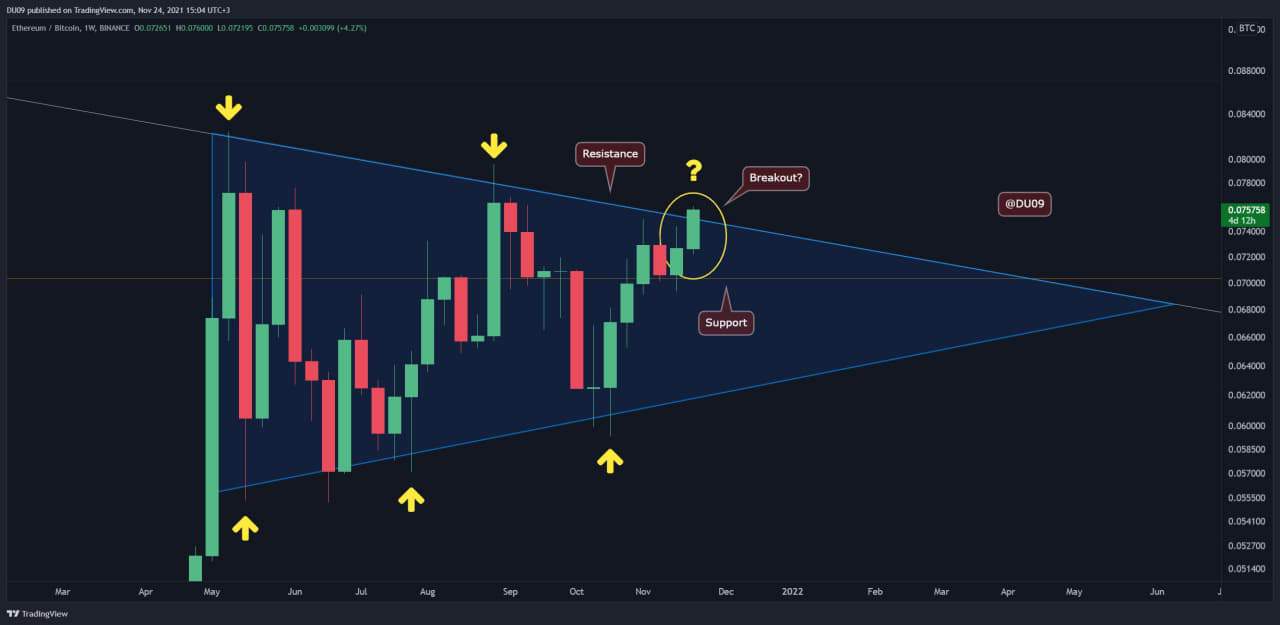
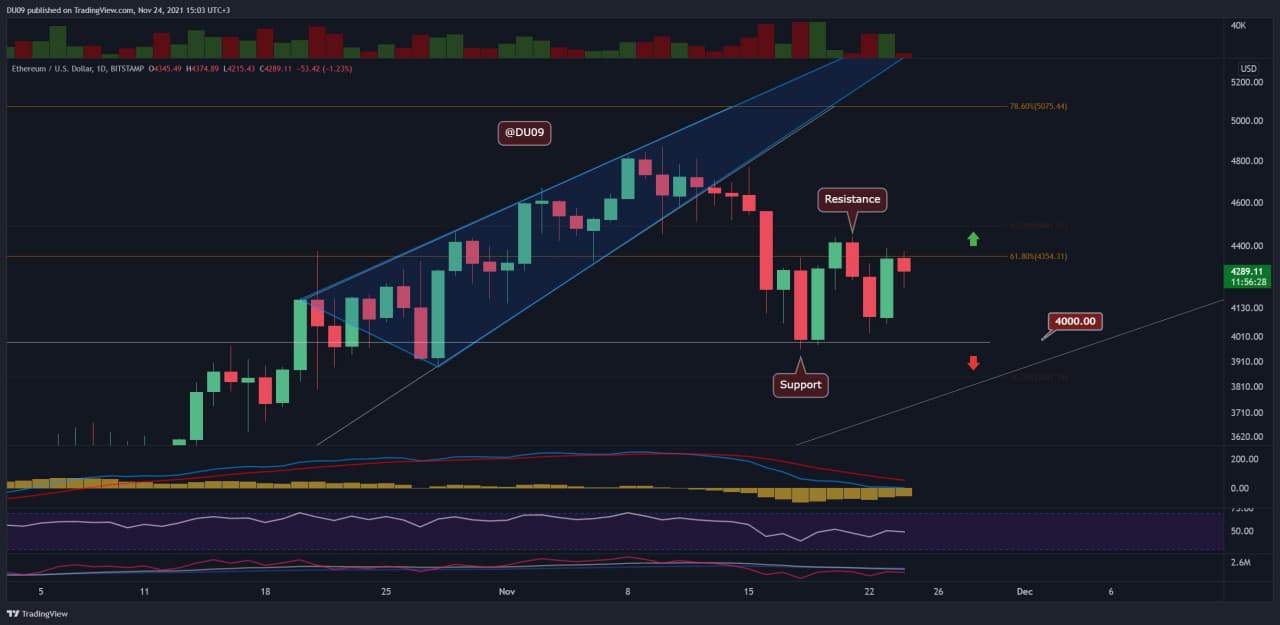
Key Support levels: $4,000 | 0.070 BTC
Key Resistance levels: $4,350, $4868 (ATH) | 0.080 BTC
ETH’s price is currently consolidating between the support at $4,000 and the resistance at $4,350. However, on the Bitcoin pair, ETH looks much more interesting as it has just hit a 2-month high (0.076 BTC) and appears ready to break above a key resistance spanning all the way back to 2018. If ETH can do this successfully, it may outperform Bitcoin in the near future.
Technical Indicators
Trading Volume: Volume remained steady in the past few days with a good influx of buyers around support. However, the resistance level continues to stop bulls from advancing forward.
RSI: The RSI on the daily and the 4-hour timeframe is making higher lows. This is a bullish signal. If the momentum can be maintained and bulls break the current resistance levels, then a new rally can start.
MACD: The MACD is still bearish on the daily timeframe. However, on lower timeframes like 4-hours, the MACD has turned bullish at the time of this post. The longer price sits above $4,000, the more chances ETH has to break away from the current range.
Bias
The bias for ETH is neutral in the short term. Price really needs to break away from the $4,350 resistance to turn bullish. On the ETH/BTC pair, ETH looks much more bullish and appears prepared to break away from the current formation in blue.
Short-Term Price Prediction for ETH
Ethereum managed to recover well from the $4,000 support level, and the price has not touched it since November 19th. This shows buyers are eager to purchase ETH before the support level is reached. For this reason, the price has made higher lows and seems likely to remain above $4,000 for the rest of the week.
If the current ETH/BTC chart remains bullish, the cryptocurrency may surprise the market and start a significant rally in the near future, leaving BTC behind in terms of sheer performance.