Bitcoin saw some serious whipsaw-like action today, with the market witnessing its most serious correction in February. At the height of the crash, Bitcoin price plunged by 18%, to as low as ,400 (Bitstamp) before sharply recovering.The cryptocurrency had spiked lower in a wild hourly candle, pushing the market briefly beneath the ascending price channel that it has been trading within throughout February.This comes just a day after it had reached the upper boundary of this price channel yesterday, as BTC managed to poke above the ,000 level and set the current ATH price at ,355.It could not break the channel’s upper boundary, and today’s wild correction saw it heading lower from there: Bitcoin lost a total of K.After reaching an intraday low at ,400, the buyers quickly
Topics:
Yaz Sheikh considers the following as important: Bitcoin (BTC) Price, BTC Analysis, BTCEUR, BTCGBP, btcusd, btcusdt
This could be interesting, too:
Chayanika Deka writes XRP, SOL, and ADA Inclusion in US Crypto Reserve Pushes Traders on Edge
Chayanika Deka writes Why Arthur Hayes Is Bullish on Bitcoin Under Trump’s Economic Strategy
Mandy Williams writes Why the Bitcoin Market Is Stuck—and the Key Metric That Could Change It: CryptoQuant CEO
Wayne Jones writes Metaplanet Acquires 156 BTC, Bringing Total Holdings to 2,391
Bitcoin saw some serious whipsaw-like action today, with the market witnessing its most serious correction in February. At the height of the crash, Bitcoin price plunged by 18%, to as low as $47,400 (Bitstamp) before sharply recovering.
The cryptocurrency had spiked lower in a wild hourly candle, pushing the market briefly beneath the ascending price channel that it has been trading within throughout February.
This comes just a day after it had reached the upper boundary of this price channel yesterday, as BTC managed to poke above the $58,000 level and set the current ATH price at $58,355.
It could not break the channel’s upper boundary, and today’s wild correction saw it heading lower from there: Bitcoin lost a total of $11K.
After reaching an intraday low at $47,400, the buyers quickly pushed the market higher. They managed to reclaim the $50K mark and even continued above to reach over $53K. It is now trading above the 4-hour 50MA level and above the midline of the ascending price channel.
The Main Takeaways from Today’s Price Action
- The market needed a serious correction. The last major decline took place on January 29th. After January 31st, when Bitcoin was trading at $32K, the direction was only up until reaching $58K.
- The bulls take the stairs, the bears ride the elevator: the negative corrections are usually unexpected and violent. However, in a bull market, like the one we are having, those drops provide great opportunities to join in.
- When violent moves occur to one side, we can expect violence to the other side as well. This can explain the massive bullish reaction after touching $47K.
- As of now, Bitcoin is trading around $53K, the spot where it traded just 3 days ago. So we can actually say that Bitcoin “crashed” to where it was trading just three days ago.
BTC Price Support and Resistance Levels to Watch
Key Support Levels: $52,365, $51,490, $50,000, $48,000, $47,200.
Key Resistance Levels: $55K, $56,112, $57,686, $60,000, $62,170, $64,000.
Moving forward, keep in mind that we can expect huge volatility in the coming hours.
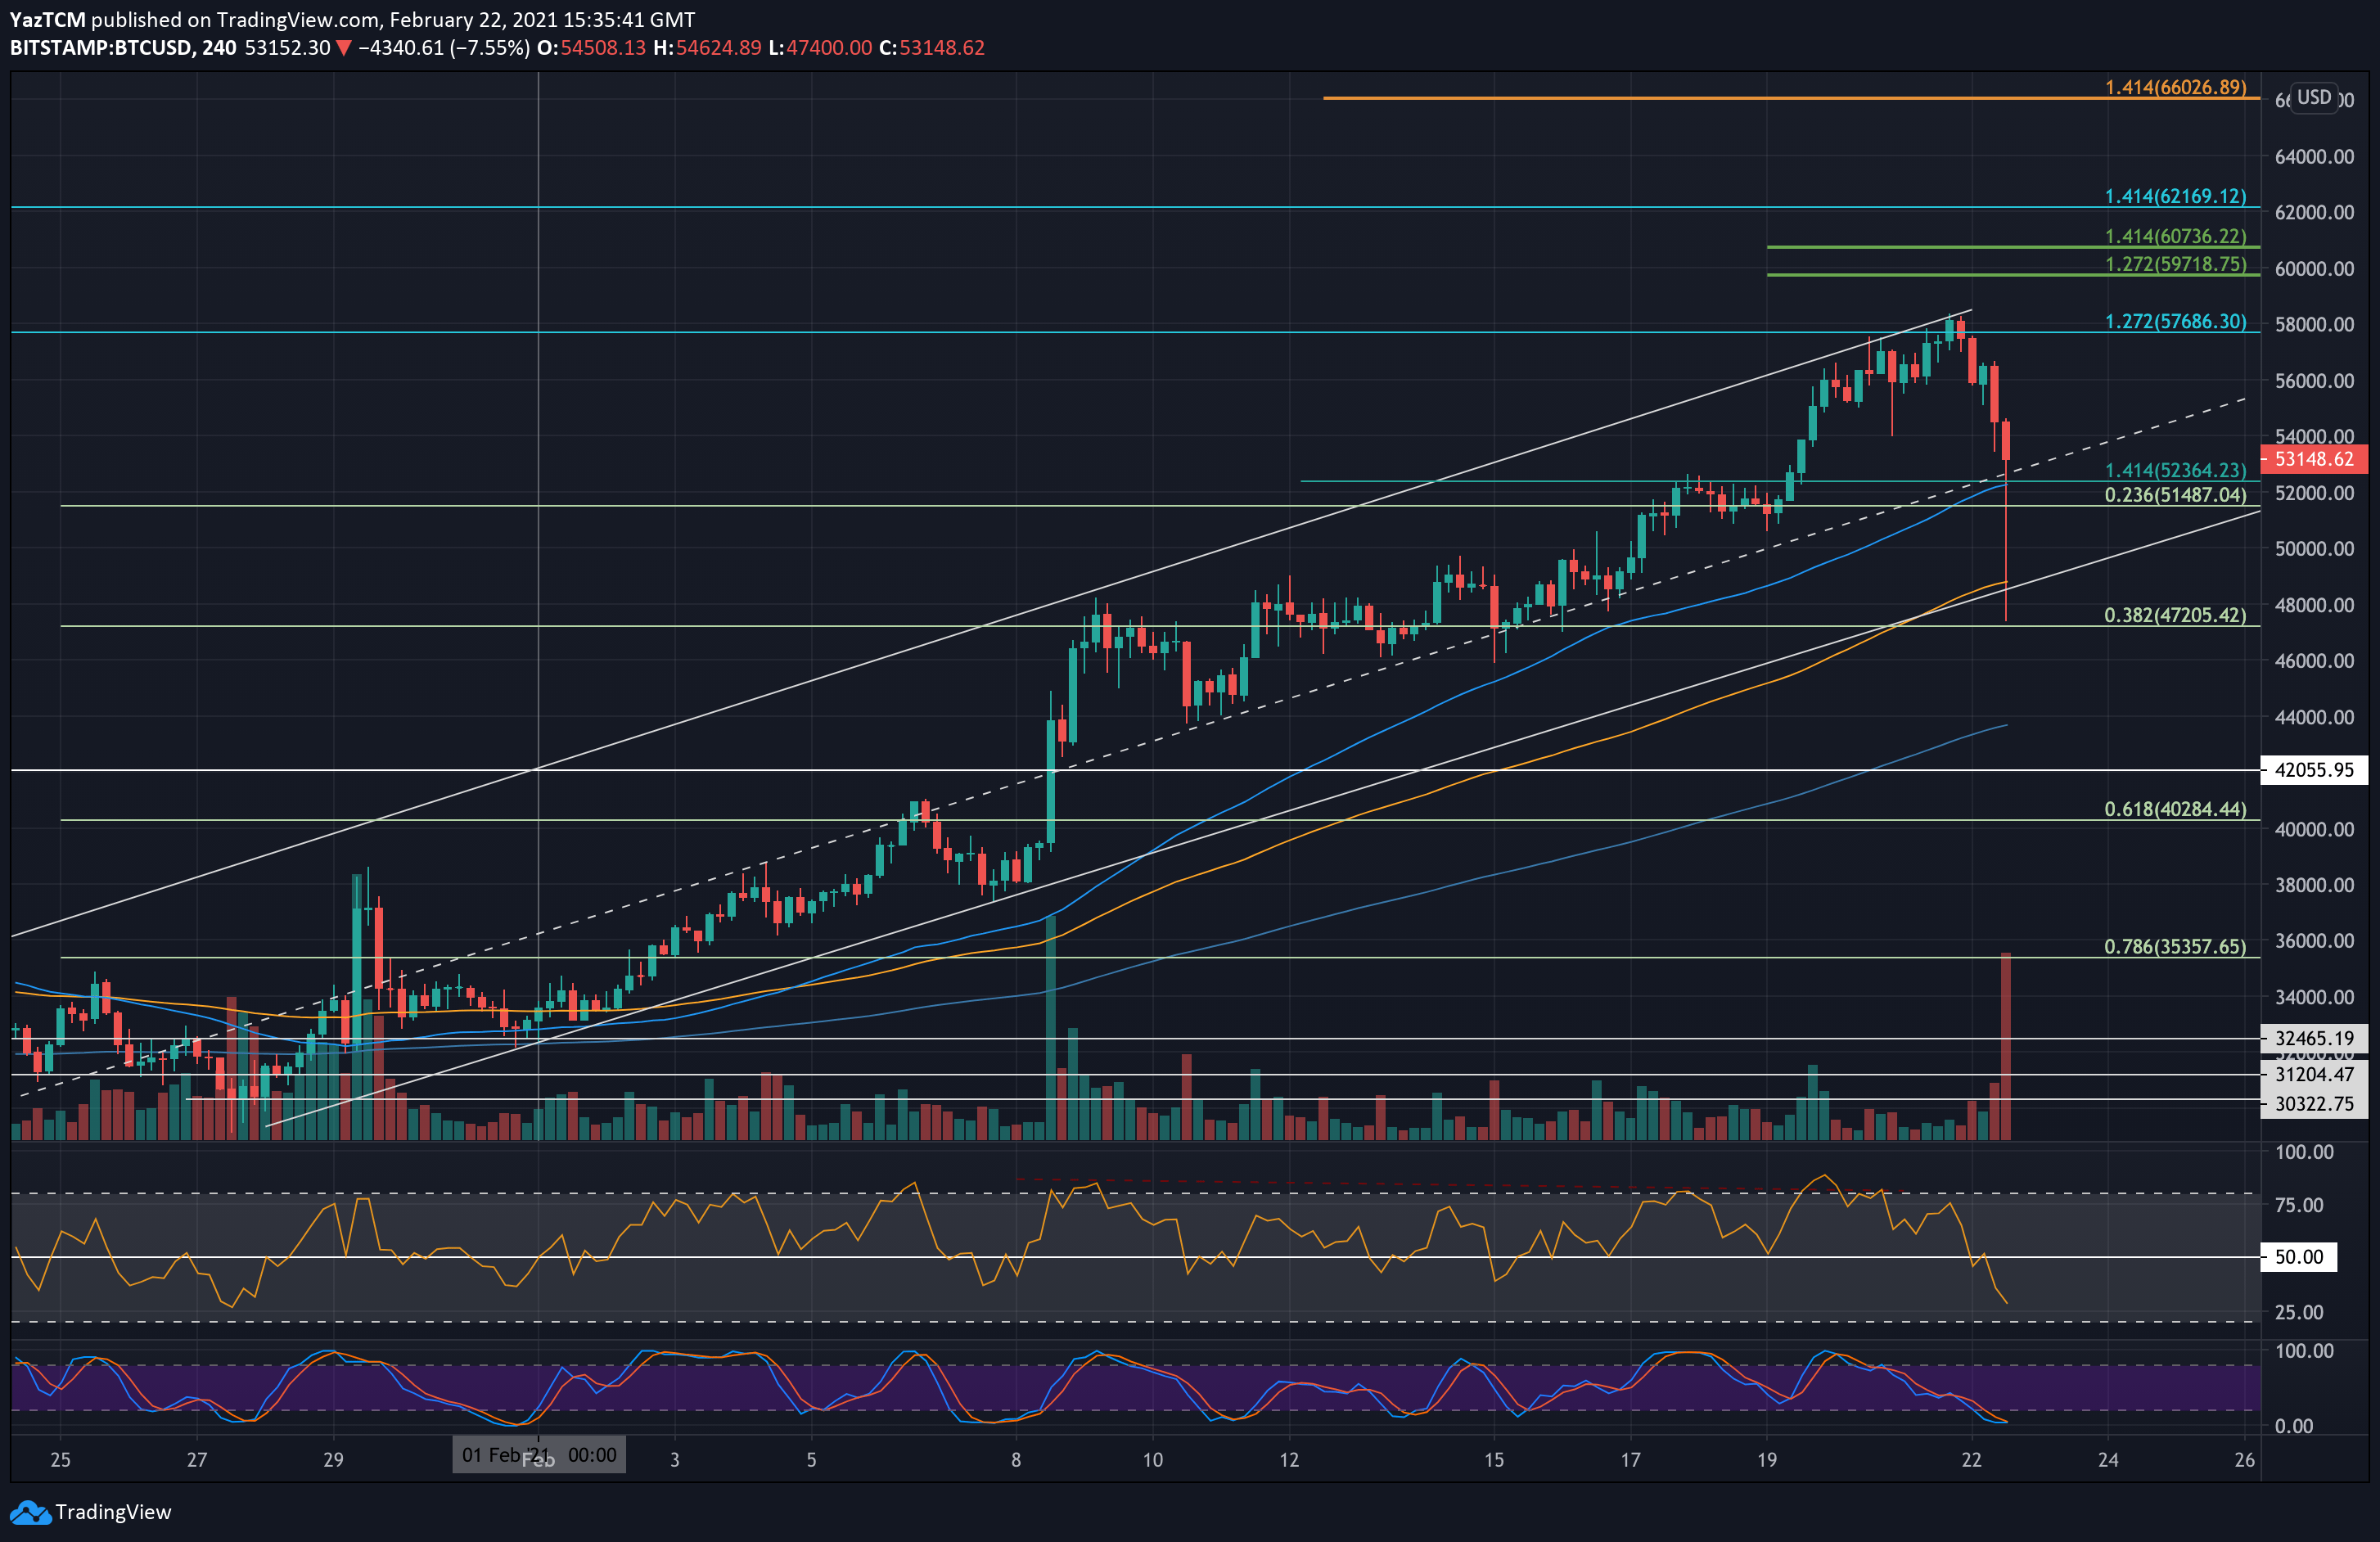
From below, the first level of support now lies at the midline of the marked ascending price channel and the 4-hour 50-MA level (around $52,365). This is closely followed by support at $51,490 (.236 Fib), $50,000, and $48,000 (lower boundary of the price channel).
Additional support is found at $47,200 (.382 Fib, and today’s low) and $45,000.
From the bullish side, the first levels of resistance lie at $55K (4-hour’s 20-EMA), and $56,112 (1.414 Fib Extension – purple). This is followed by $57,686 (1.272 Fib Extension – blue), $60,000, and $62,170 (1.414 Fib Extension – blue). Added resistance lies at $64,000 and $66,000 (1.414 Fib Extension – orange).
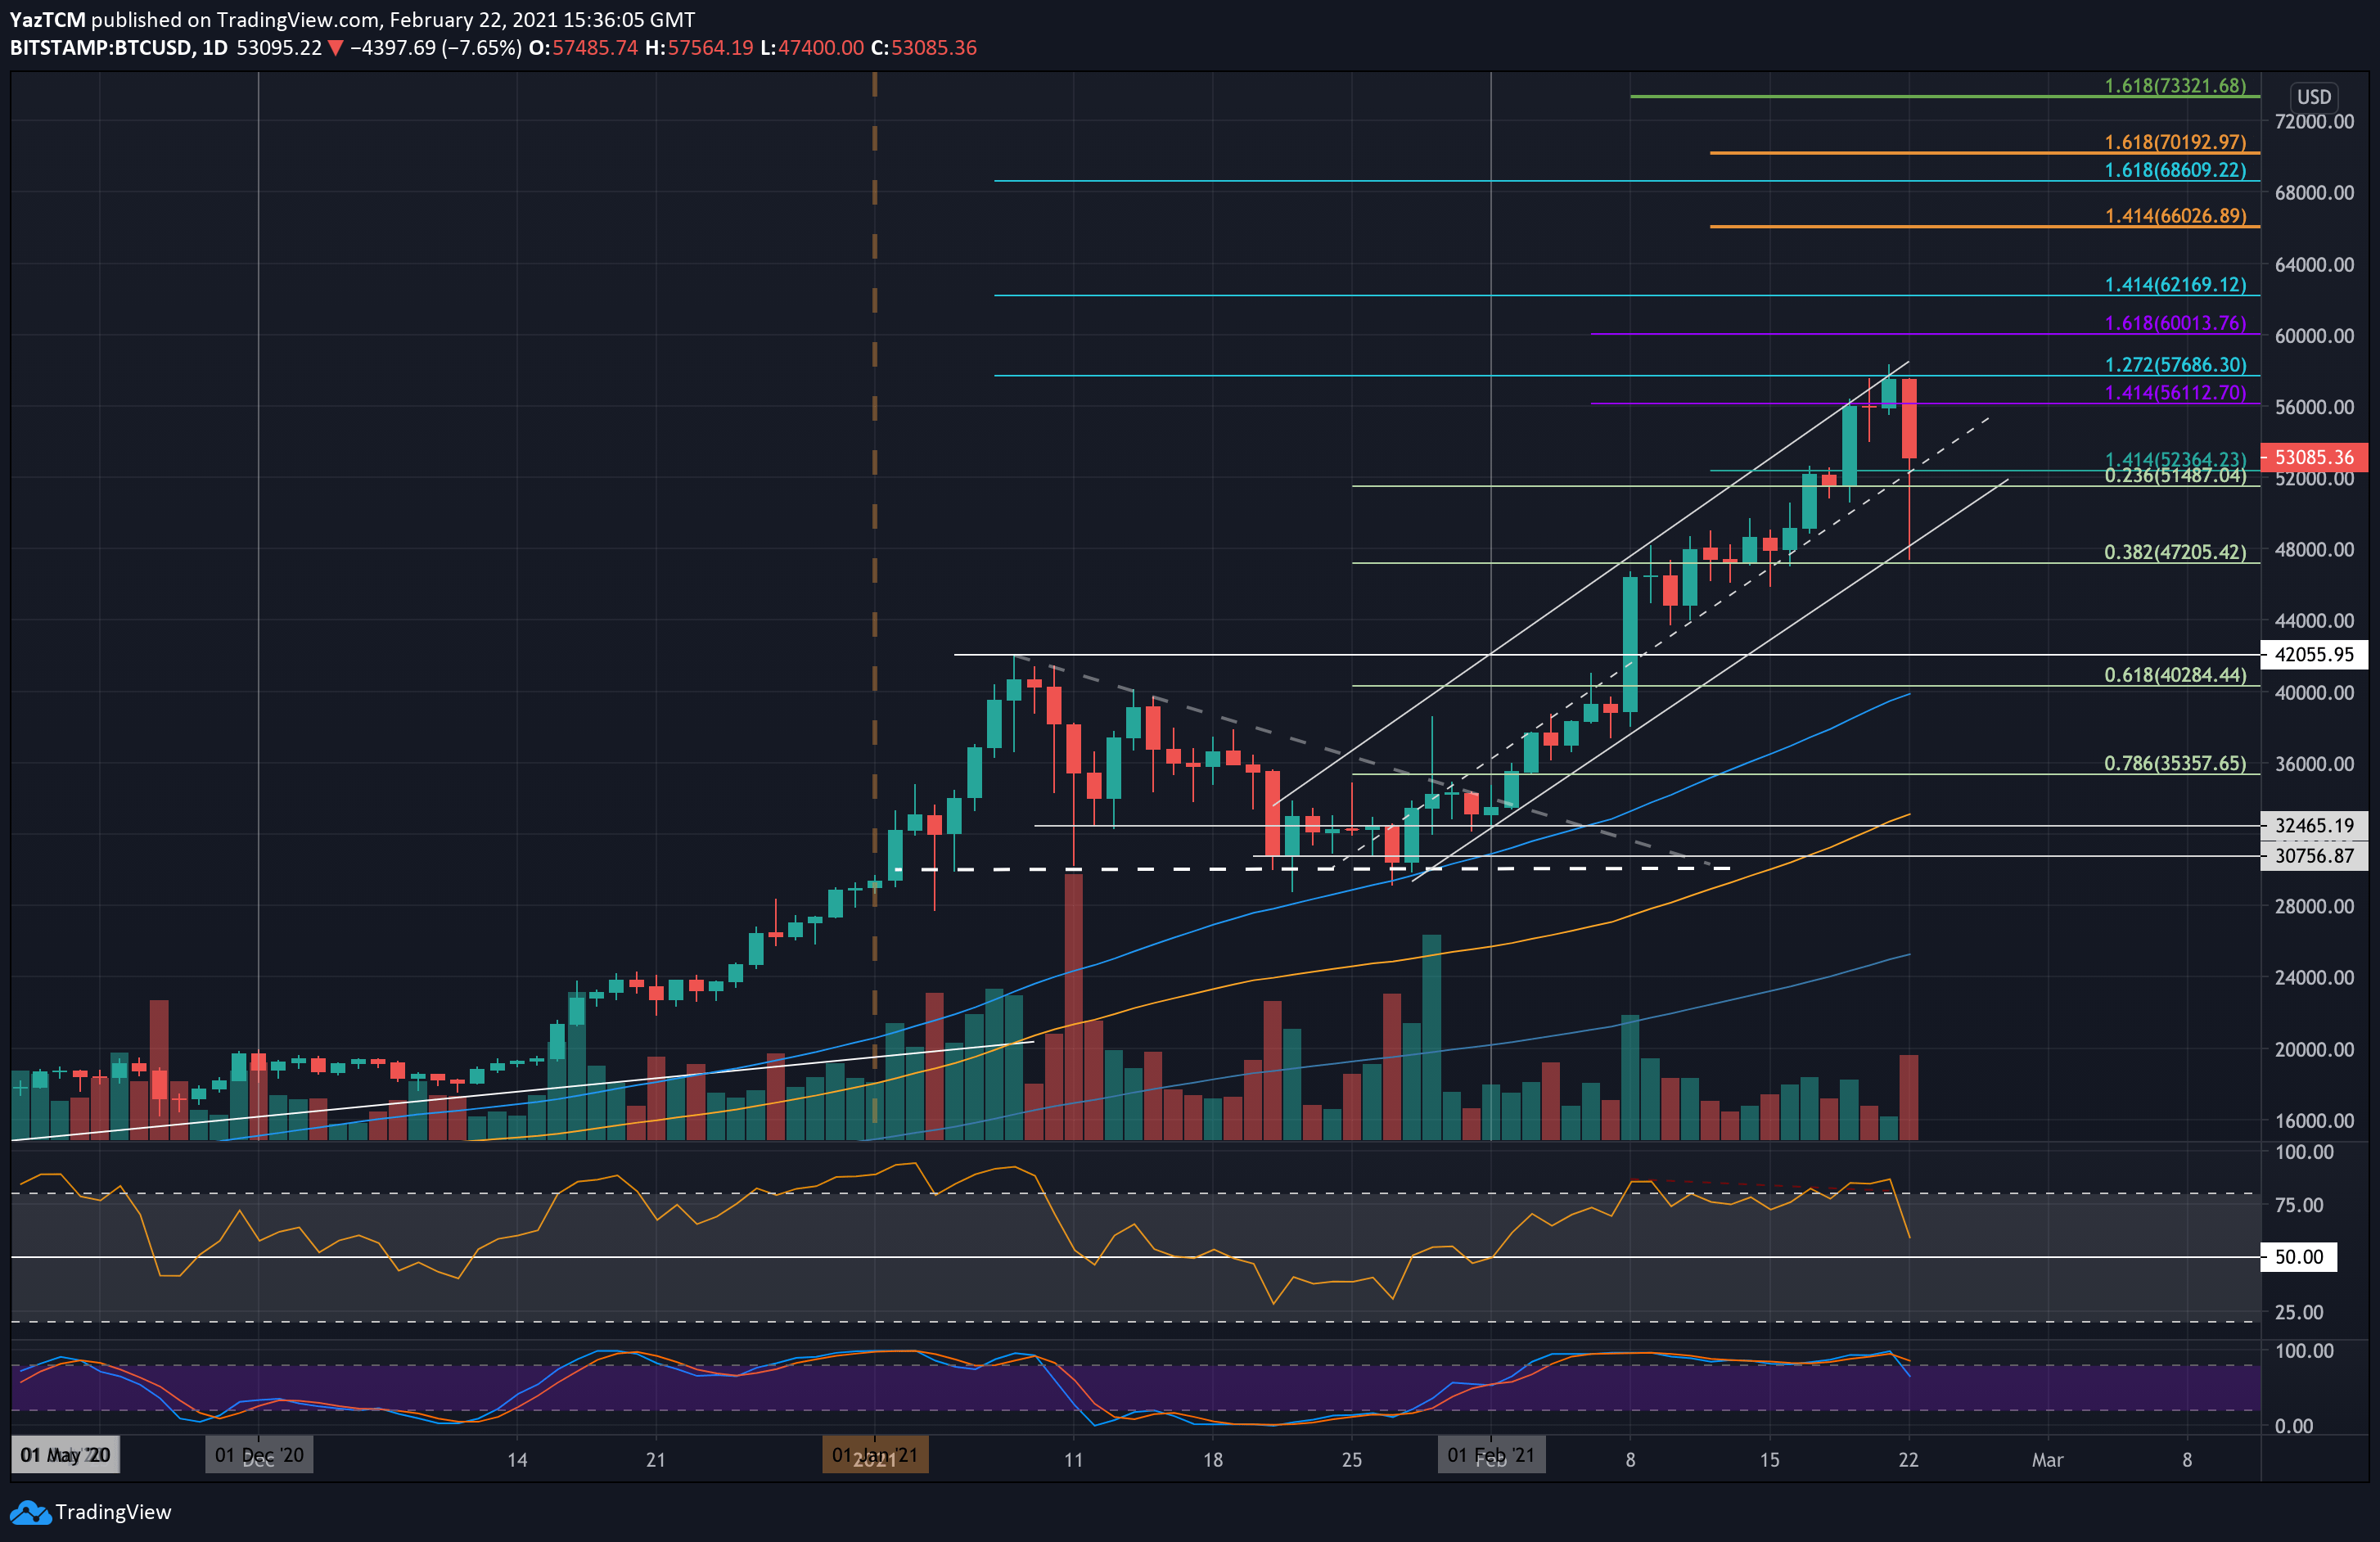
The daily RSI has tumbled from extremely overbought conditions to head toward the midline. It still sits above the midline, indicating that the buyers still control the market momentum. Today’s price fall seems to be pretty healthy for the market as it has provided room for the momentum to cool down before it builds up again.
Bitstamp BTC/USD Daily Chart
Bitstamp BTC/USD 4-Hour Chart