Bitcoin saw another 7% price increase today, sending the primary cryptocurrency to a fresh ATH above K. One can barely believe the fact that only three days ago, on Monday, Bitcoin recorded a daily low below K. And now, as of writing these lines, it gained roughly K. The latter was the value of Bitcoin before the current parabolic run that started in the middle of October 2020.On the smaller timeframe, last Monday, BTC had rebounded retesting the critical support at ,000 – ,400 and has since established a short term rising price channel, as seen on the following 4-hour chart.Yesterday it met resistance at ,150 (1.618 Fib Extension) and closed the daily candle around this level. However, over the past hours of trading, BTC pushed beyond this resistance to climb by nearly
Topics:
Yaz Sheikh considers the following as important: Bitcoin (BTC) Price, BTC Analysis, BTCEUR, BTCGBP, btcusd, btcusdt
This could be interesting, too:
Chayanika Deka writes XRP, SOL, and ADA Inclusion in US Crypto Reserve Pushes Traders on Edge
Chayanika Deka writes Why Arthur Hayes Is Bullish on Bitcoin Under Trump’s Economic Strategy
Mandy Williams writes Why the Bitcoin Market Is Stuck—and the Key Metric That Could Change It: CryptoQuant CEO
Wayne Jones writes Metaplanet Acquires 156 BTC, Bringing Total Holdings to 2,391
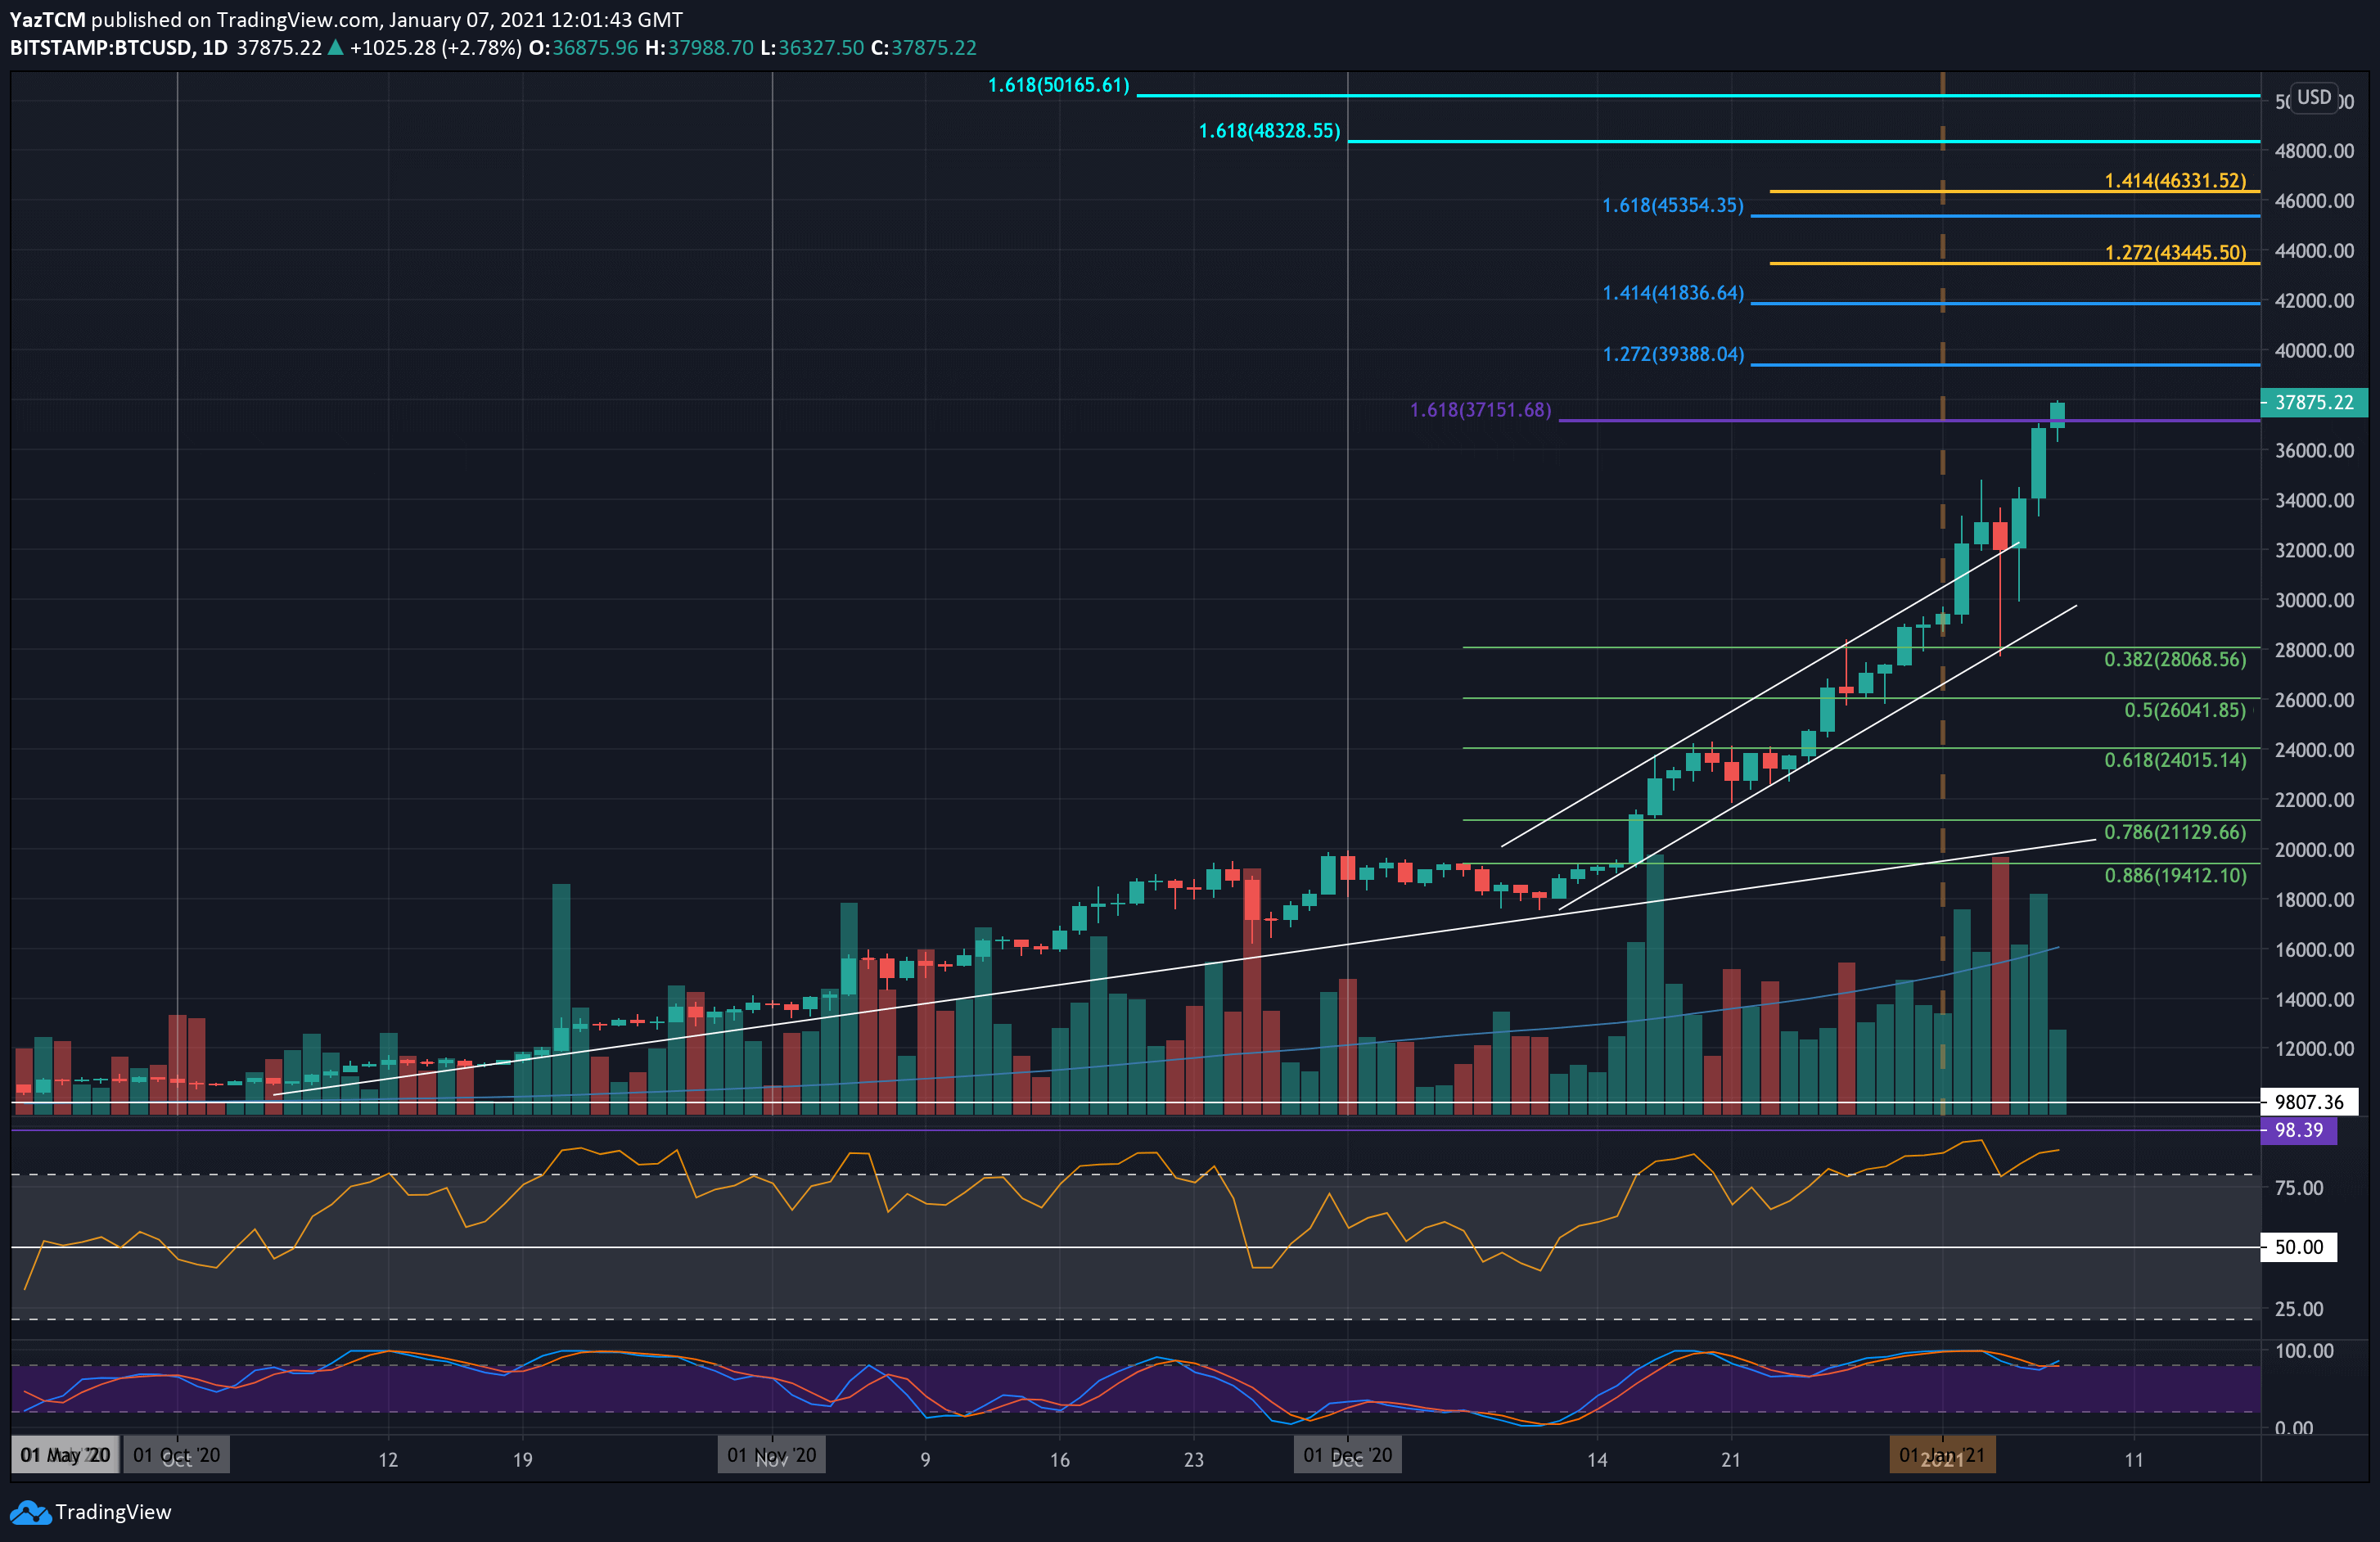
Bitcoin saw another 7% price increase today, sending the primary cryptocurrency to a fresh ATH above $38K. One can barely believe the fact that only three days ago, on Monday, Bitcoin recorded a daily low below $28K. And now, as of writing these lines, it gained roughly $10K. The latter was the value of Bitcoin before the current parabolic run that started in the middle of October 2020.
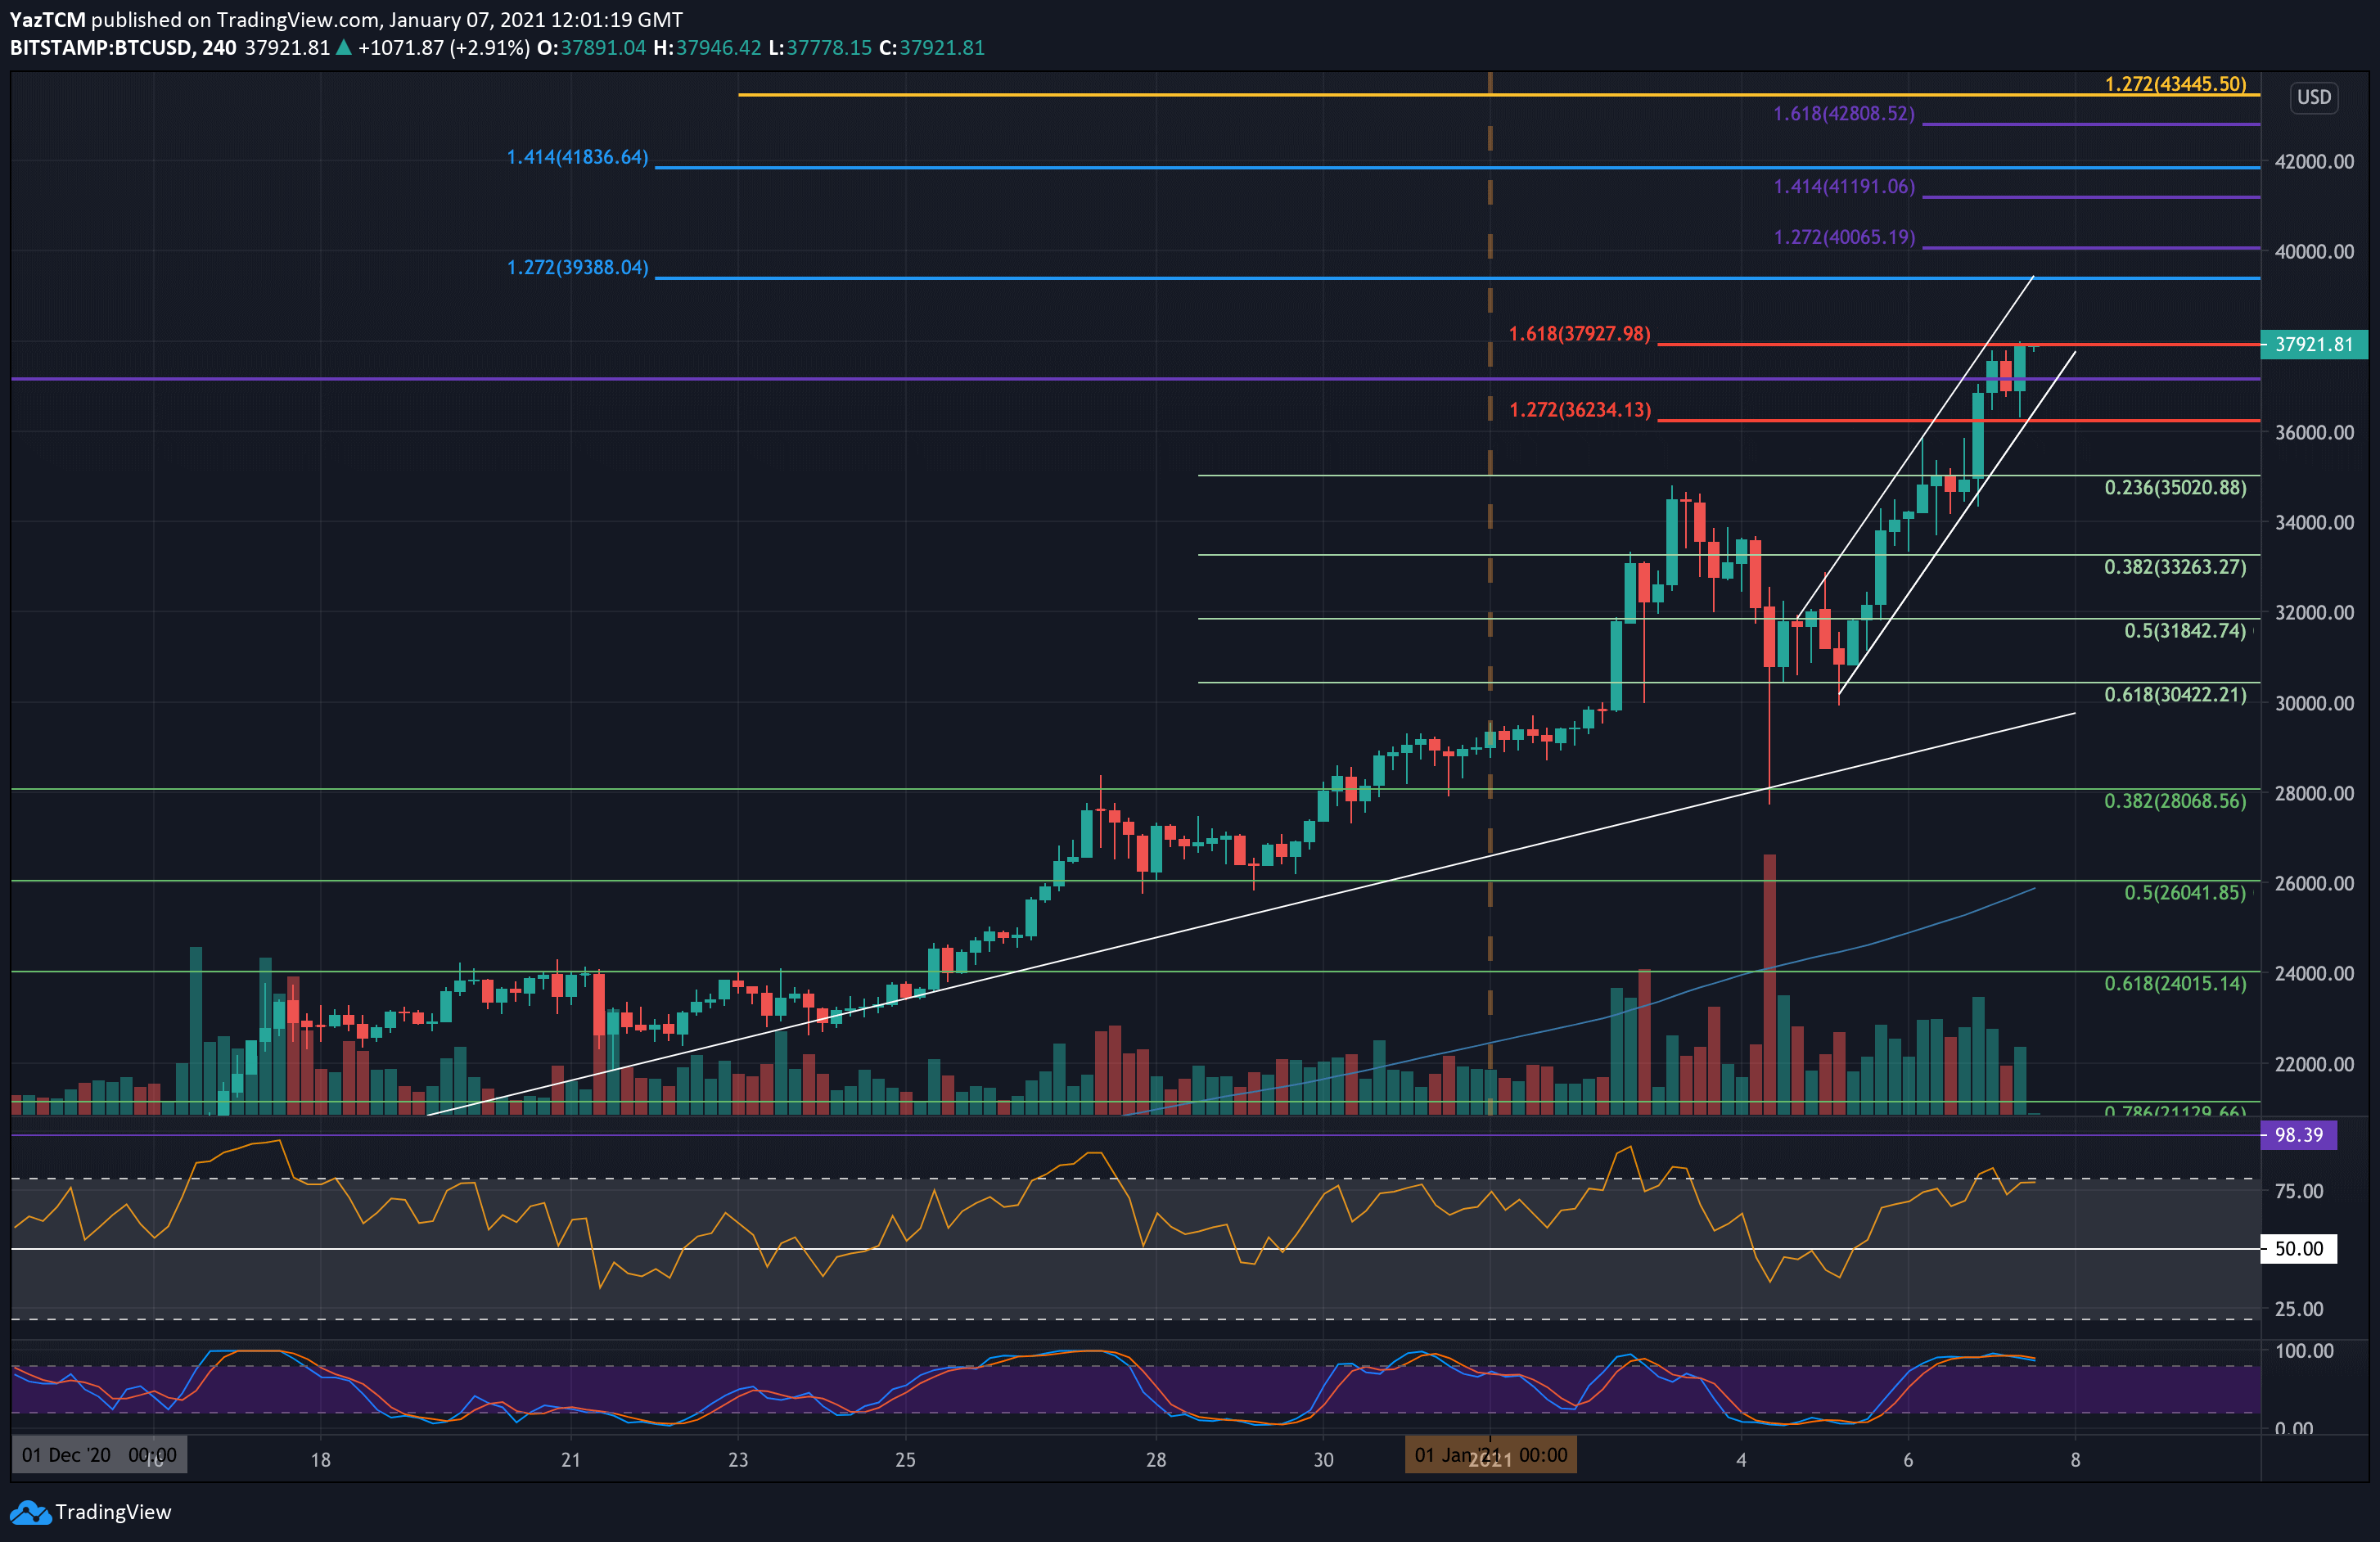
On the smaller timeframe, last Monday, BTC had rebounded retesting the critical support at $30,000 – $30,400 and has since established a short term rising price channel, as seen on the following 4-hour chart.
Yesterday it met resistance at $37,150 (1.618 Fib Extension) and closed the daily candle around this level. However, over the past hours of trading, BTC pushed beyond this resistance to climb by nearly $1,000 and reach the new ATH of nearly $38,200 (as of writing this update).
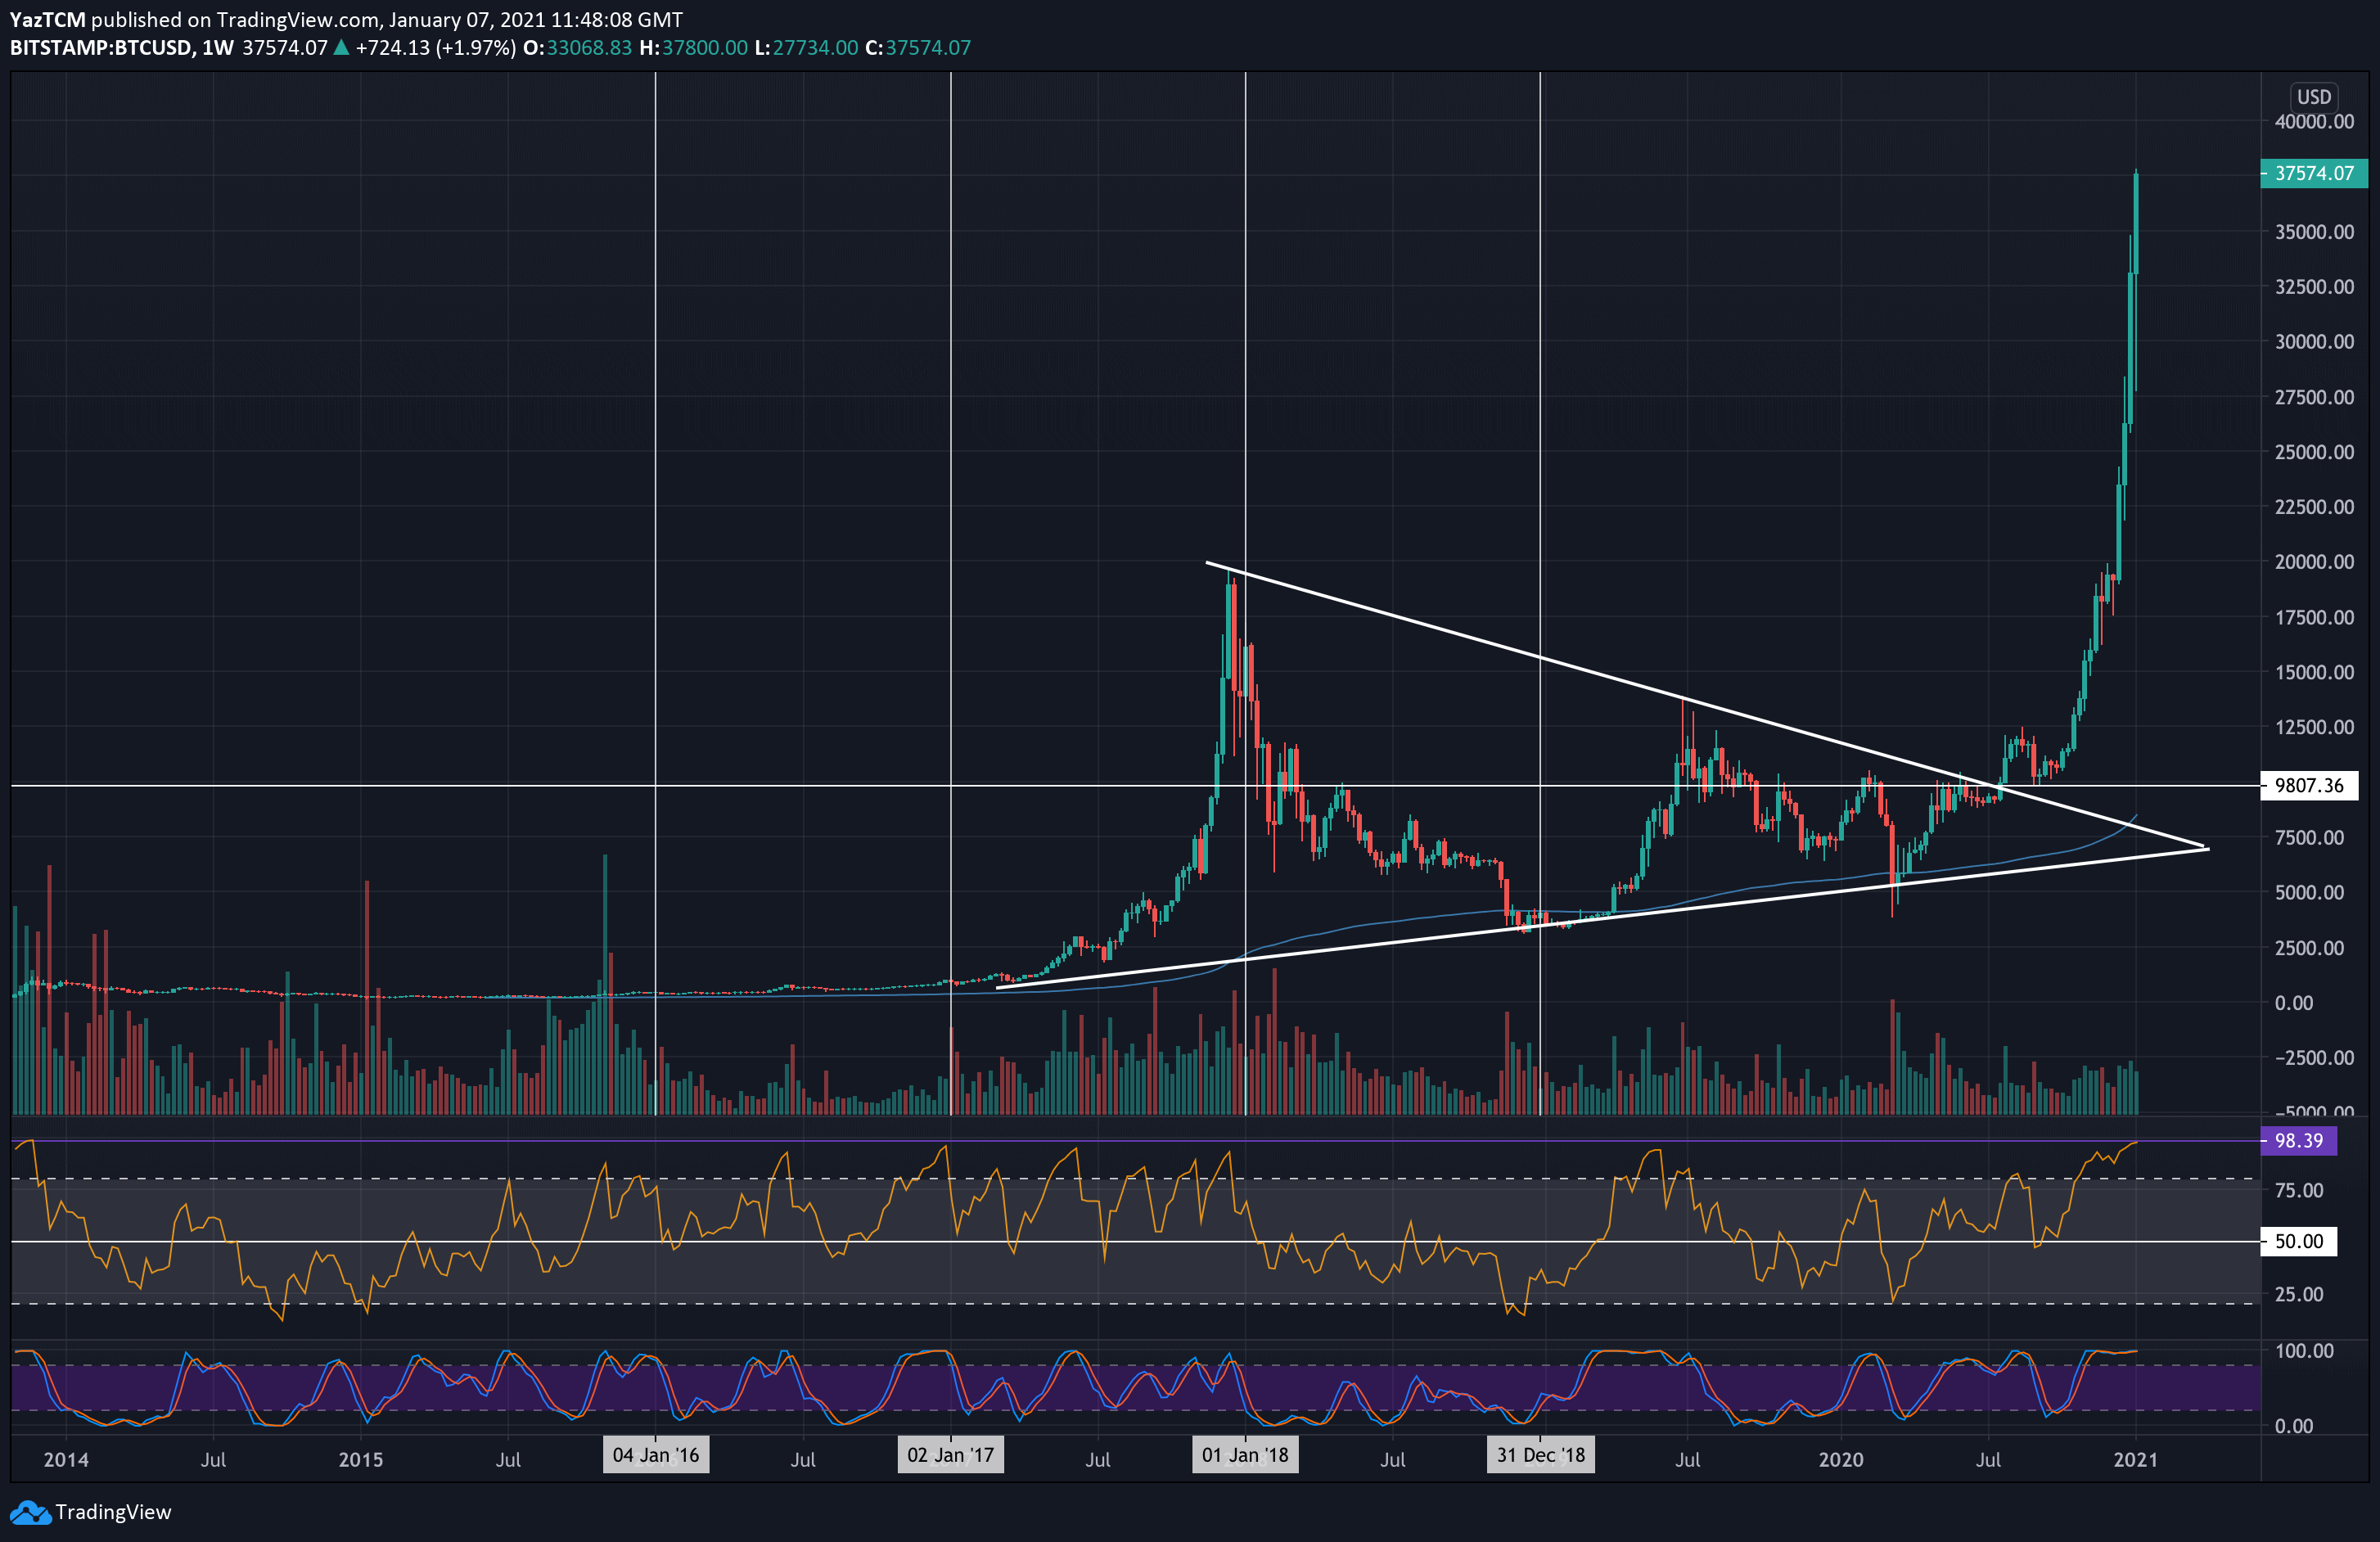
Now for the worrying news: The incredible weekly chart reveals the magnitude of the parabolic move that BTC witnessed over the past four weeks. The last parabolic move (in December 2017) lasted a total of just 5 weeks.
Despite the overwhelming positivity in the market, the weekly RSI is exceptionally overbought as it pushed beyond the December 2017 peak to a level that has not been witnessed since the parabolic run of late 2013.
Every time this overbought level was met on the weekly timeframe, a sharp and massive correction took place. Is Bitcoin done? ‘The trend is your friend,’ hence, the parabola runs until it stops.
Short-Term BTC Price Support and Resistance Levels to Watch
Key Support Levels: $37,150, $36,250, $35,000, $34,000, $33,260.
Key Resistance Levels: $39,400, $40,000, $41,190, $41,850, $43,445.
Looking ahead, the first level of resistance beyond $38,000 lies at $39,400 (1.272 Fib Extension). This is followed by resistance at the psychological level of $40,000, and then $41,190 (short term 1.414 Fib Extension), and $41,850 (1.414 Fib Extension).
Further above lies $43,445 (1.272 Fib Extension – yellow) and $45,350 (1.618 Fib Extension).
On the other side, in case a correction takes place, then the first level of support lies at $37,150 (yesterday’s close). This is followed by $36,250, $35,000 (short term .236 Fib), $34,000, and $33,260 (short term .382 Fib).
The Daily RSI remains in extremely overbought territory (87, which is inches from Sunday’s yearly high), and, as mentioned, the weekly RSI is now at a level that has not been since late-2013.
We can start seeing a bearish divergence (not confirmed) on the 4-hour and the daily chart, which signals a necessary correction. It can arrive at any moment. However, until then, the short-term bull run is intact.
Bitstamp BTC/USD Daily Chart
Bitstamp BTC/USD 4-hour Chart