After an impressive rebound following the retest of the K area on Sunday, bitcoin reached K earlier today. However, over the past hours, the primary cryptocurrency is losing momentum. The question is whether this huge K recovery will turn into a “dead-cat bounce,” or bitcoin will able to penetrate through the heavy resistance zone of -42K? The good news is that, as of now, bitcoin’s price is still up by a total of 18% from Sunday’s low. Quick recap: The primary cryptocurrency dipped as low as ,100 on Sunday but managed to close the daily candle at support around ,760 (downside 1.414 Fib Extension). From there, BTC rebounded almost 15% yesterday to reach a high of ,960 on Bitstamp. This allowed it to break toward the upside of a descending price
Topics:
Yaz Sheikh considers the following as important: Bitcoin (BTC) Price, BTC Analysis, BTCEUR, BTCGBP, btcusd, btcusdt
This could be interesting, too:
Chayanika Deka writes XRP, SOL, and ADA Inclusion in US Crypto Reserve Pushes Traders on Edge
Chayanika Deka writes Why Arthur Hayes Is Bullish on Bitcoin Under Trump’s Economic Strategy
Mandy Williams writes Why the Bitcoin Market Is Stuck—and the Key Metric That Could Change It: CryptoQuant CEO
Wayne Jones writes Metaplanet Acquires 156 BTC, Bringing Total Holdings to 2,391
After an impressive rebound following the retest of the $30K area on Sunday, bitcoin reached $40K earlier today. However, over the past hours, the primary cryptocurrency is losing momentum.
The question is whether this huge $10K recovery will turn into a “dead-cat bounce,” or bitcoin will able to penetrate through the heavy resistance zone of $40-42K?
The good news is that, as of now, bitcoin’s price is still up by a total of 18% from Sunday’s low.
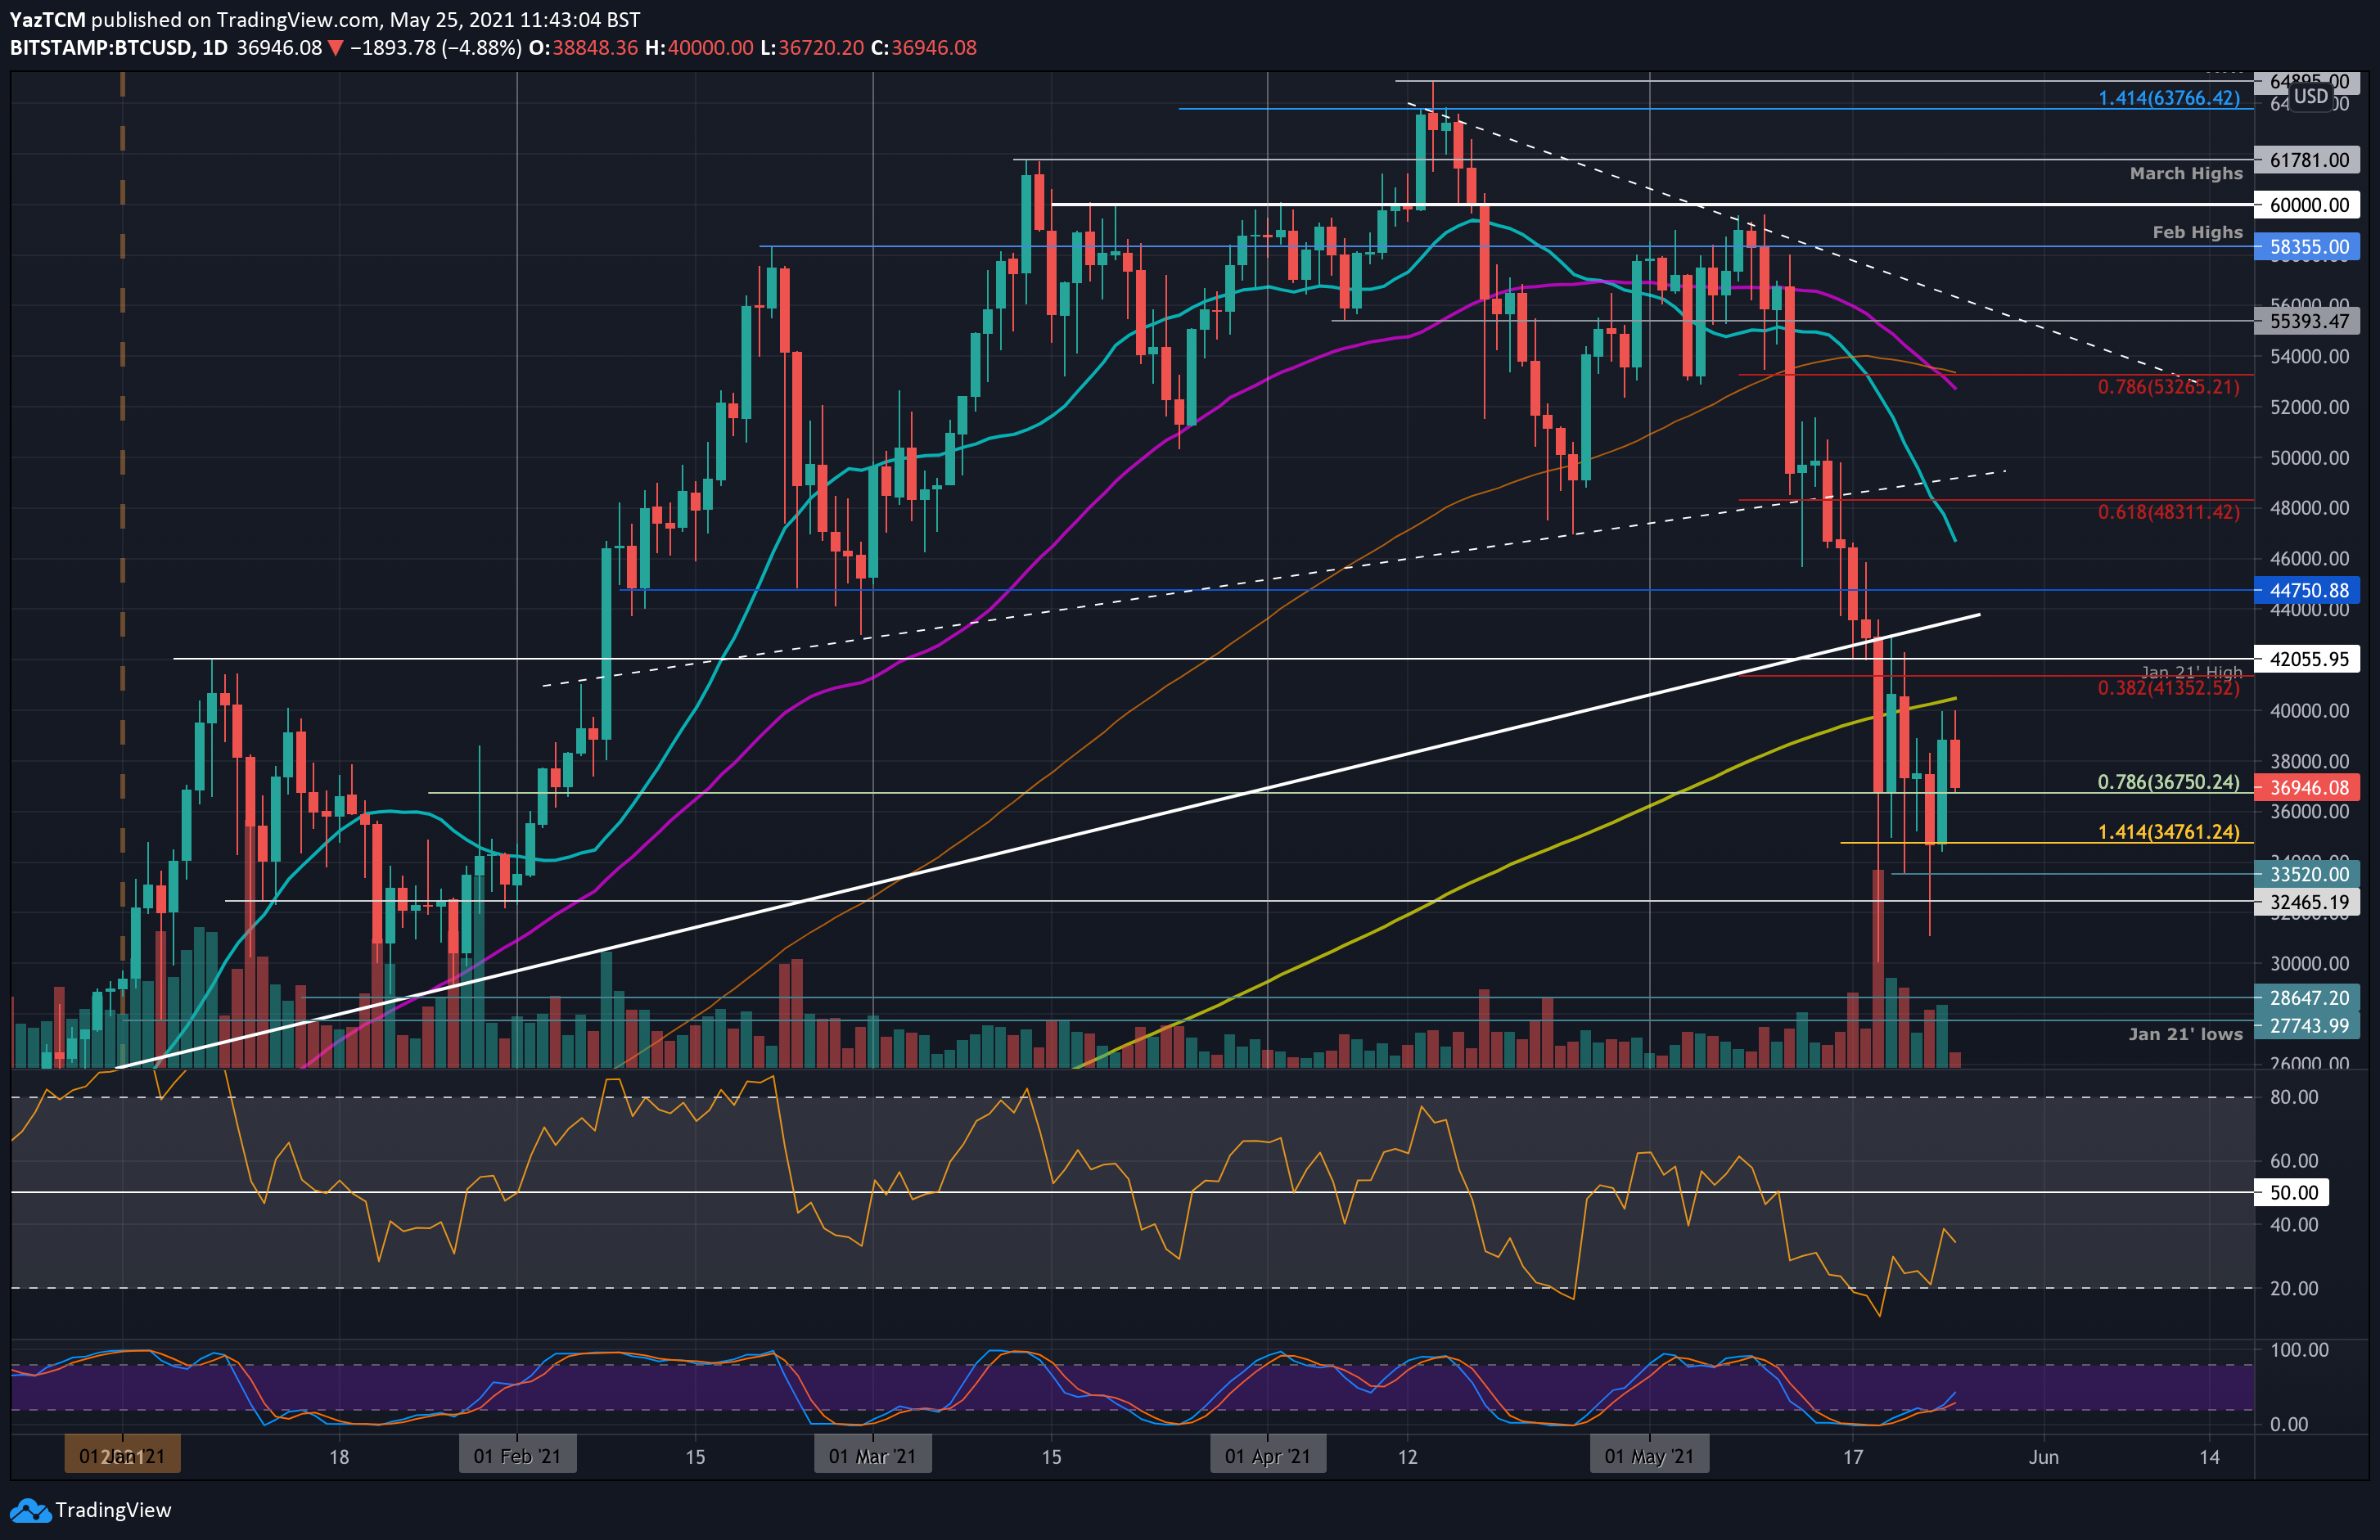
Quick recap: The primary cryptocurrency dipped as low as $31,100 on Sunday but managed to close the daily candle at support around $34,760 (downside 1.414 Fib Extension).
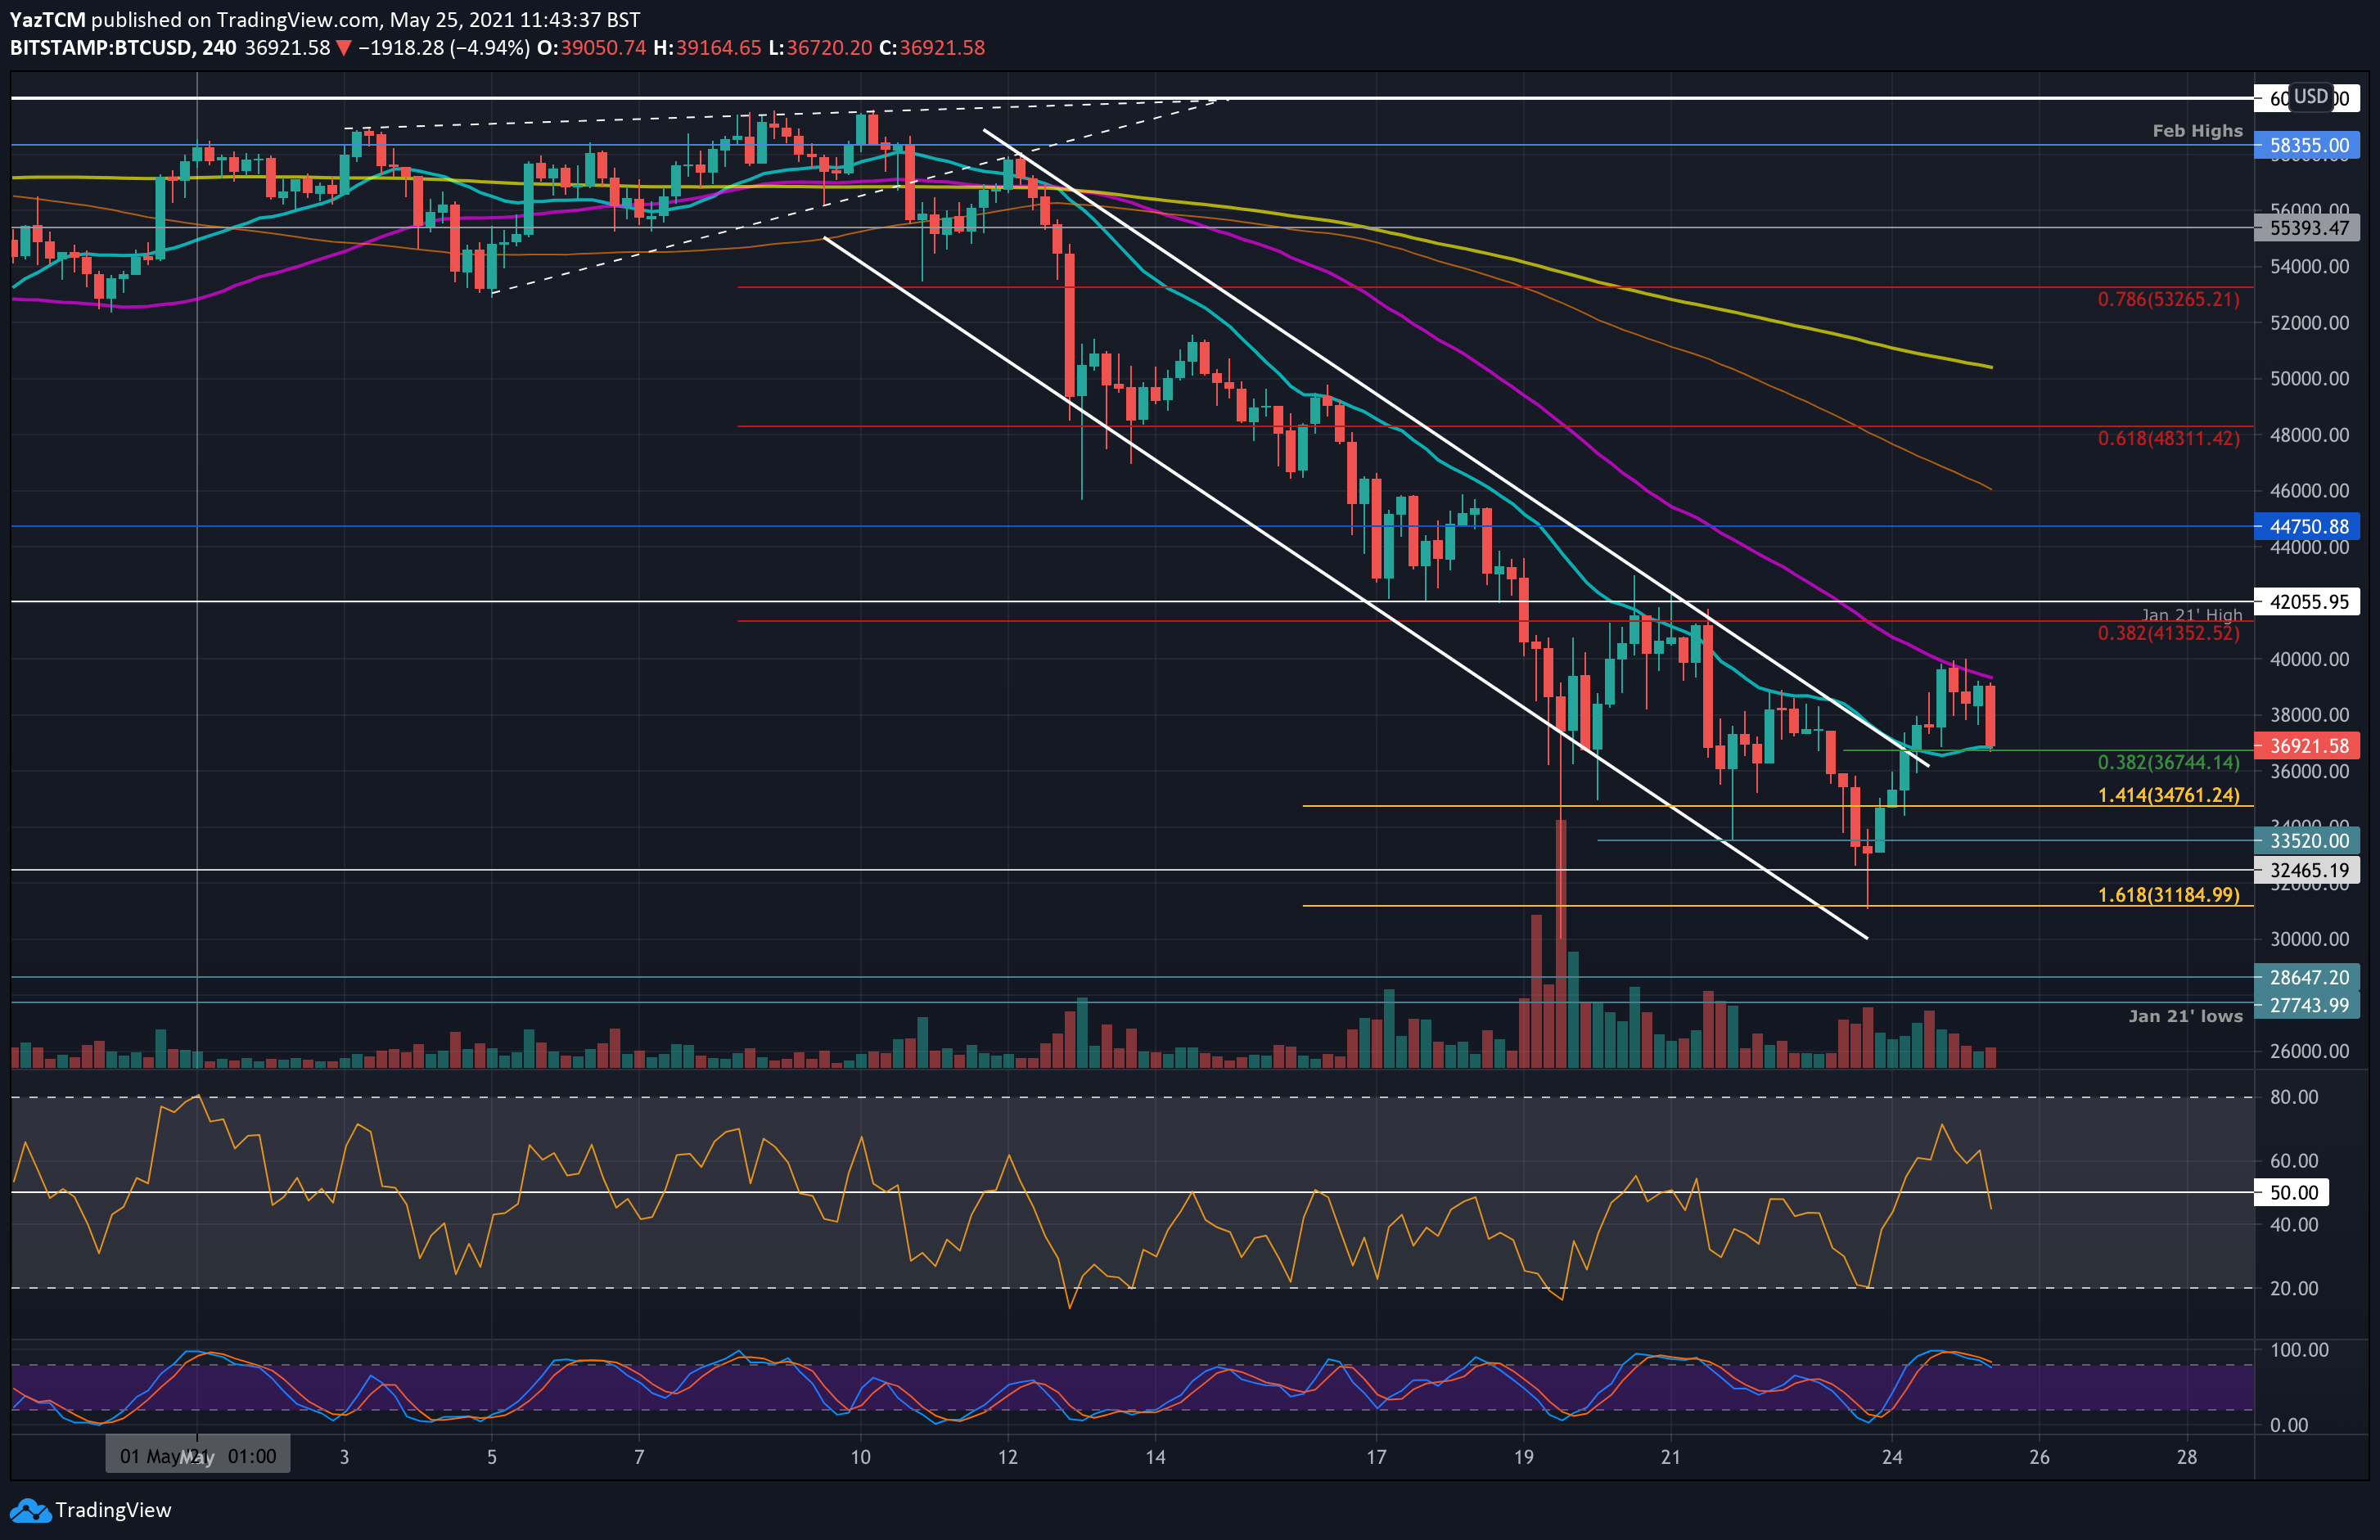
From there, BTC rebounded almost 15% yesterday to reach a high of $39,960 on Bitstamp. This allowed it to break toward the upside of a descending price channel, as mentioned here yesterday, which could act as the first signal that a short-term recovery is on the table.
Additionally, it seems that the bullish “W” formation with the double bottom around the $30-$31K area is continuing to play out (unless the latter price zone will get broken down).
Despite the above, BTC had so far failed to breach the solid resistance at $40-$42K, which provided strong support (now resistance) previously. As you probably know, strong support turns into strong resistance after being broken.
Also in this resistance: the 200-day moving average line, which is now sitting at $40.5K. Over the past hours, we saw two rejections of the $40K resistance.
After the second attempt, bitcoin quickly plunged towards the .786 Fib support around $36,750.
BTC Price Support and Resistance Levels to Watch
Key Support Levels: $36,750 – $36,400, $34,760, $33,520, $32,465, $31,100.
Key Resistance Levels: $40 – $40.5K, $41,350, $42,000, $44,750, $46,815.
Looking ahead, the first resistance lies at $40,000 (200-day MA at $40.5K). This is followed by $41,350 (bearish .382 Fib) and $42,000 (Jan 2021 highs). If the buyers break above the zone, we can expect a quick move to the further resistance zone at $44,750, $46,815 (100-day MA), and $48,310 (bearish .618 Fib).
On the other side, the first support lies at $36,750 (.786 Fib). This is followed by $36,400 (1-hour’s MA-50) $34,760 (downside 1.414 Fib Extension), $33,520, $32,465, and $31,100 (Sunday’s low).
As mentioned here yesterday, the bullish divergence on the daily timeframes RSI has played out nicely, while the RSI created a higher low whereas the price had seen a lower low. The RSI is still in the bearish territory as it sits beneath the midline, but the ascent shows that the bearish momentum is starting to fade quickly.
Bitstamp BTC/USD Daily Chart
Bitstamp BTC/USD 4-Hour Chart