ADA/USD – ADA Reverses At .56 Resistance Key Support Levels: .45, .40, .30.Key Resistance Levels: .6, .75, .80. Like most cryptocurrencies, ADA saw a drastic 63% price drop from a high of .52 to a low of %excerpt%.91 in May. It quickly rebound from the Wednesday price crash to %excerpt%.91 as it closed the daily candle above the 50-day MA. Unfortunately, during the remainder of last week, ADA slowly declined into the 100-day MA around .30. Yesterday, it found support at .23 (.786 Fib) and rebounded to reach resistance at .6 (bearish .382 Fib). Today, ADA did spike above .60 but struggled to make ground above the .6 resistance and has since dropped to .48. ADA/USD Daily Chart. Source: TradingViewADA-USD Short Term Price Prediction Looking ahead, the first
Topics:
Yaz Sheikh considers the following as important: ADABTC, ADAUSD, Cardano (ADA) Price, Price Analysis
This could be interesting, too:
Jordan Lyanchev writes Cardano (ADA) Surpasses Dogecoin After 55% Surge
Jordan Lyanchev writes Trump Confirms Work on Strategic Crypto Reserve: XRP, ADA, SOL Included
Dimitar Dzhondzhorov writes Millions of ADA Sold by Cardano Whales During Market Crash – Will the Decline Continue?
Jordan Lyanchev writes Here’s How Cardano’s 17% Weekly Correction Can Help ADA Hit This Cycle: Analyst
ADA/USD – ADA Reverses At $1.56 Resistance
Key Support Levels: $1.45, $1.40, $1.30.
Key Resistance Levels: $1.6, $1.75, $1.80.
Like most cryptocurrencies, ADA saw a drastic 63% price drop from a high of $2.52 to a low of $0.91 in May. It quickly rebound from the Wednesday price crash to $0.91 as it closed the daily candle above the 50-day MA.
Unfortunately, during the remainder of last week, ADA slowly declined into the 100-day MA around $1.30. Yesterday, it found support at $1.23 (.786 Fib) and rebounded to reach resistance at $1.6 (bearish .382 Fib).
Today, ADA did spike above $1.60 but struggled to make ground above the $1.6 resistance and has since dropped to $1.48.

ADA-USD Short Term Price Prediction
Looking ahead, the first support lies at $1.45 (50-day MA). This is followed by $1.40, $1.30 (100-day MA), and $1.23 (.786 Fib). Added support is found at $1.12 (.618 Fib), $1.00, and $0.91.
On the other side, the first strong resistance lies at $1.56 (bearish .382 Fib). This is followed by $1.75 (bearish .5 Fib & 20-day MA), $1.80, and $1.92 (bearish .618 Fib).
The RSI is beneath the midline and recently made a lower high, indicating that the bearish momentum might be starting to gain more strength. If it continues to make a lower low this week, the increased bearish momentum is likely to drive ADA back toward the 200-day MA.
ADA/BTC – Bulls Break 4000 SAT
Key Support Levels: 3780 SAT, 3420 SAT, 3200 SAT.
Key Resistance Levels: 4200 SAT, 4500 SAT, 4900 SAT.
ADA fell from the 5000 SAT high this month to crash as low as 3100 SAT. Luckily, it rebounded during the price plummet and eventually found support at 3780 SAT (.382 Fib & 20-day MA) over the weekend.
It rebounded from this support yesterday and managed to poke back above 4000 SAT today.
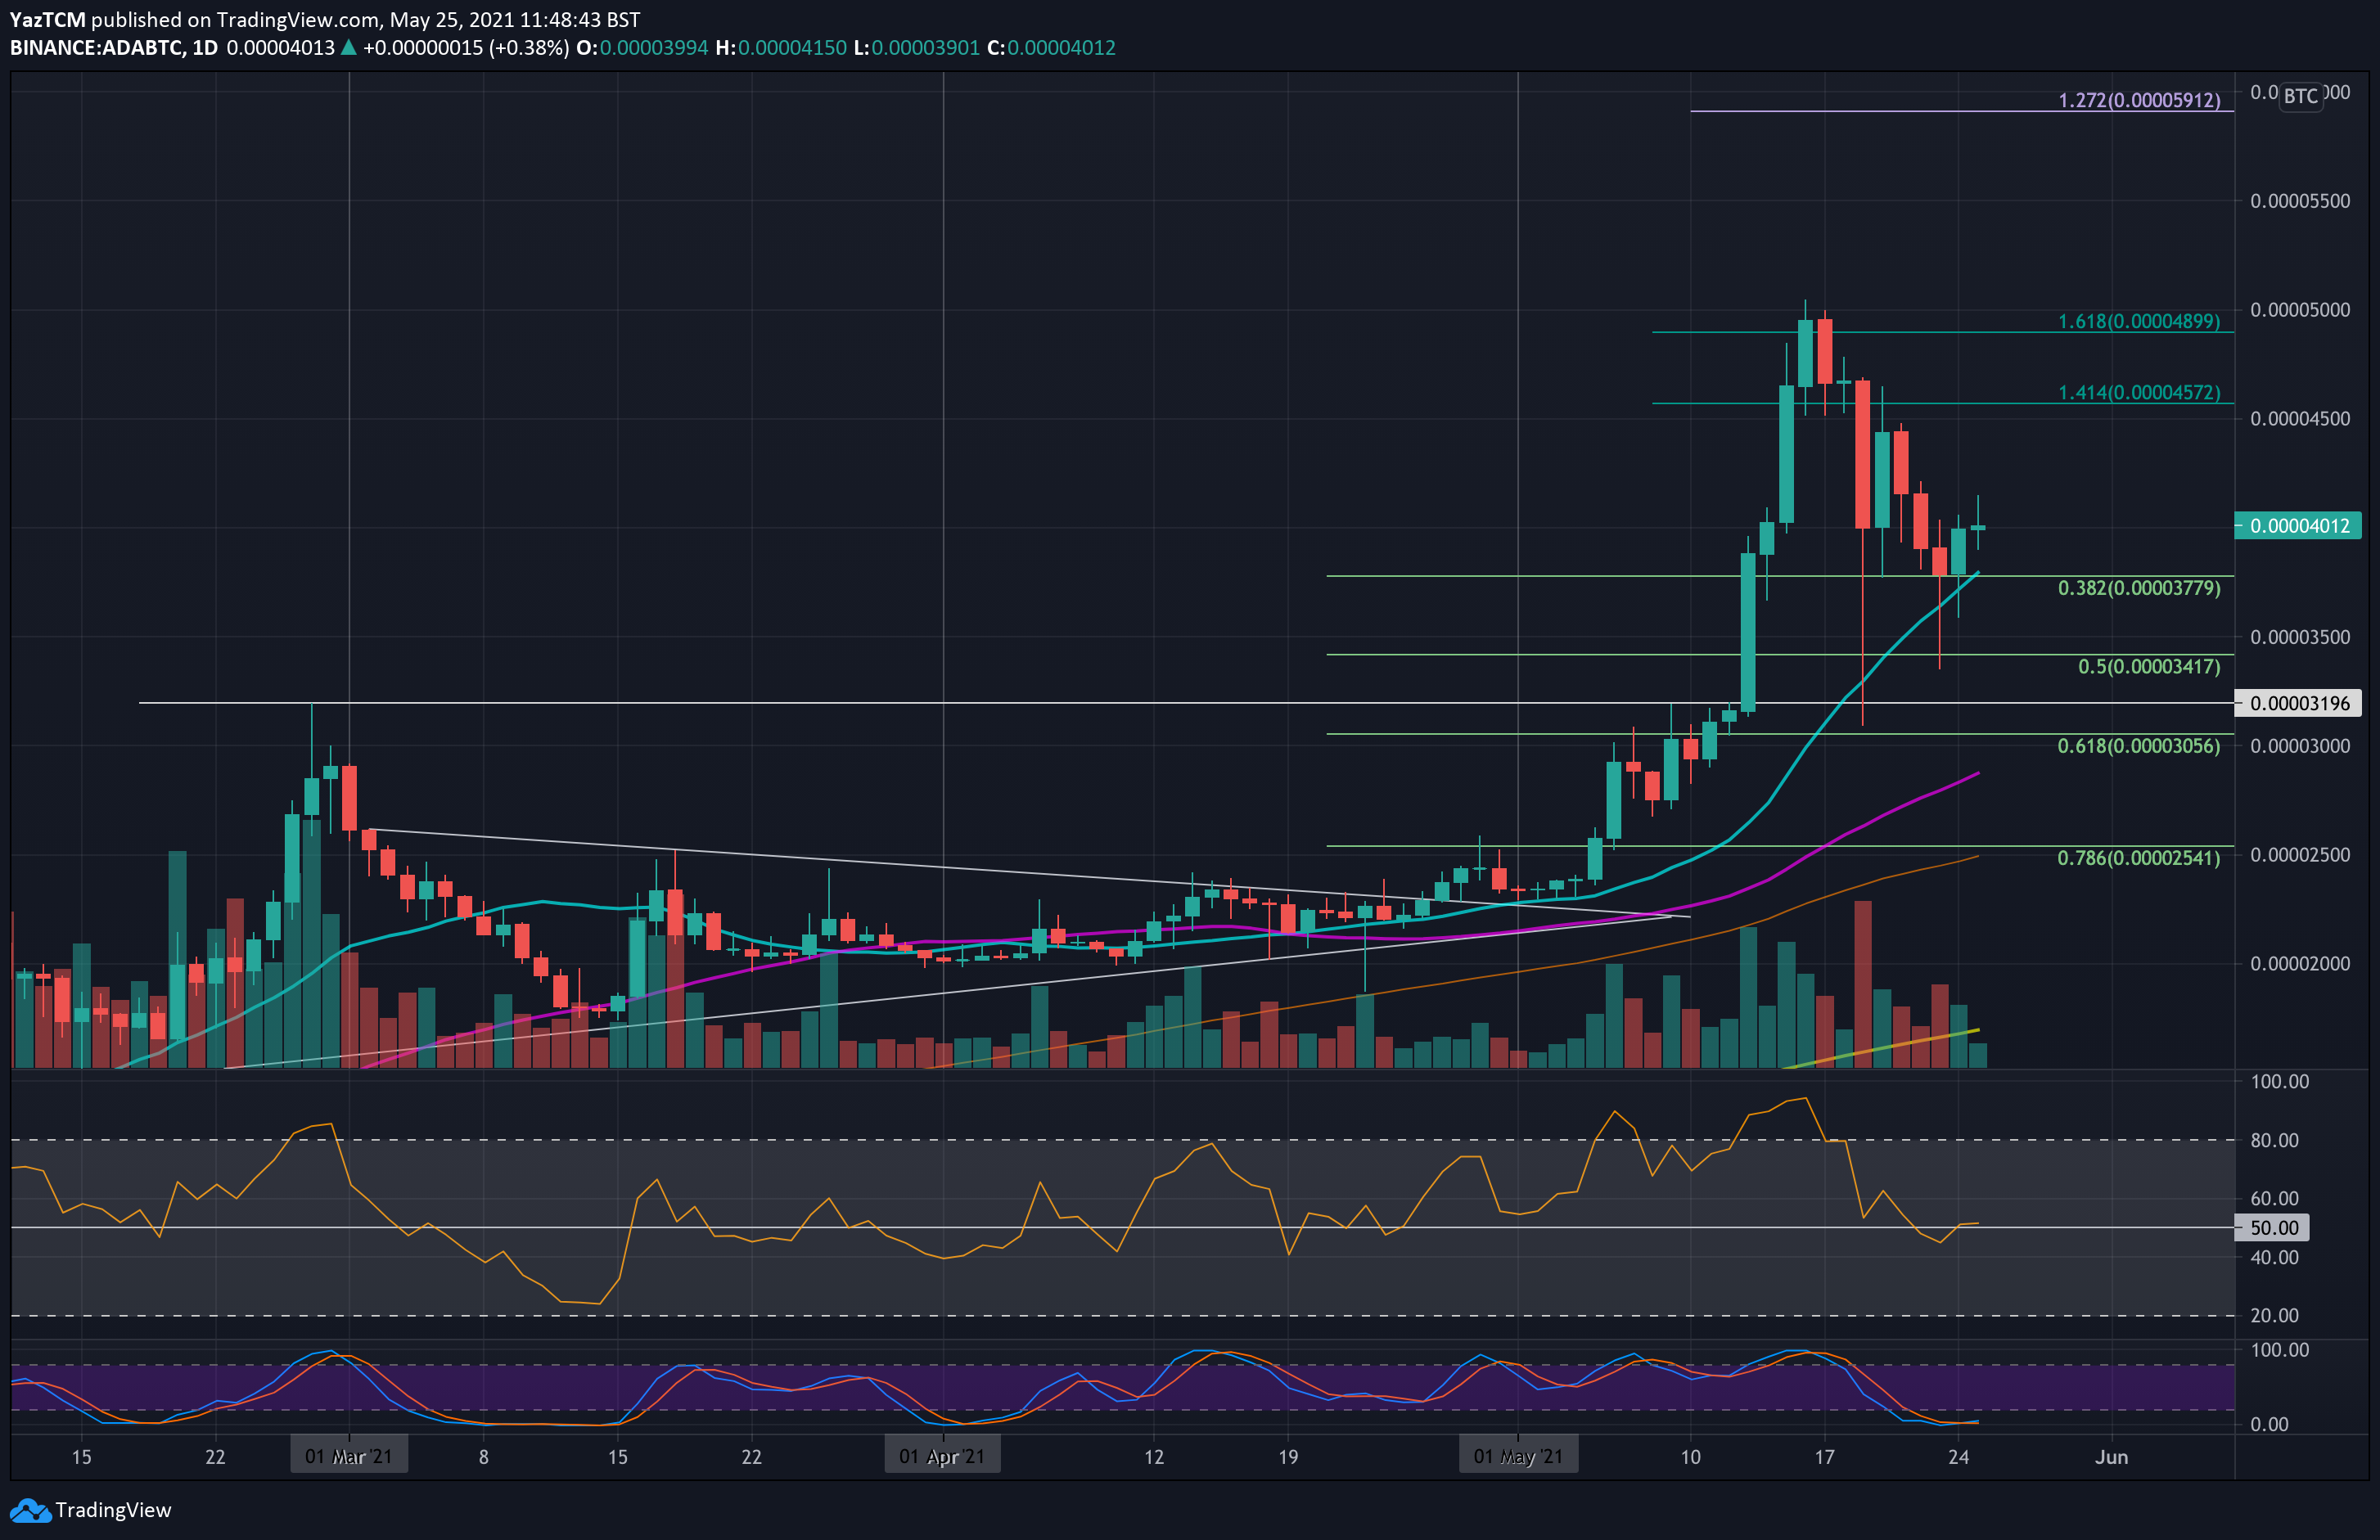
ADA-BTC Short Term Price Prediction
Moving forward, the first resistance lies at 4200 SAT. This is followed by 4500 SAT (1.414 Fib Extension), 4900 SAT (1.618 Fib Extension), and 5000 SAT.
On the other side, the first solid support lies at 3780 SAT (.382 Fib & 20-day MA). This is followed by 3420 SAT (.5 Fib), 3200 SAT, and 3055 SAT (.618 Fib).
The RSI is directly on the midline, indicating indecision in the market. However, the Stochastic RSI is primed for a bullish crossover signal that should help ADA to rise.