Bitcoin is up by a total of 20% this week and it’s back at the K mark range. Quick recap: BTC bounced from ,760 on Sunday and surged even more on Monday to break the early June significant highs at ,500 and even reach resistance at ,760 (bearish .382 Fib Retracement). The bullish momentum stalled slightly since reaching the resistance at ,760 but manages to remain above ,500 (early-June highs) and created a short-term tight trading range. In addition, BTC is trading above a short-term rising trend line and is also trading inside a rising wedge formation, which is all best seen on the following 4-hour chart. Rising wedge tends to be a bearish formation, but often in bull markets we see a bullish breakout of the pattern. Another way to look at it is the
Topics:
Yaz Sheikh considers the following as important: Bitcoin (BTC) Price, BTC Analysis, BTCEUR, BTCGBP, btcusd, btcusdt
This could be interesting, too:
Chayanika Deka writes XRP, SOL, and ADA Inclusion in US Crypto Reserve Pushes Traders on Edge
Chayanika Deka writes Why Arthur Hayes Is Bullish on Bitcoin Under Trump’s Economic Strategy
Mandy Williams writes Why the Bitcoin Market Is Stuck—and the Key Metric That Could Change It: CryptoQuant CEO
Wayne Jones writes Metaplanet Acquires 156 BTC, Bringing Total Holdings to 2,391
Bitcoin is up by a total of 20% this week and it’s back at the $40K mark range.
Quick recap: BTC bounced from $34,760 on Sunday and surged even more on Monday to break the early June significant highs at $39,500 and even reach resistance at $40,760 (bearish .382 Fib Retracement).
The bullish momentum stalled slightly since reaching the resistance at $40,760 but manages to remain above $39,500 (early-June highs) and created a short-term tight trading range.
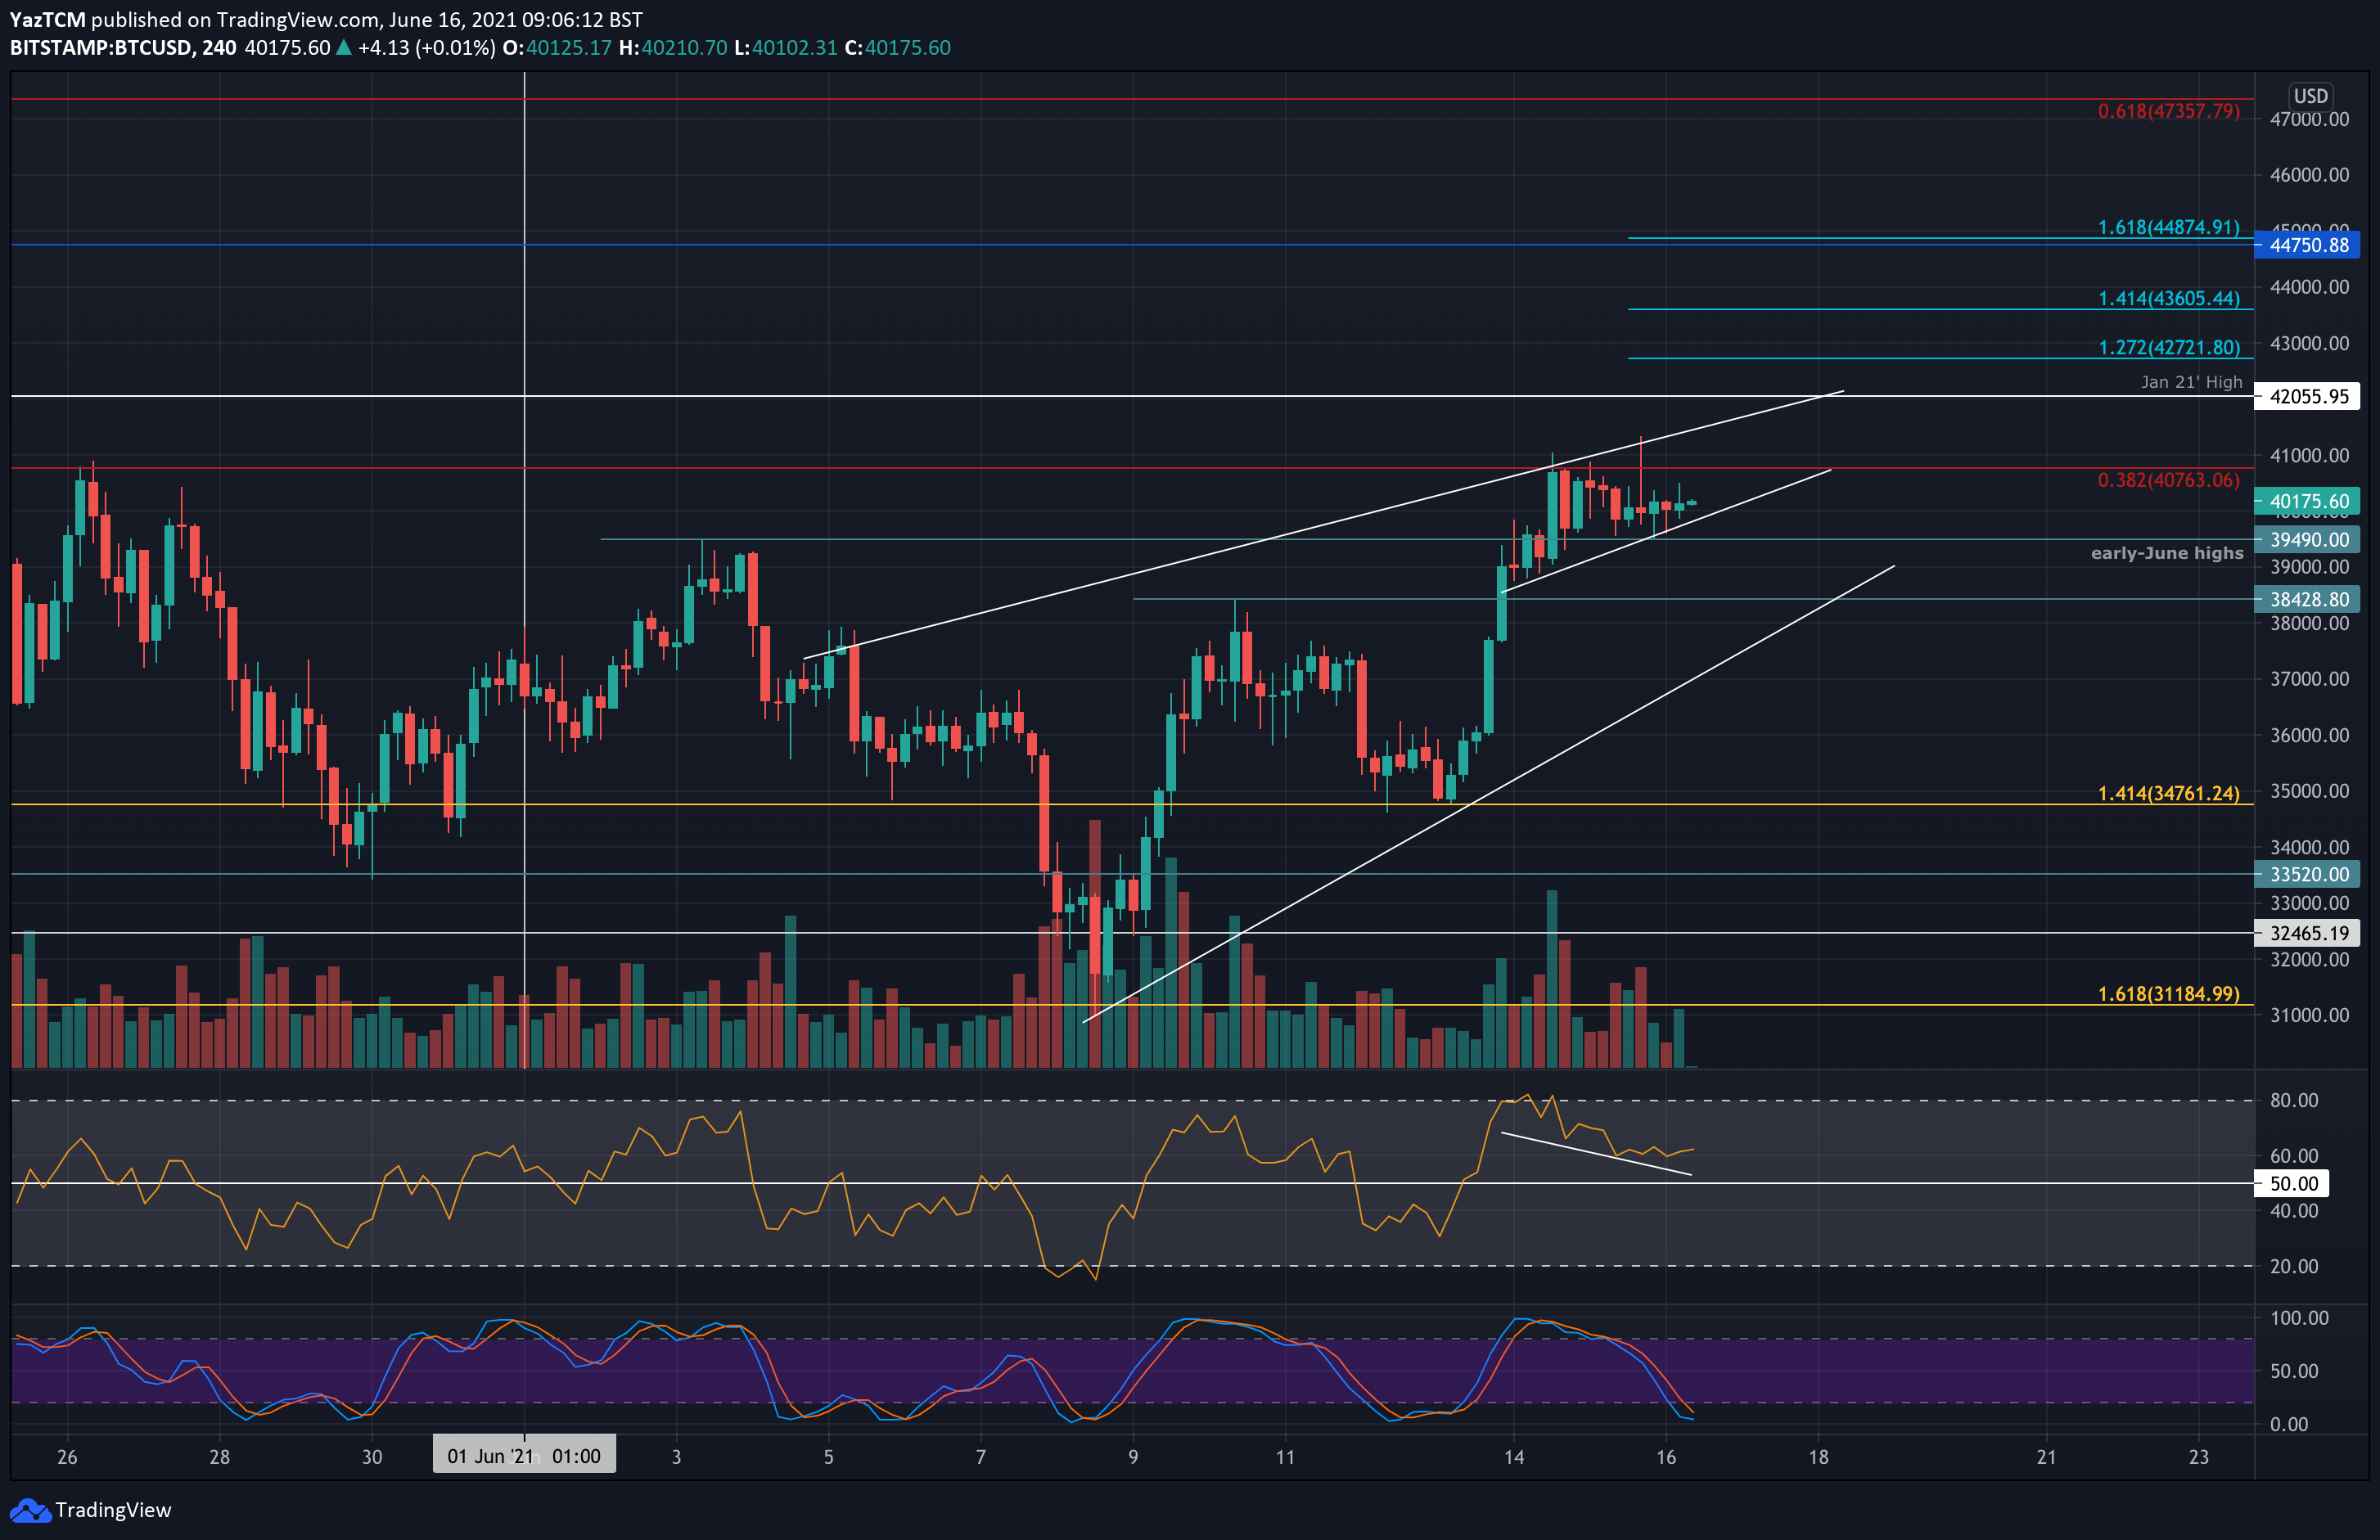
In addition, BTC is trading above a short-term rising trend line and is also trading inside a rising wedge formation, which is all best seen on the following 4-hour chart. Rising wedge tends to be a bearish formation, but often in bull markets we see a bullish breakout of the pattern.
Another way to look at it is the short-term rising trend line and the resistance at $40,760 are creating the formation of a short-term ascending triangle pattern.
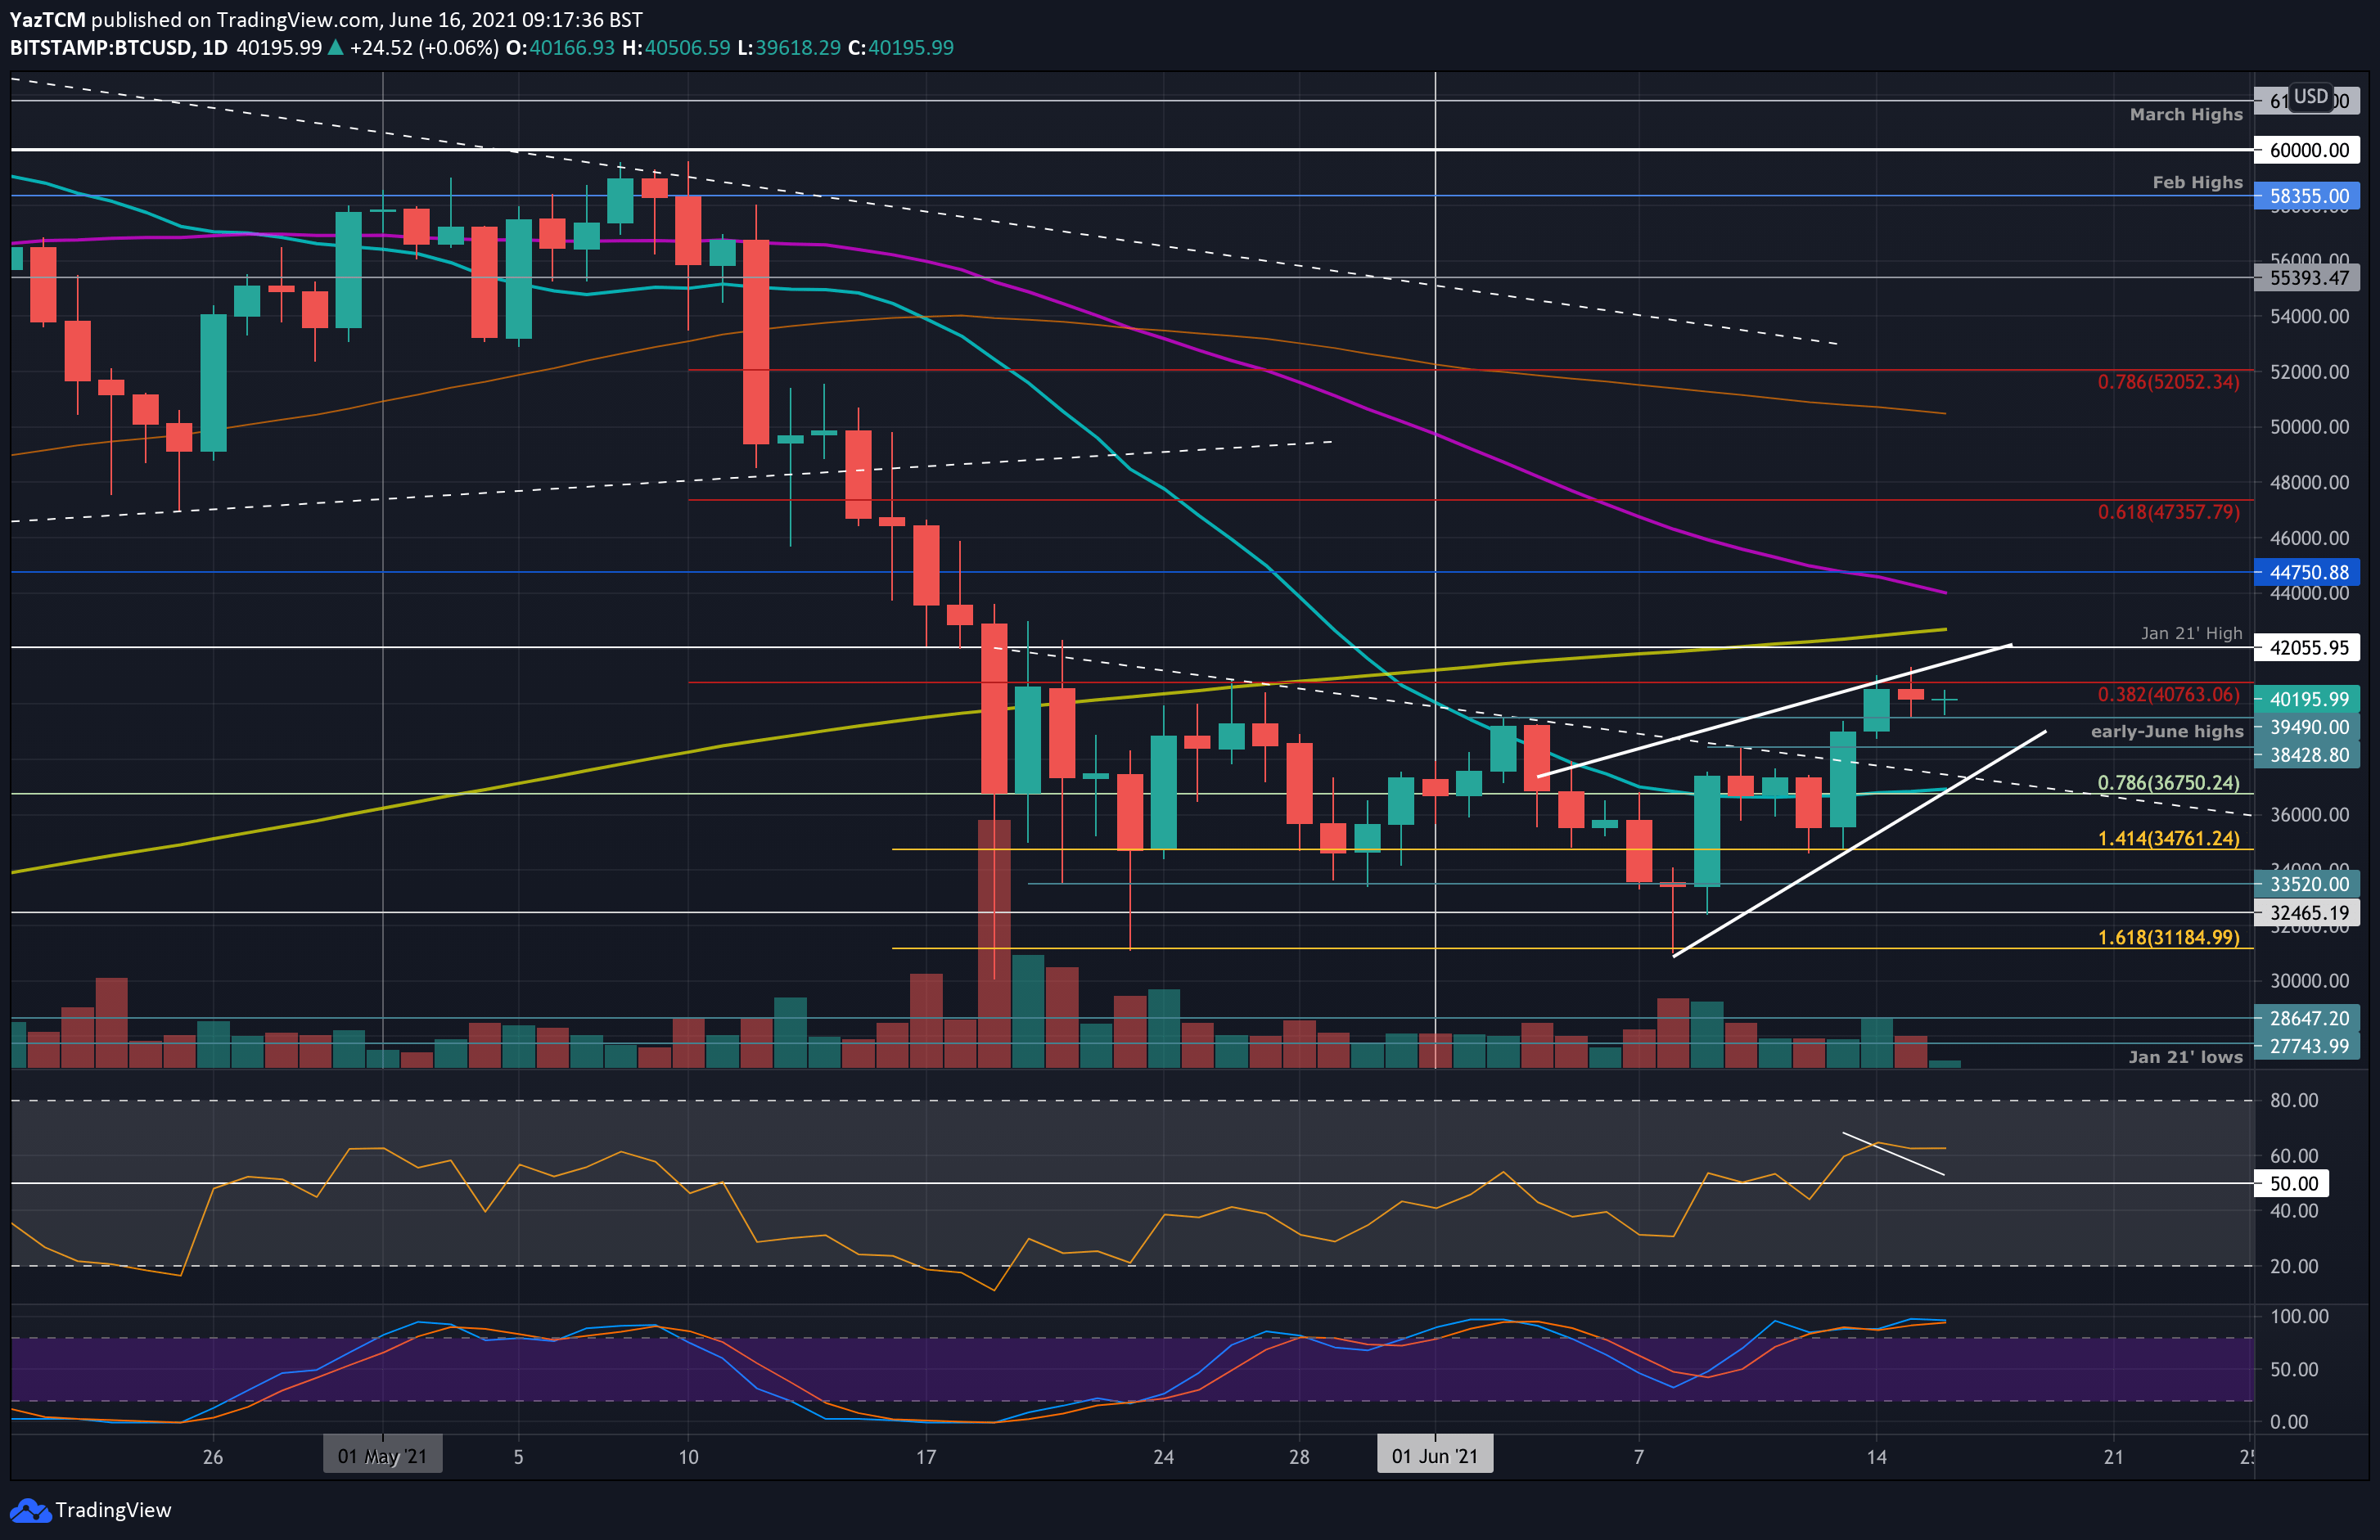
From the bullish side, there are small hints that BTC should push higher and finally break $40,760 soon as there is hidden bullish divergence on the 4-hour RSI, with the RSI making lower lows and price action making higher lows. Despite that, Bitcoin still marks $42K zone as the next major level of resistance, which includes previous January 2021 highs and the 200-days moving average line.
BTC Price Support and Resistance Levels to Watch
Key Support Levels: $40,000, $39,500, $38,430, $36,750, $34,760.
Key Resistance Levels: $40,760, $42,000, $42,720, $43,600 – $44,000, $44,750.
Looking ahead, if the buyers break resistance at $40,760 (bearish .382 Fib), the first resistance lies at $42,000 (Jan 2021 highs). This is followed by $42,720 (1.272 Fib Extension & 200-day MA), $43,600 (1.414 Fib Extension), $44,000 (50-day MA),and $44,750. Added resistance lies at $46,000 and $47,360 (bearish .618 Fib).
On the other side, the first major support lies at $40,000. This is followed by $39,500 (early-June highs), $38,430 (4-hour’s MA-200 line), $36,750 (.786 Fib & 20-day MA), and $34,760 (downside 1.414 Fib Extension).
As mentioned, the 4-hour RSI is showing hints of hidden bullish divergence. Additionally, the RSI is now showing the highest level of bullish momentum since mid-May 2021 – before the market crash. This suggests that the buyers might be starting the recovery.
Bitstamp BTC/USD Daily Chart
Bitstamp BTC/USD 4-Hour Chart