Bitcoin Bitcoin saw an impressive 20% price hike this week as it reached the K resistance level. The cryptocurrency penetrated above a descending wedge formation last Thursday and continued above the 20-day MA level last Friday. Since breaking the wedge, BTC surged higher inside an ascending price channel as it broke the 50-day MA level for the first time since May and continued to hit the k resistance. It did spike above K, reaching ,500 (bearish .382 Fib) but was unable to close a daily candle above the coveted level. The resistance there is further bolstered by the 100-day MA. Since then, BTC rolled over and broke beneath ,000 today. As a result, BTC is now trading below the ascending price channel. Looking ahead, if the sellers push lower, the first
Topics:
Yaz Sheikh considers the following as important: Binance Coin (BNB) Price, Bitcoin (BTC) Price, BNBBTC, bnbusd, BTCEUR, BTCGBP, btcusd, btcusdt, ETH Analysis, ETHBTC, Ethereum (ETH) Price, ethusd, Price Analysis, Ripple (XRP) Price, Solana (SOL) Price, XRP Analysis, xrpbtc, xrpusd
This could be interesting, too:
Chayanika Deka writes XRP, SOL, and ADA Inclusion in US Crypto Reserve Pushes Traders on Edge
Chayanika Deka writes Why Arthur Hayes Is Bullish on Bitcoin Under Trump’s Economic Strategy
Mandy Williams writes Why the Bitcoin Market Is Stuck—and the Key Metric That Could Change It: CryptoQuant CEO
Wayne Jones writes Metaplanet Acquires 156 BTC, Bringing Total Holdings to 2,391
Bitcoin
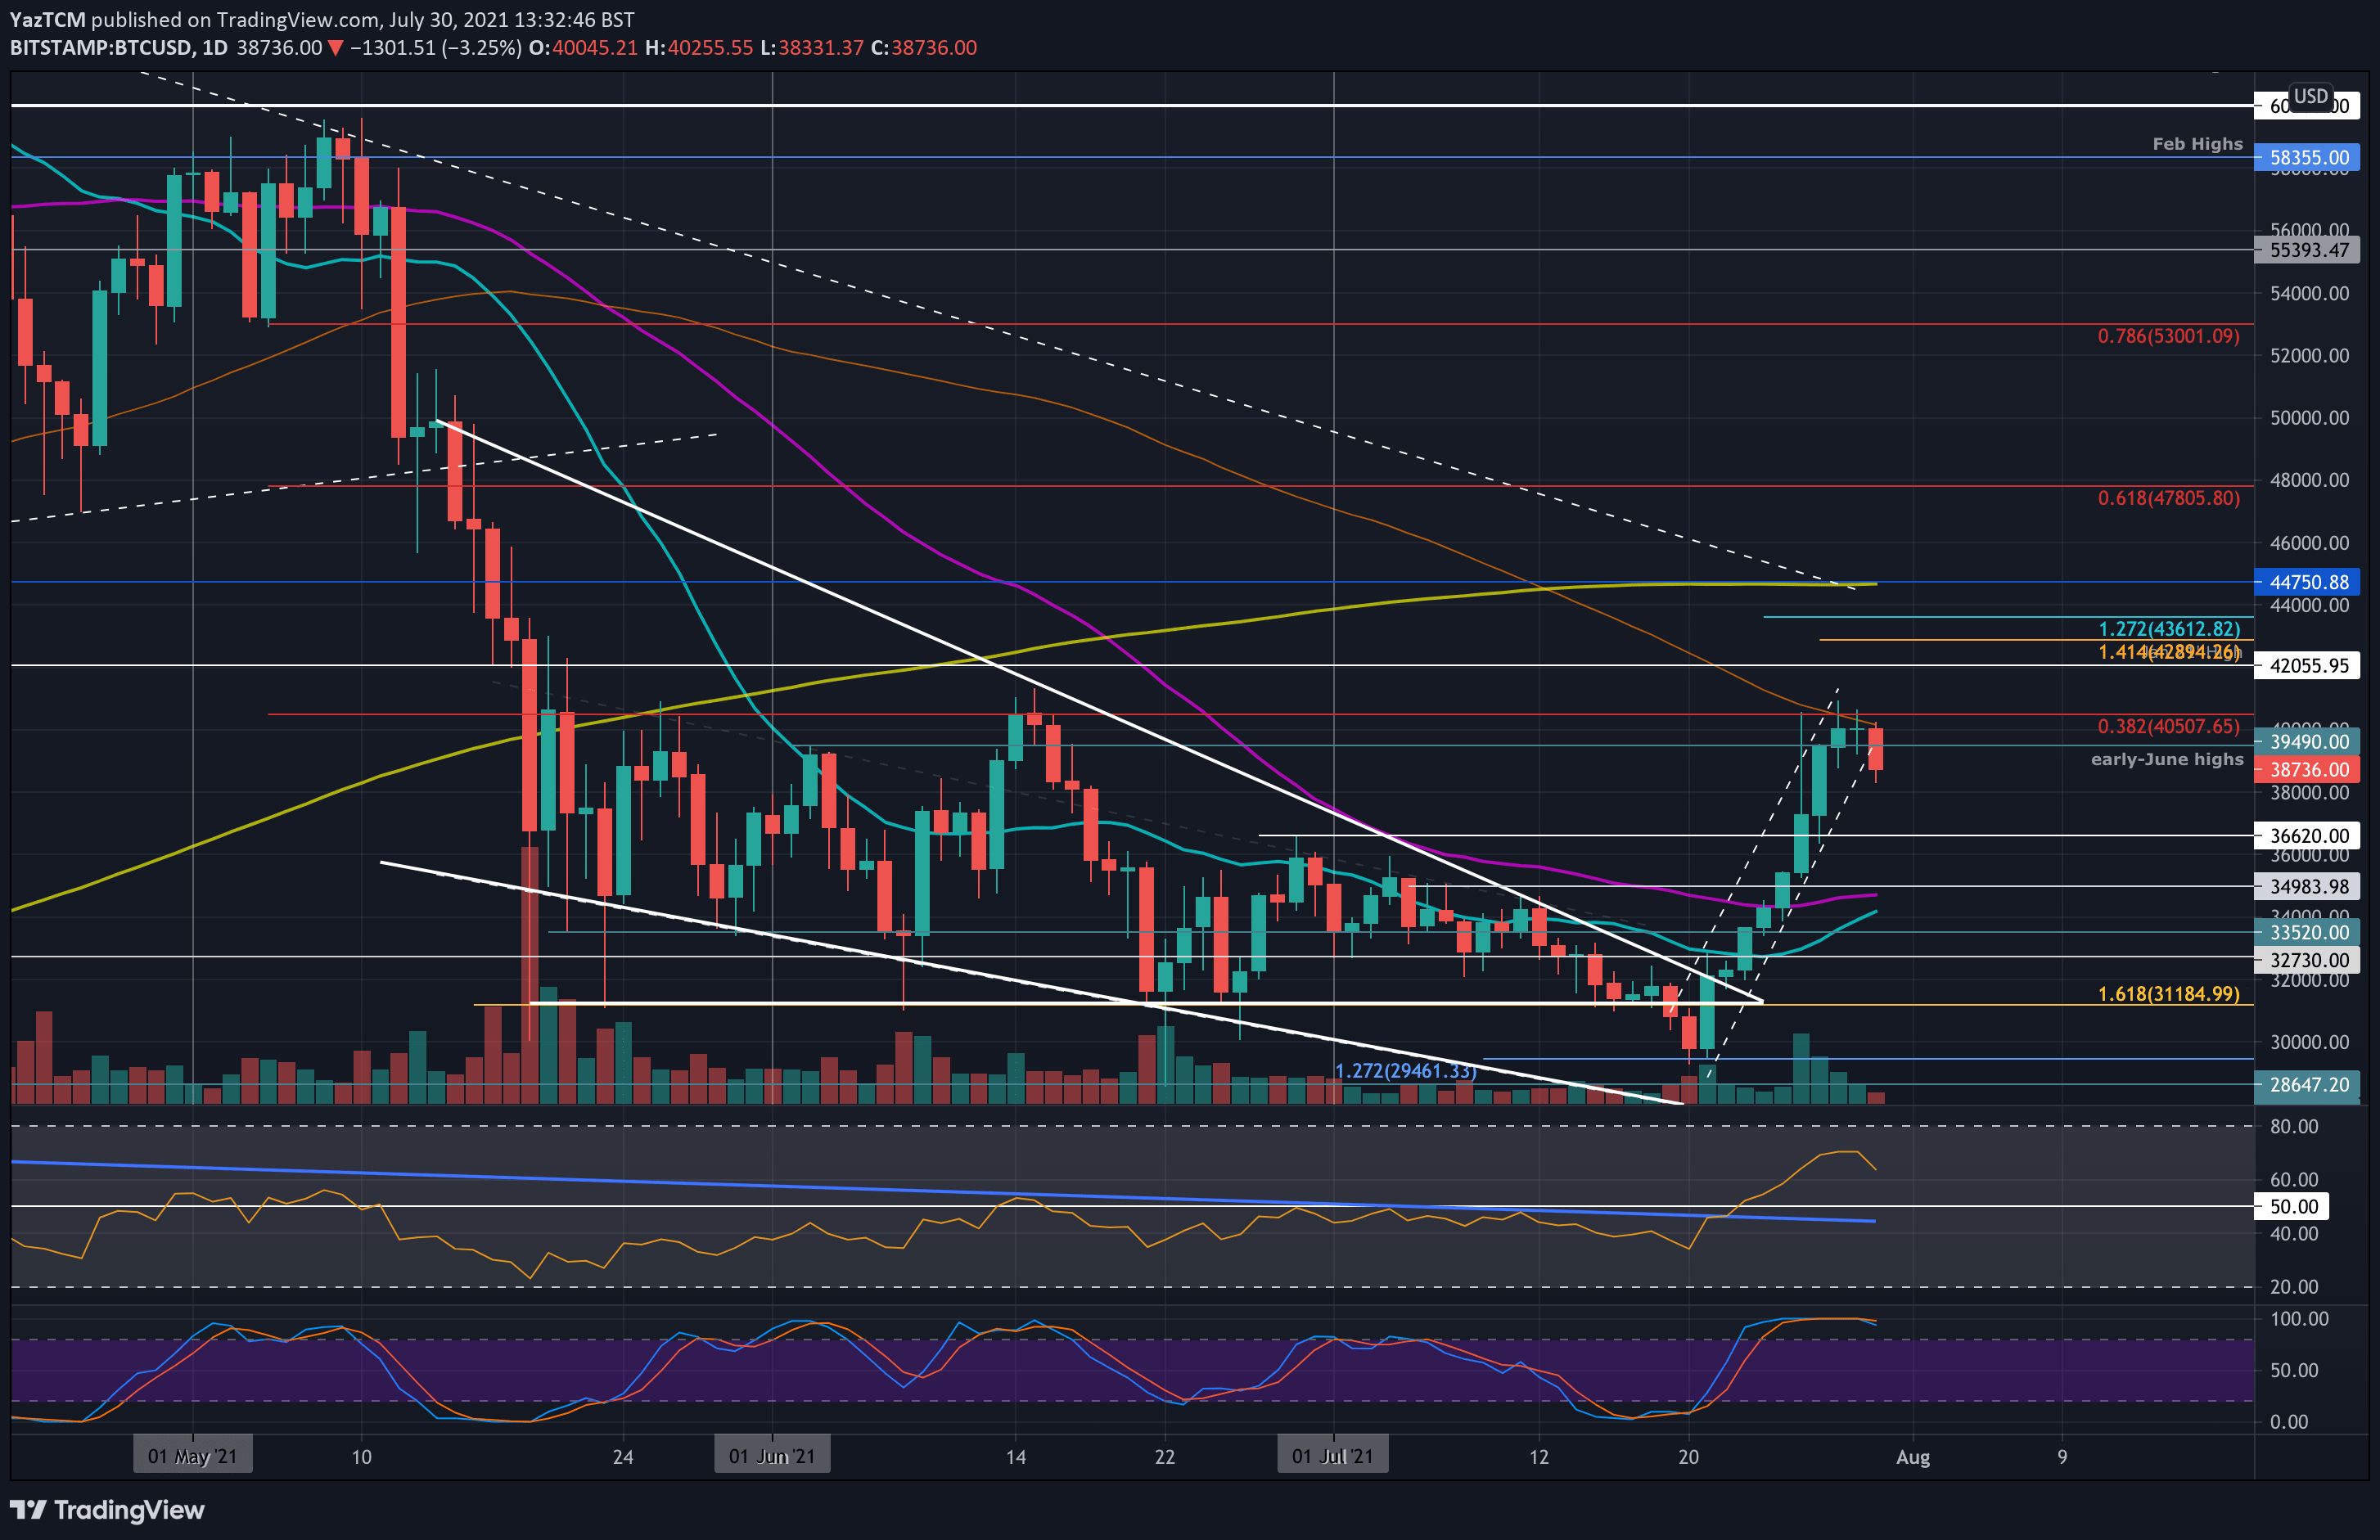
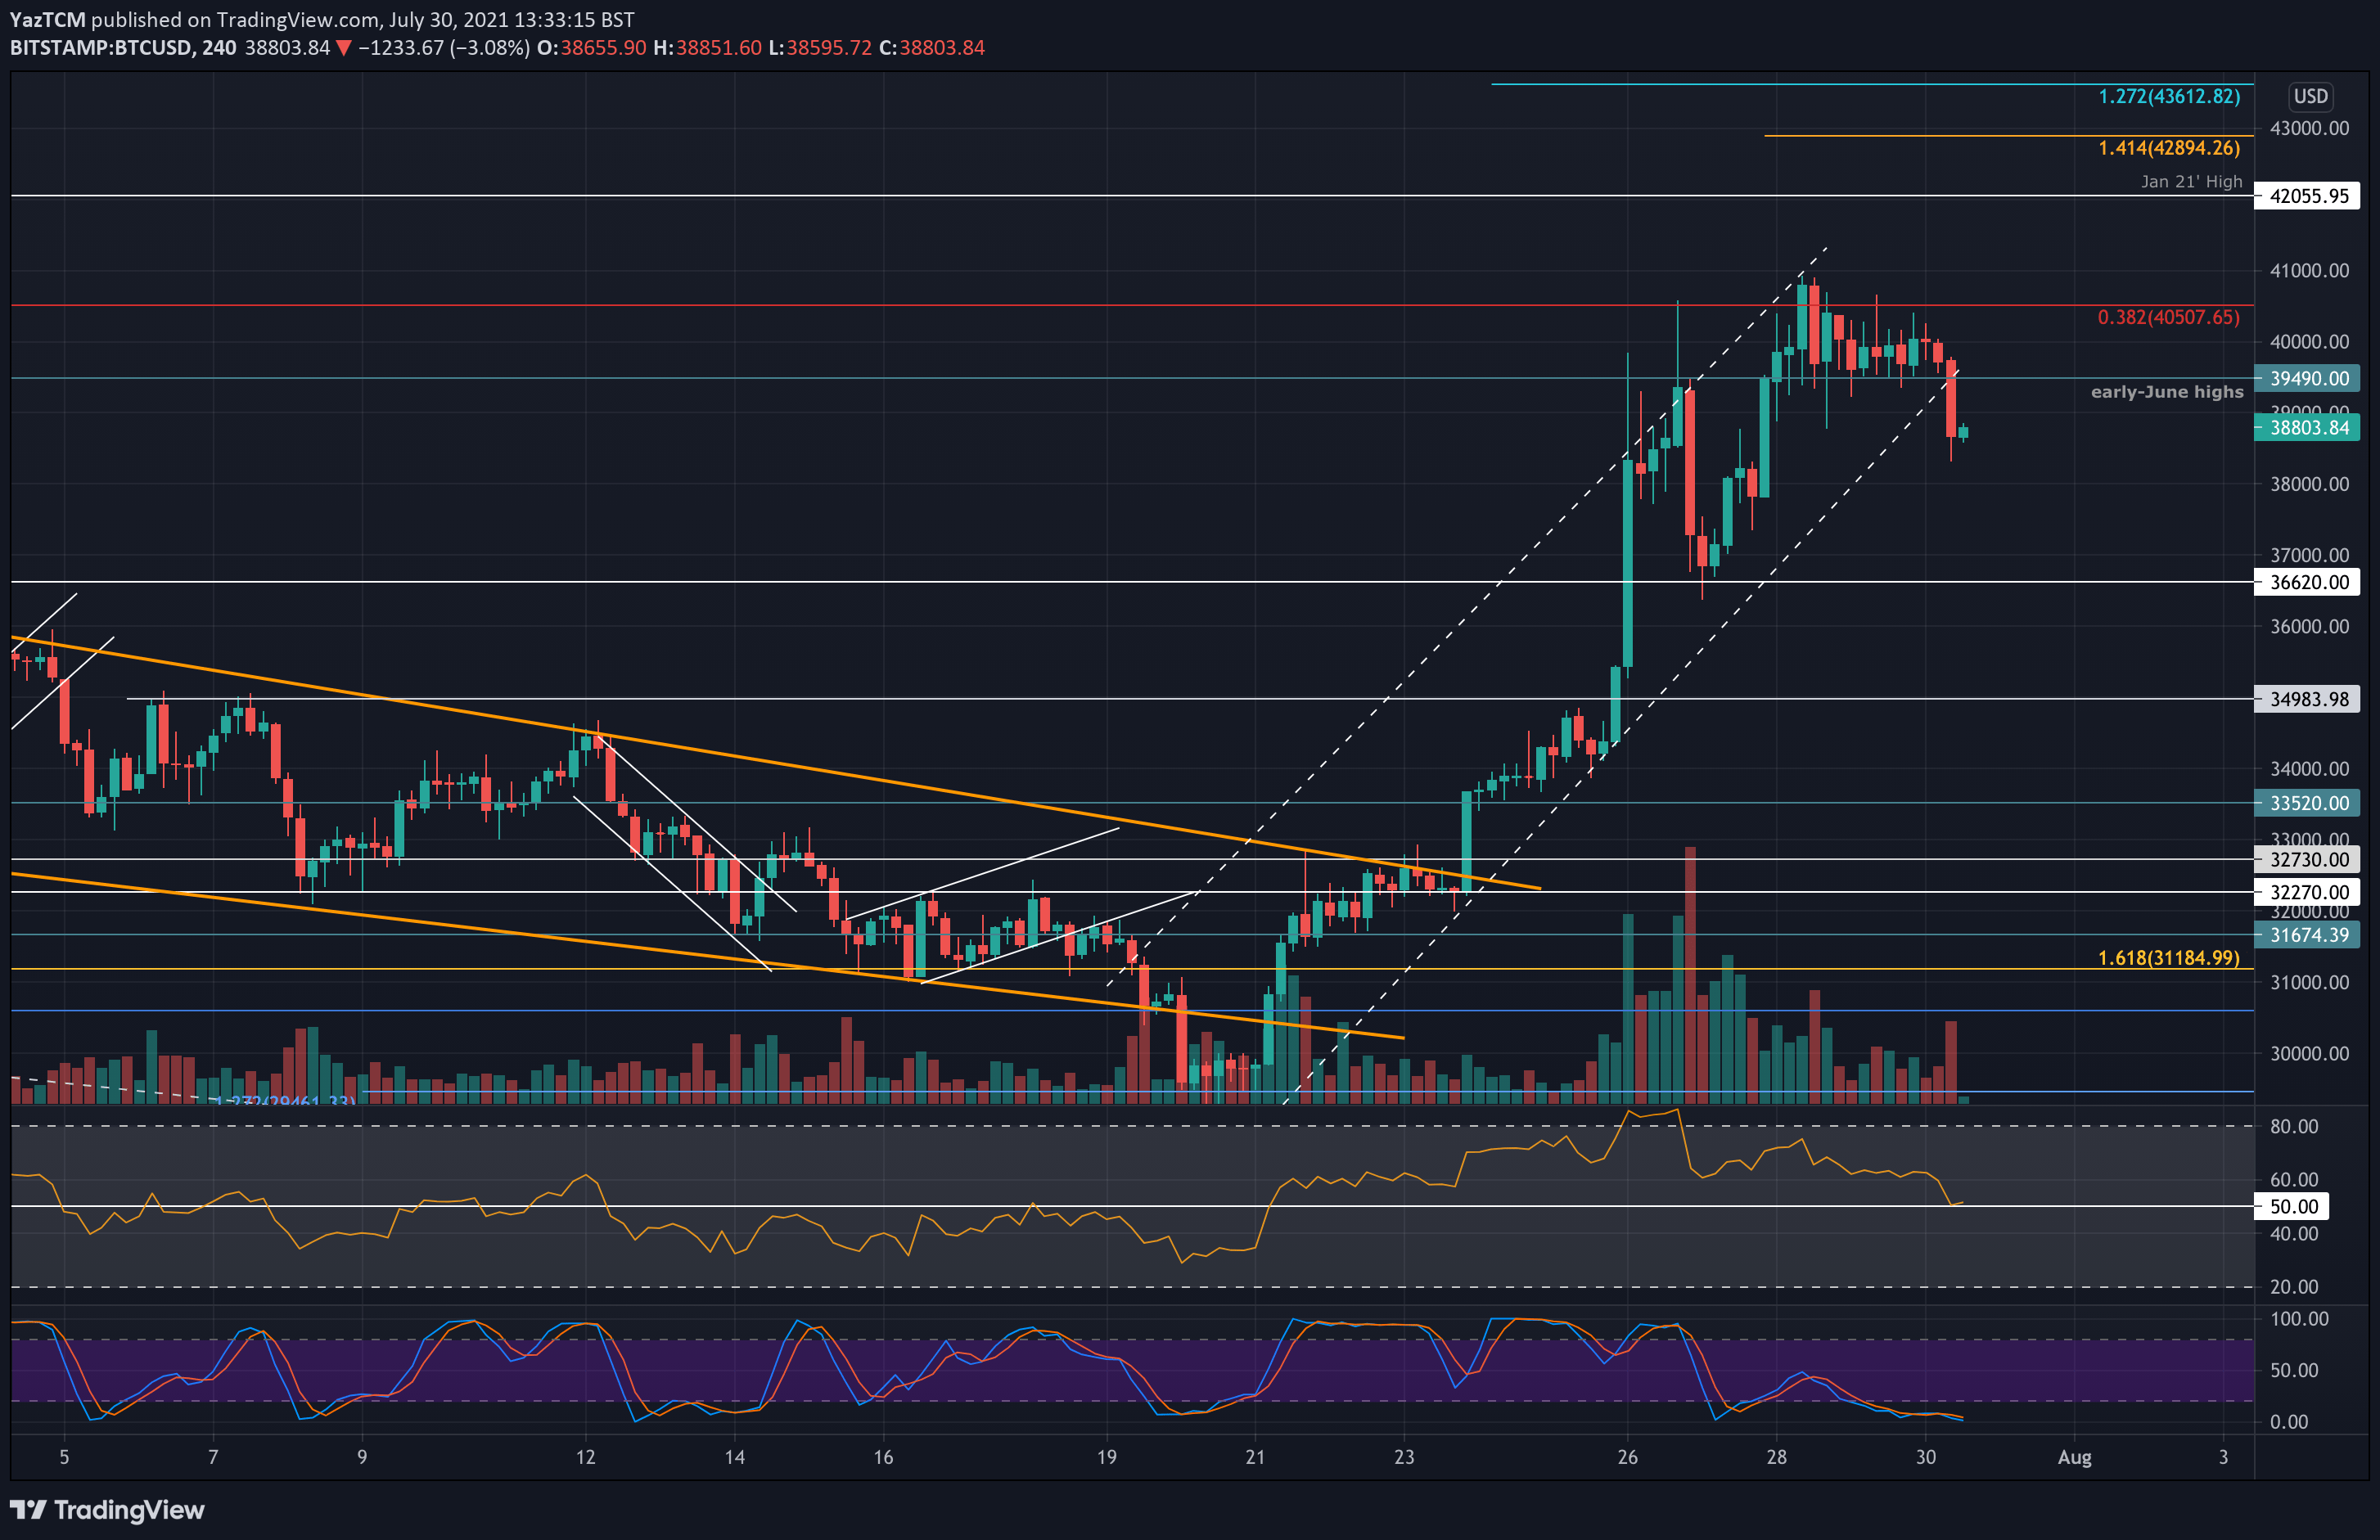
Bitcoin saw an impressive 20% price hike this week as it reached the $40K resistance level. The cryptocurrency penetrated above a descending wedge formation last Thursday and continued above the 20-day MA level last Friday.
Since breaking the wedge, BTC surged higher inside an ascending price channel as it broke the 50-day MA level for the first time since May and continued to hit the $40k resistance. It did spike above $40K, reaching $40,500 (bearish .382 Fib) but was unable to close a daily candle above the coveted level. The resistance there is further bolstered by the 100-day MA.
Since then, BTC rolled over and broke beneath $39,000 today. As a result, BTC is now trading below the ascending price channel.
Looking ahead, if the sellers push lower, the first support lies at $38,000. This is followed by $37,000, $36,620, $35,000, $34,710 (50-day MA), $34,000 (20-day MA), and $33,520.
On the other side, the first resistance lies at $39,500. This is followed by $40,000 (100-day MA), $40,500 (bearish .382 Fib), $42,000 (January 2021 highs), and $44,750 (200-day MA).
Ethereum
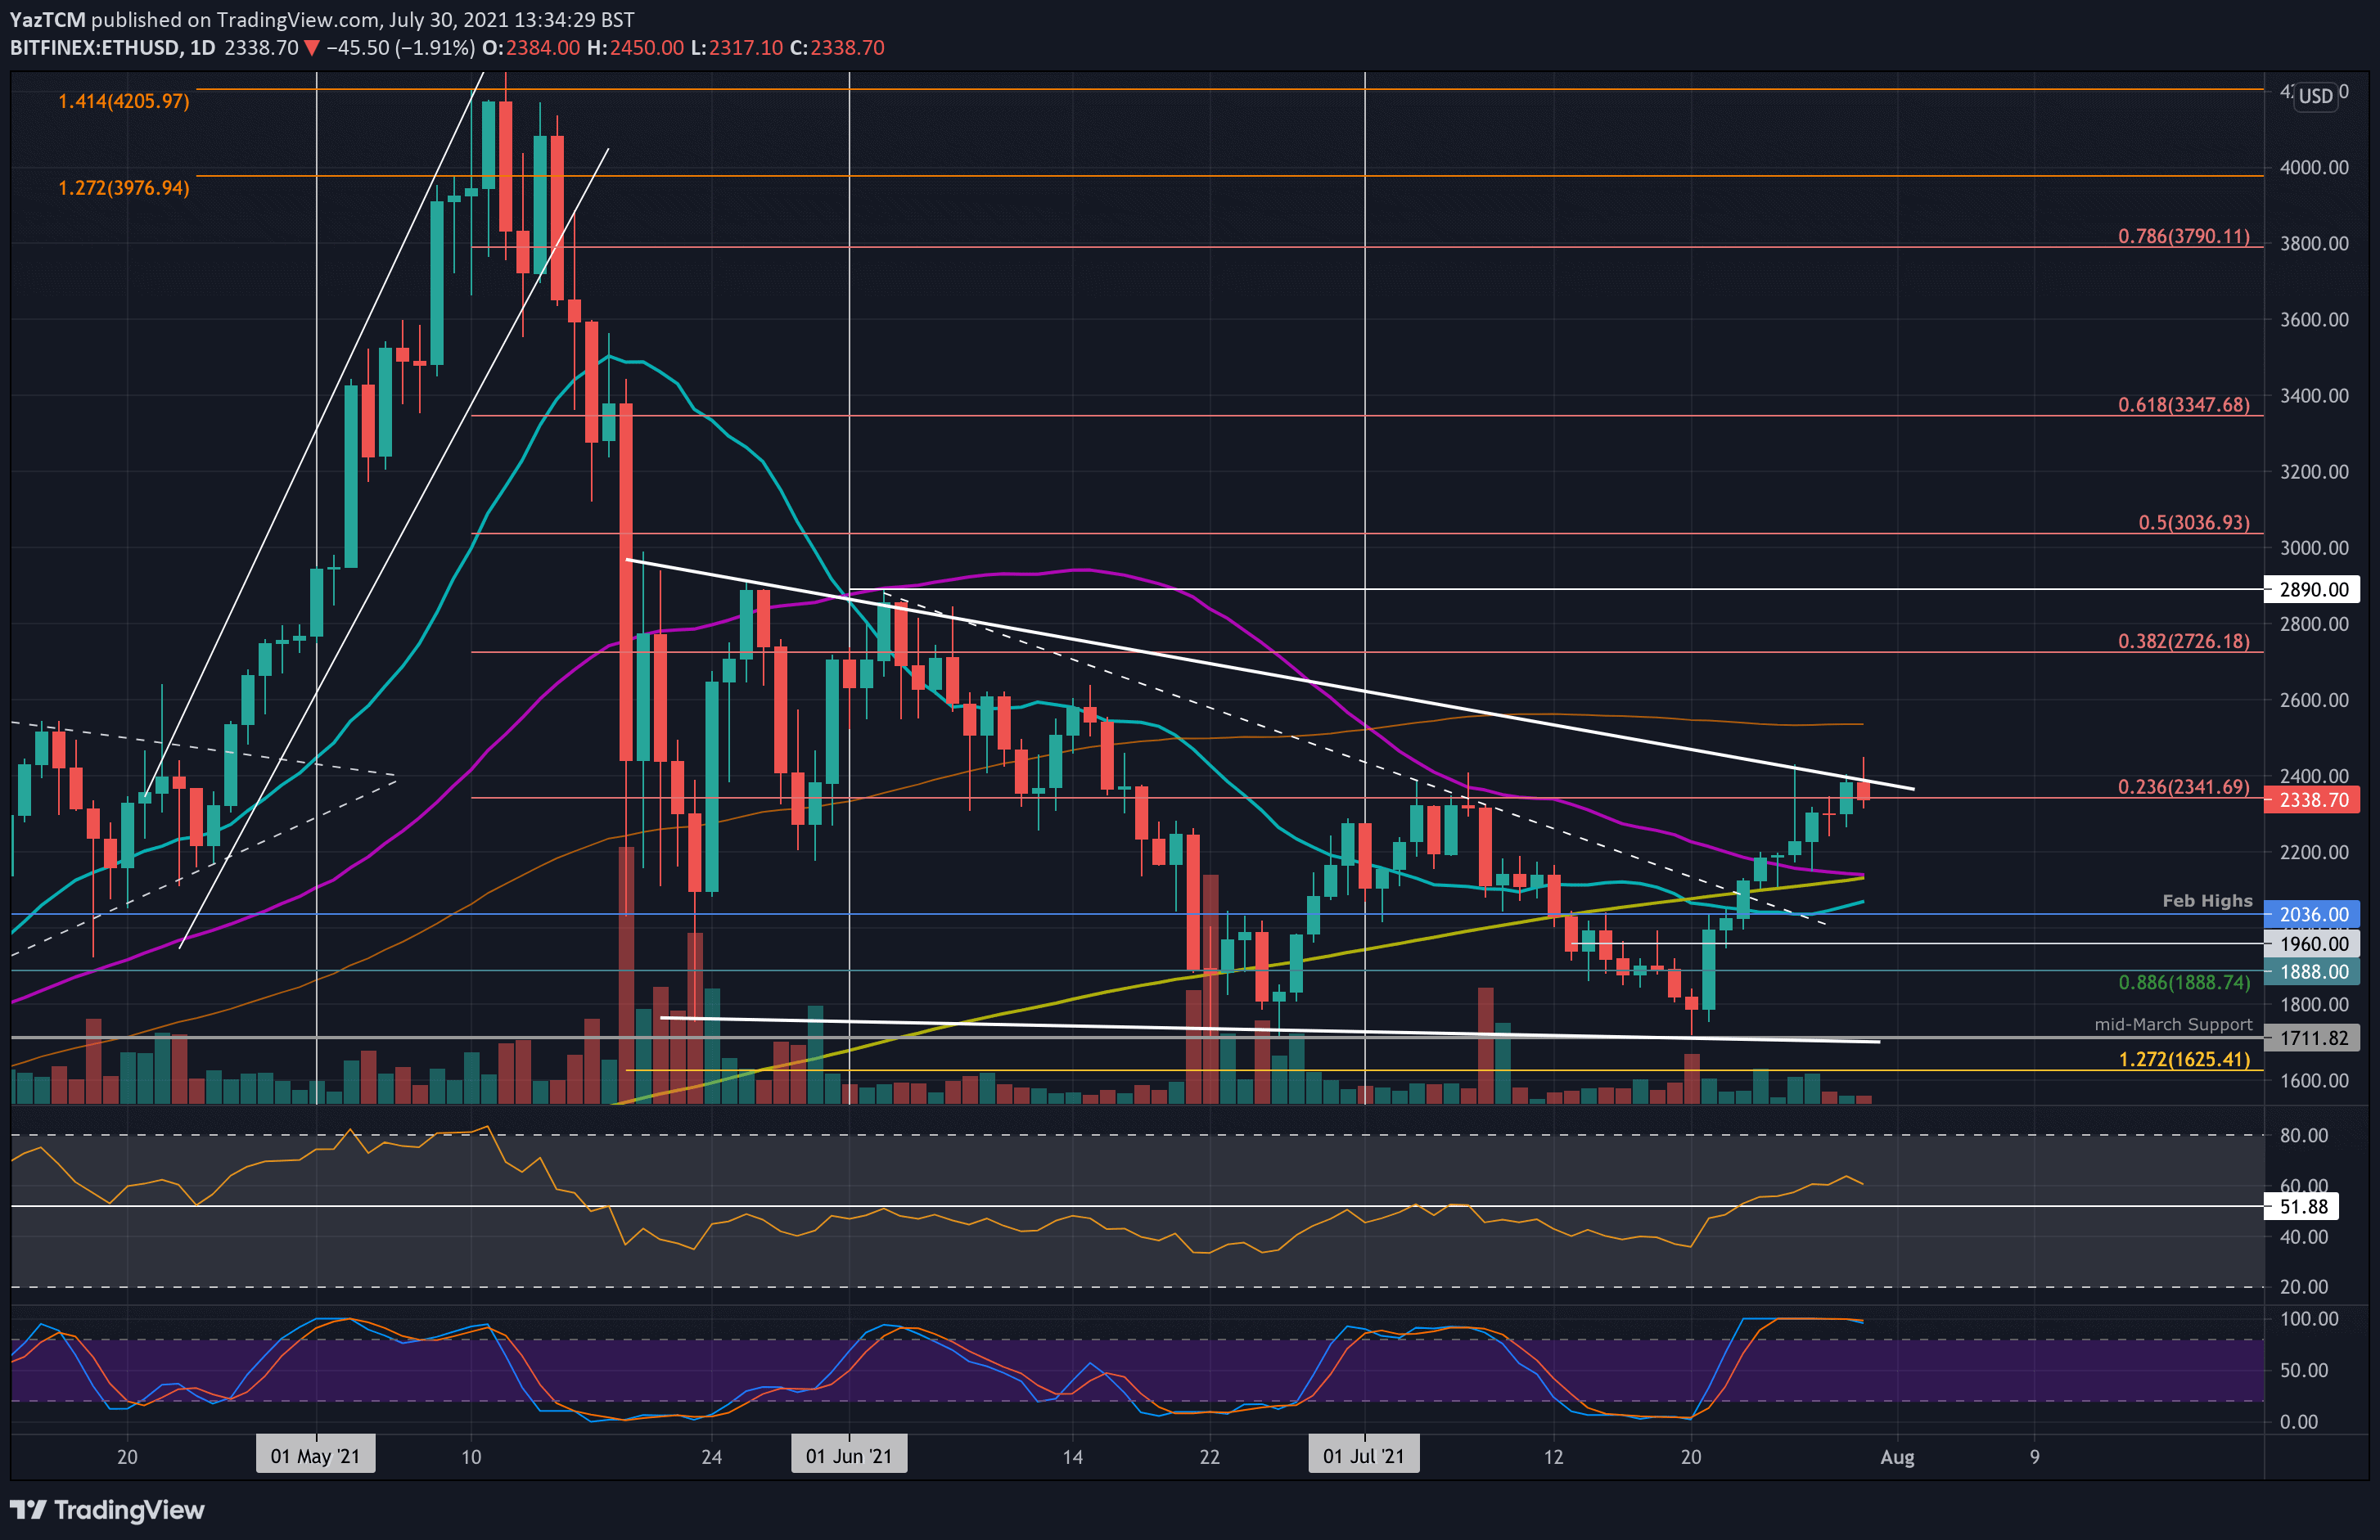
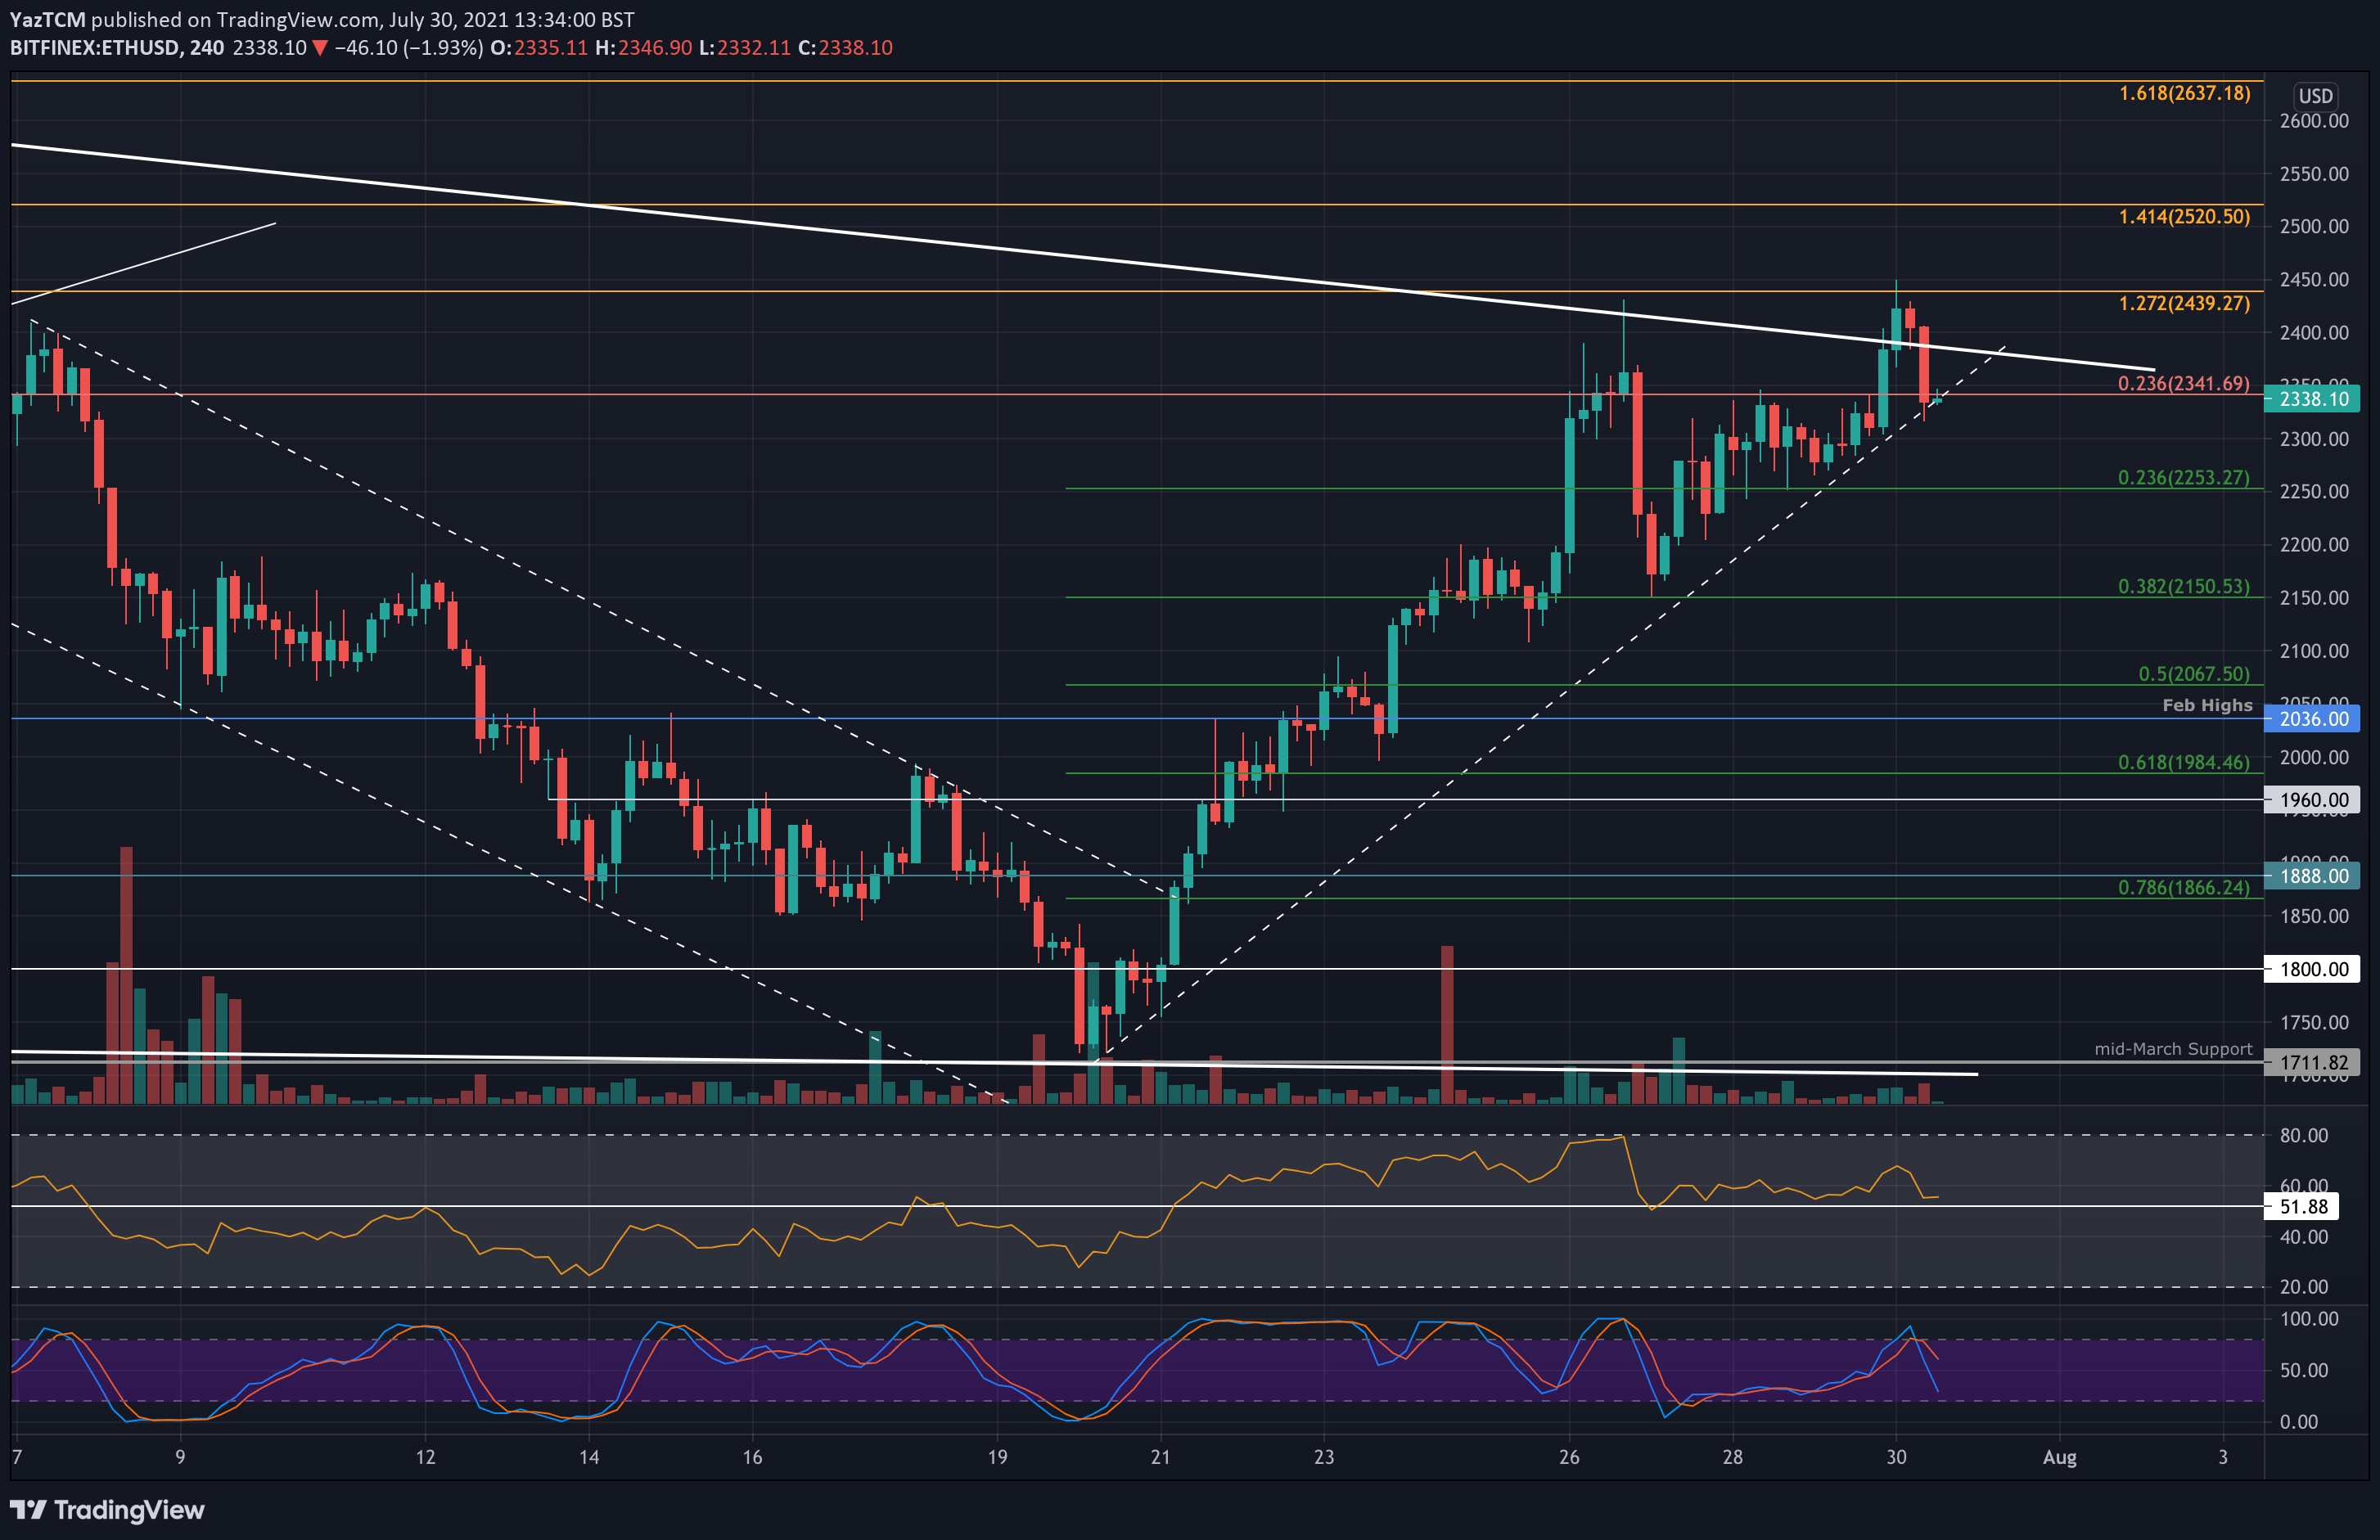
Ethereum witnessed a 15.1% price hike this week as it reached as high as $2450. It penetrated the 200-day MA last Friday as it broke back above $2000. From there, ETH continued above the 50-day MA and pushed higher to reach the resistance at $2400.
There, ETH struggled to close a daily candle above a falling trend line that dates back to mid-May. As a result, ETH has now rolled over and is currently trading at the support provided by a short-term rising trend line, seen on the 4-hour chart.
Looking ahead, if the sellers break the trend line, the first support lies at $2300. This is followed by $2250 (.236 Fib), $2200, $2150 (.382 Fib, 200-day MA & 50-day MA), $2070 (.5 Fib), and $2000.
On the other side, the first resistance lies around $2400 (the falling trend line). Above this, resistance is expected at $2440 (1.272 Fib Extension), $2530 (1.414 Fib Extension & 100-day MA), $2600, and $2726 (bearish .382 Fib Retracement).
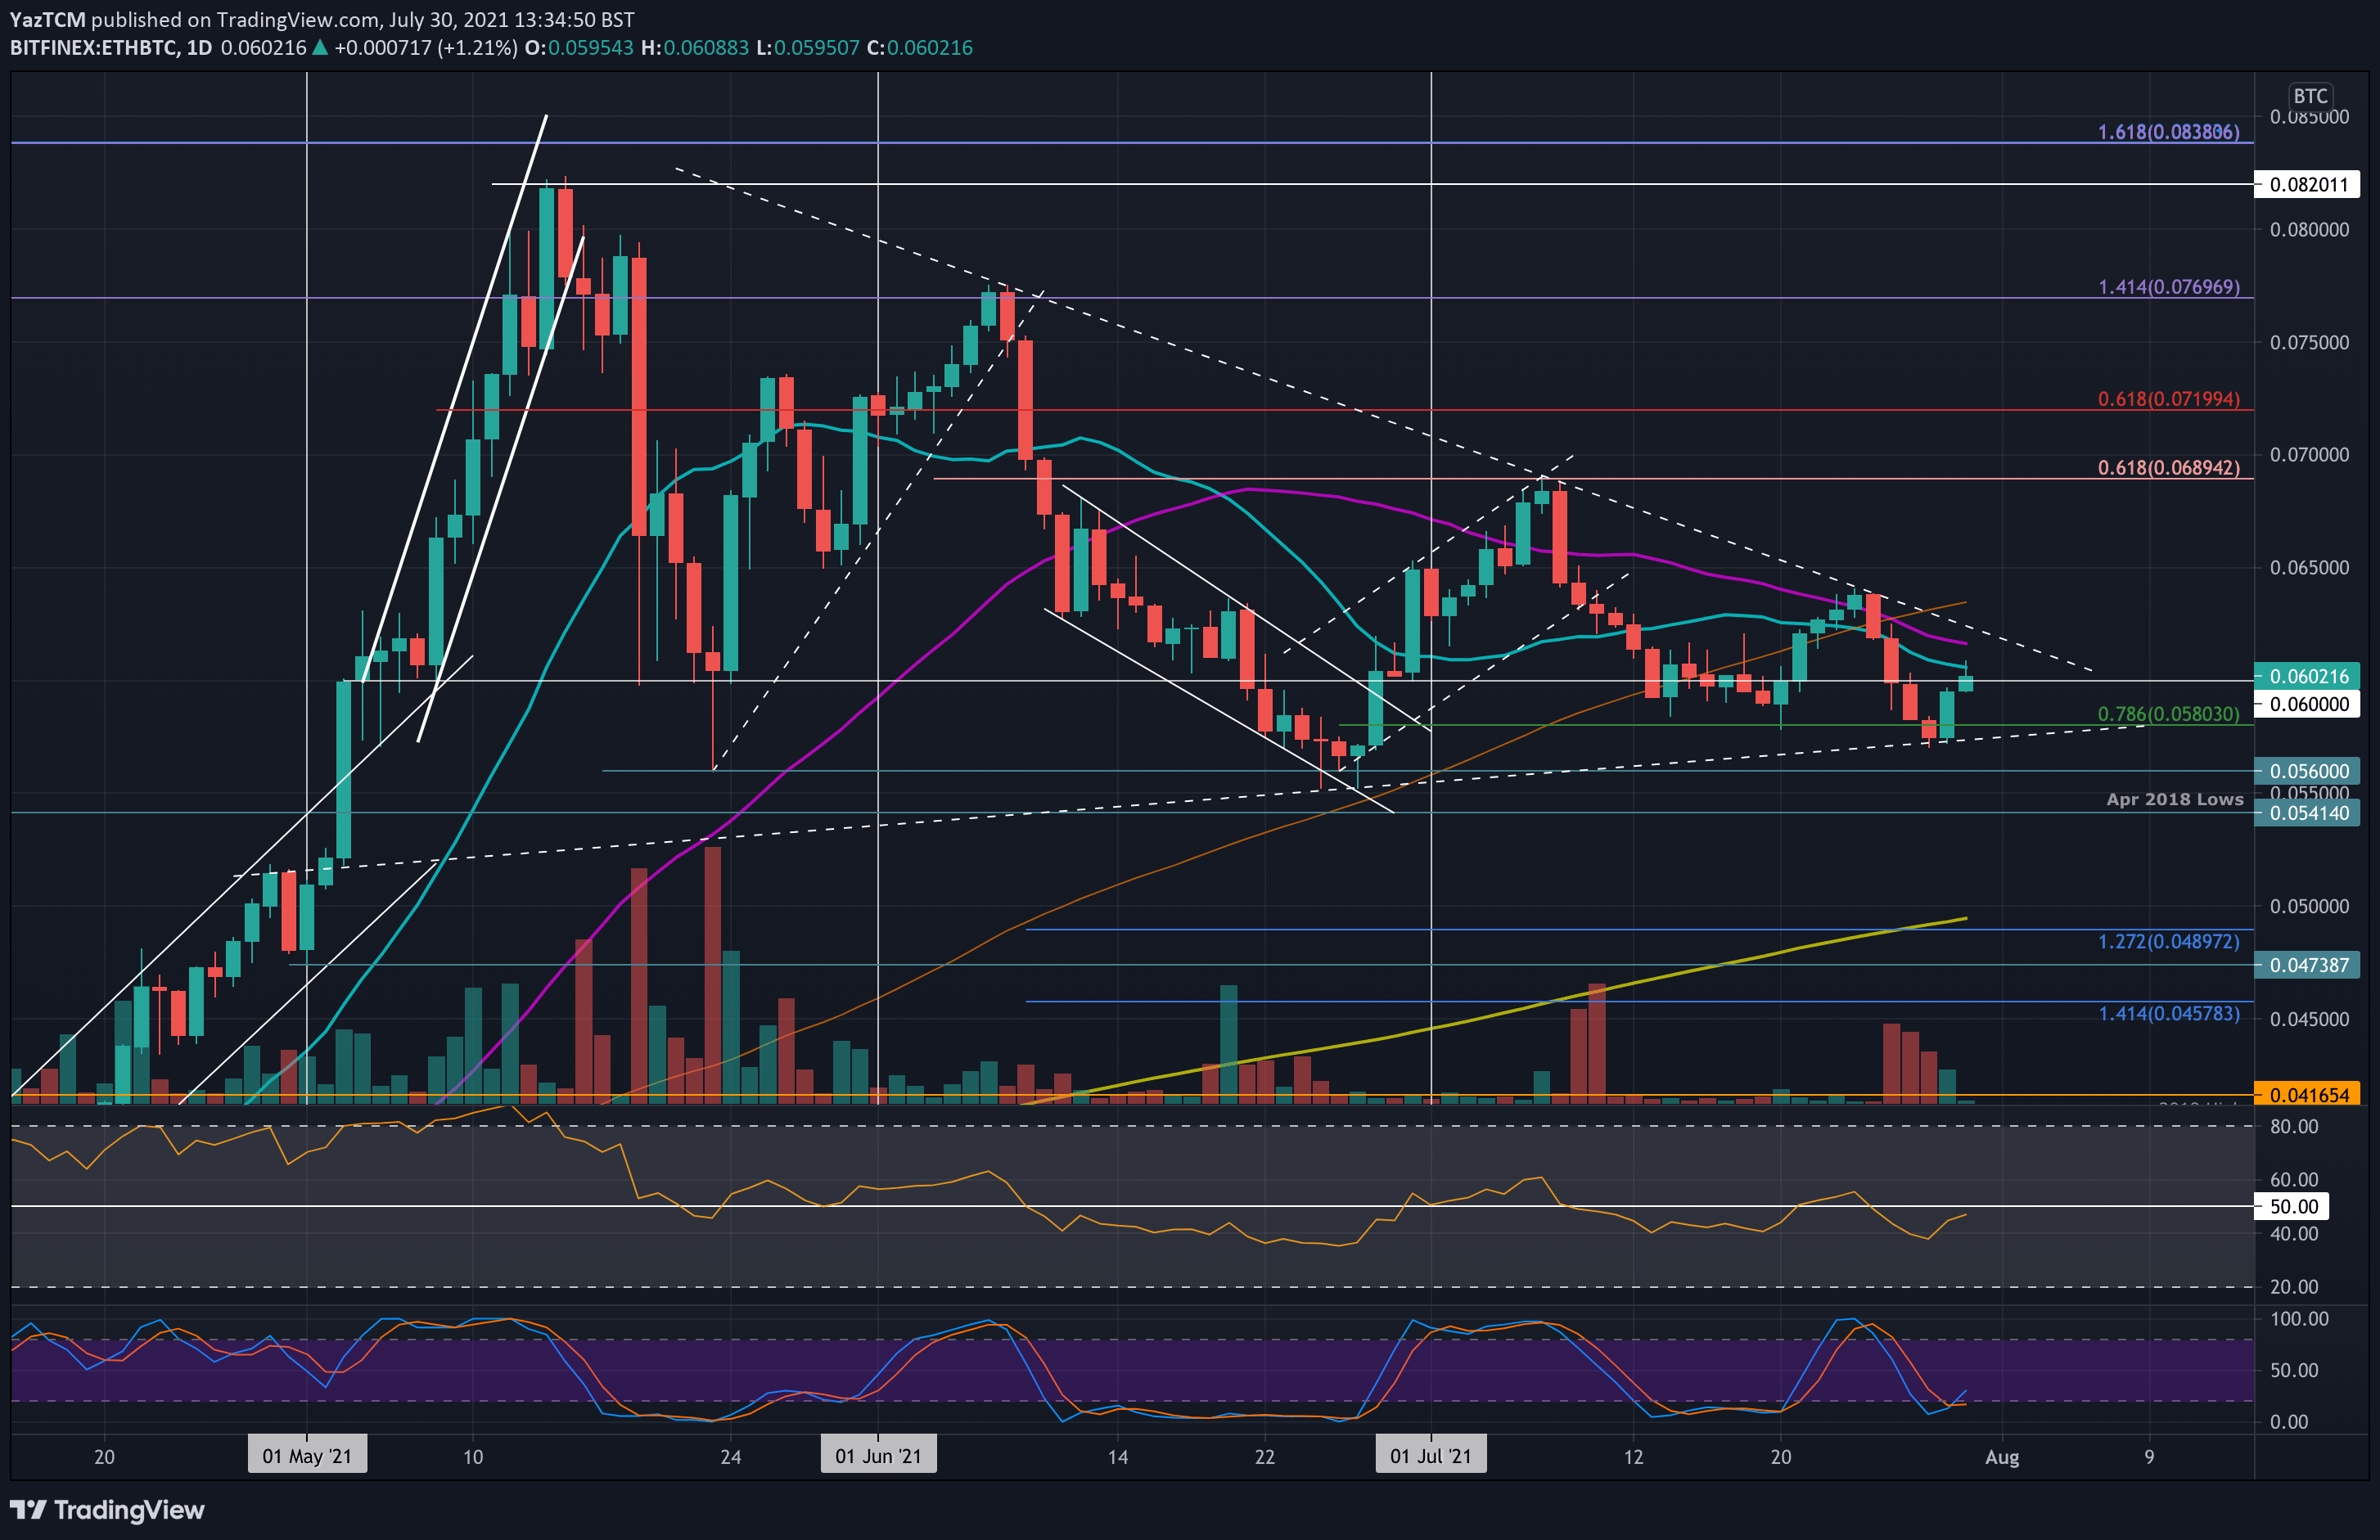
Against BTC, ETH continues its consolidation inside a symmetrical triangle formation. The coin hit resistance at the upper angle of the triangle last Friday and dropped lower from there until finding support at the lower angle on Wednesday at 0.0573 BTC.
It has since rebounded from there and is now testing the 20-day MA level above 0.06 BTC. A breakout is likely soon as the market is quickly approaching the apex of the triangle.
Looking ahead, if the bulls break above the 20-day MA, the first resistance lies between 0.0616 BTC and 0.062 BTC – the 50-day MA and the upper angle of the triangle. Above the triangle, resistance lies at 0.064 BTC (100-day MA), 0.069 BTC (bearish .618 Fib & July highs), and 0.072 BTC.
On the other side, the first support lies at 0.06 BTC. This is followed by 0.058 BTC (.786 Fib & lower angle of the triangle), 0.056 BTC, and 0.0541 BTC. Finally, added support lies at 0.05 BTC (200-day MA).
Ripple
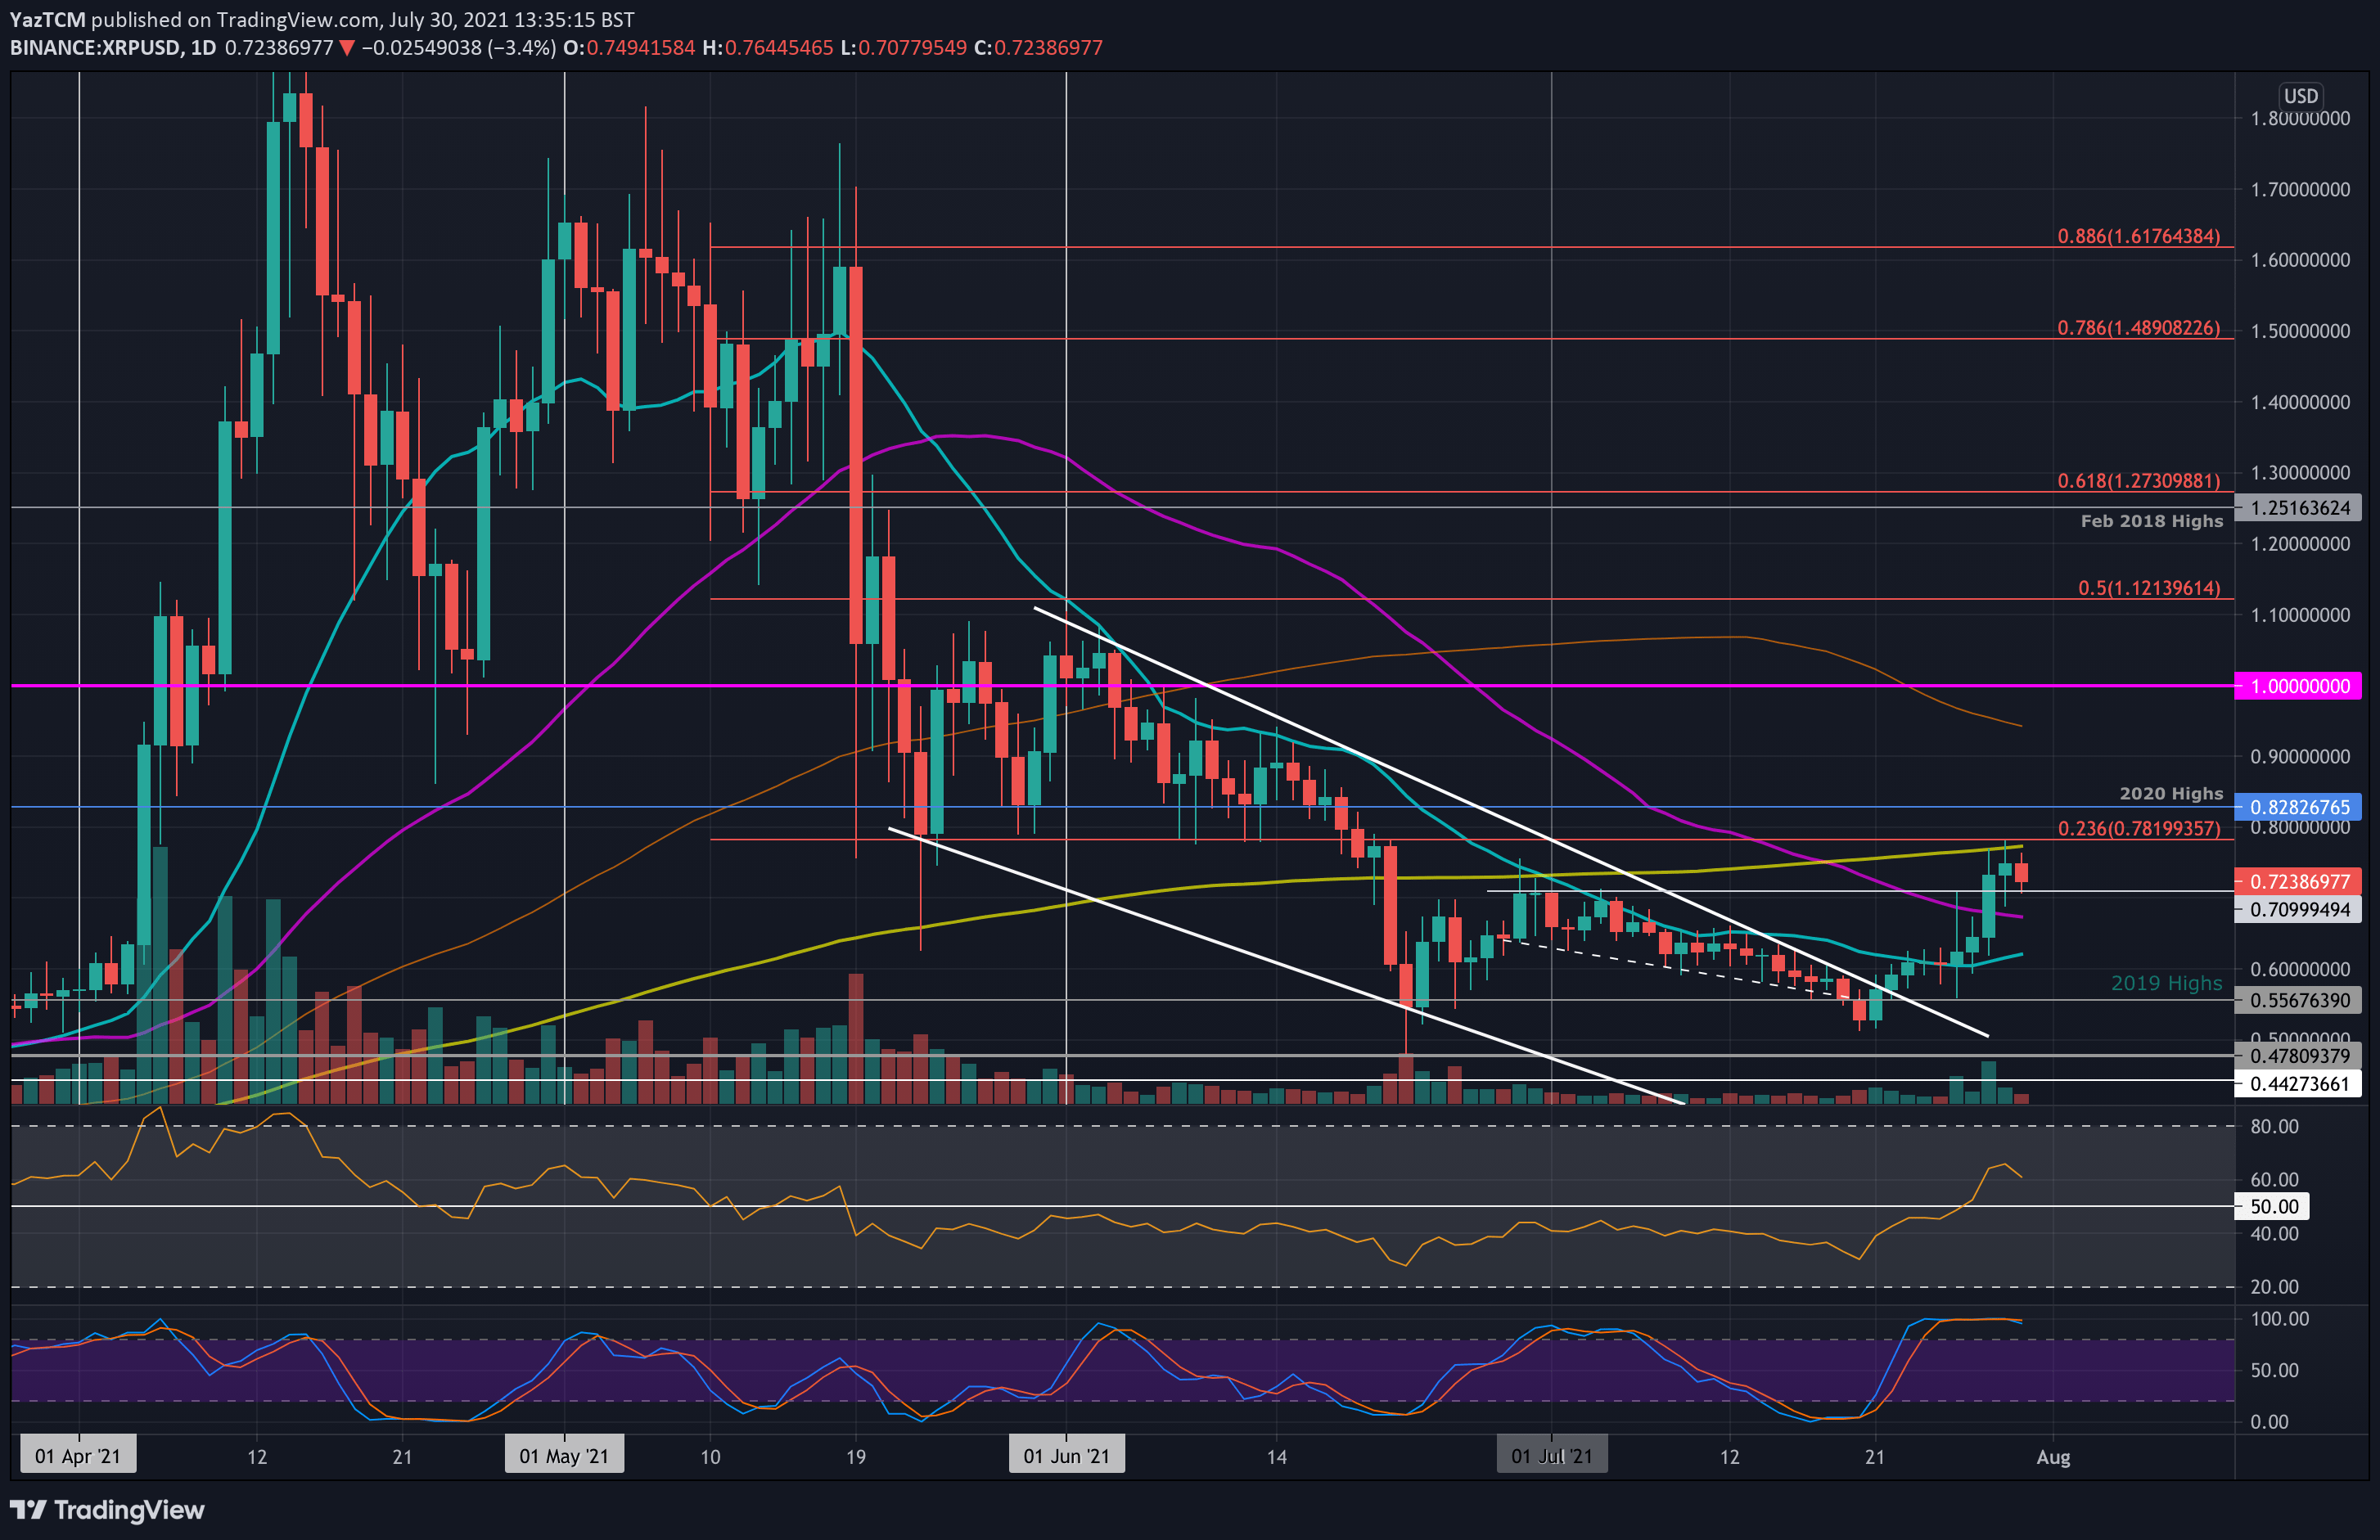
XRP is up by a solid 21.5% this week, making it the strongest performer in the top 10. It broke above the 20-day MA at $0.6 on Monday and had been surging higher ever since. It went on to break the 50-day MA on Wednesday as it climbed above the $0.7 level.
Yesterday, XRP spiked as high as $0.782 (bearish .236 Fib) but could not overcome this level. In addition, the 200-day MA further bolstered the resistance here. As a result, XRP rolled over today and is now trading around $0.72.
Looking ahead, the first support lies at $0.7. This is followed by $0.673 (50-day MA), $0.62 (20-day MA), $0.6, and $0.556.
On the other side, the first resistance is located at $0.78 (bearish .236 Fib & 200-day MA). This is followed by $0.8282 (2020 high), $0.9, $0.95 (100-day MA), and $1.00.
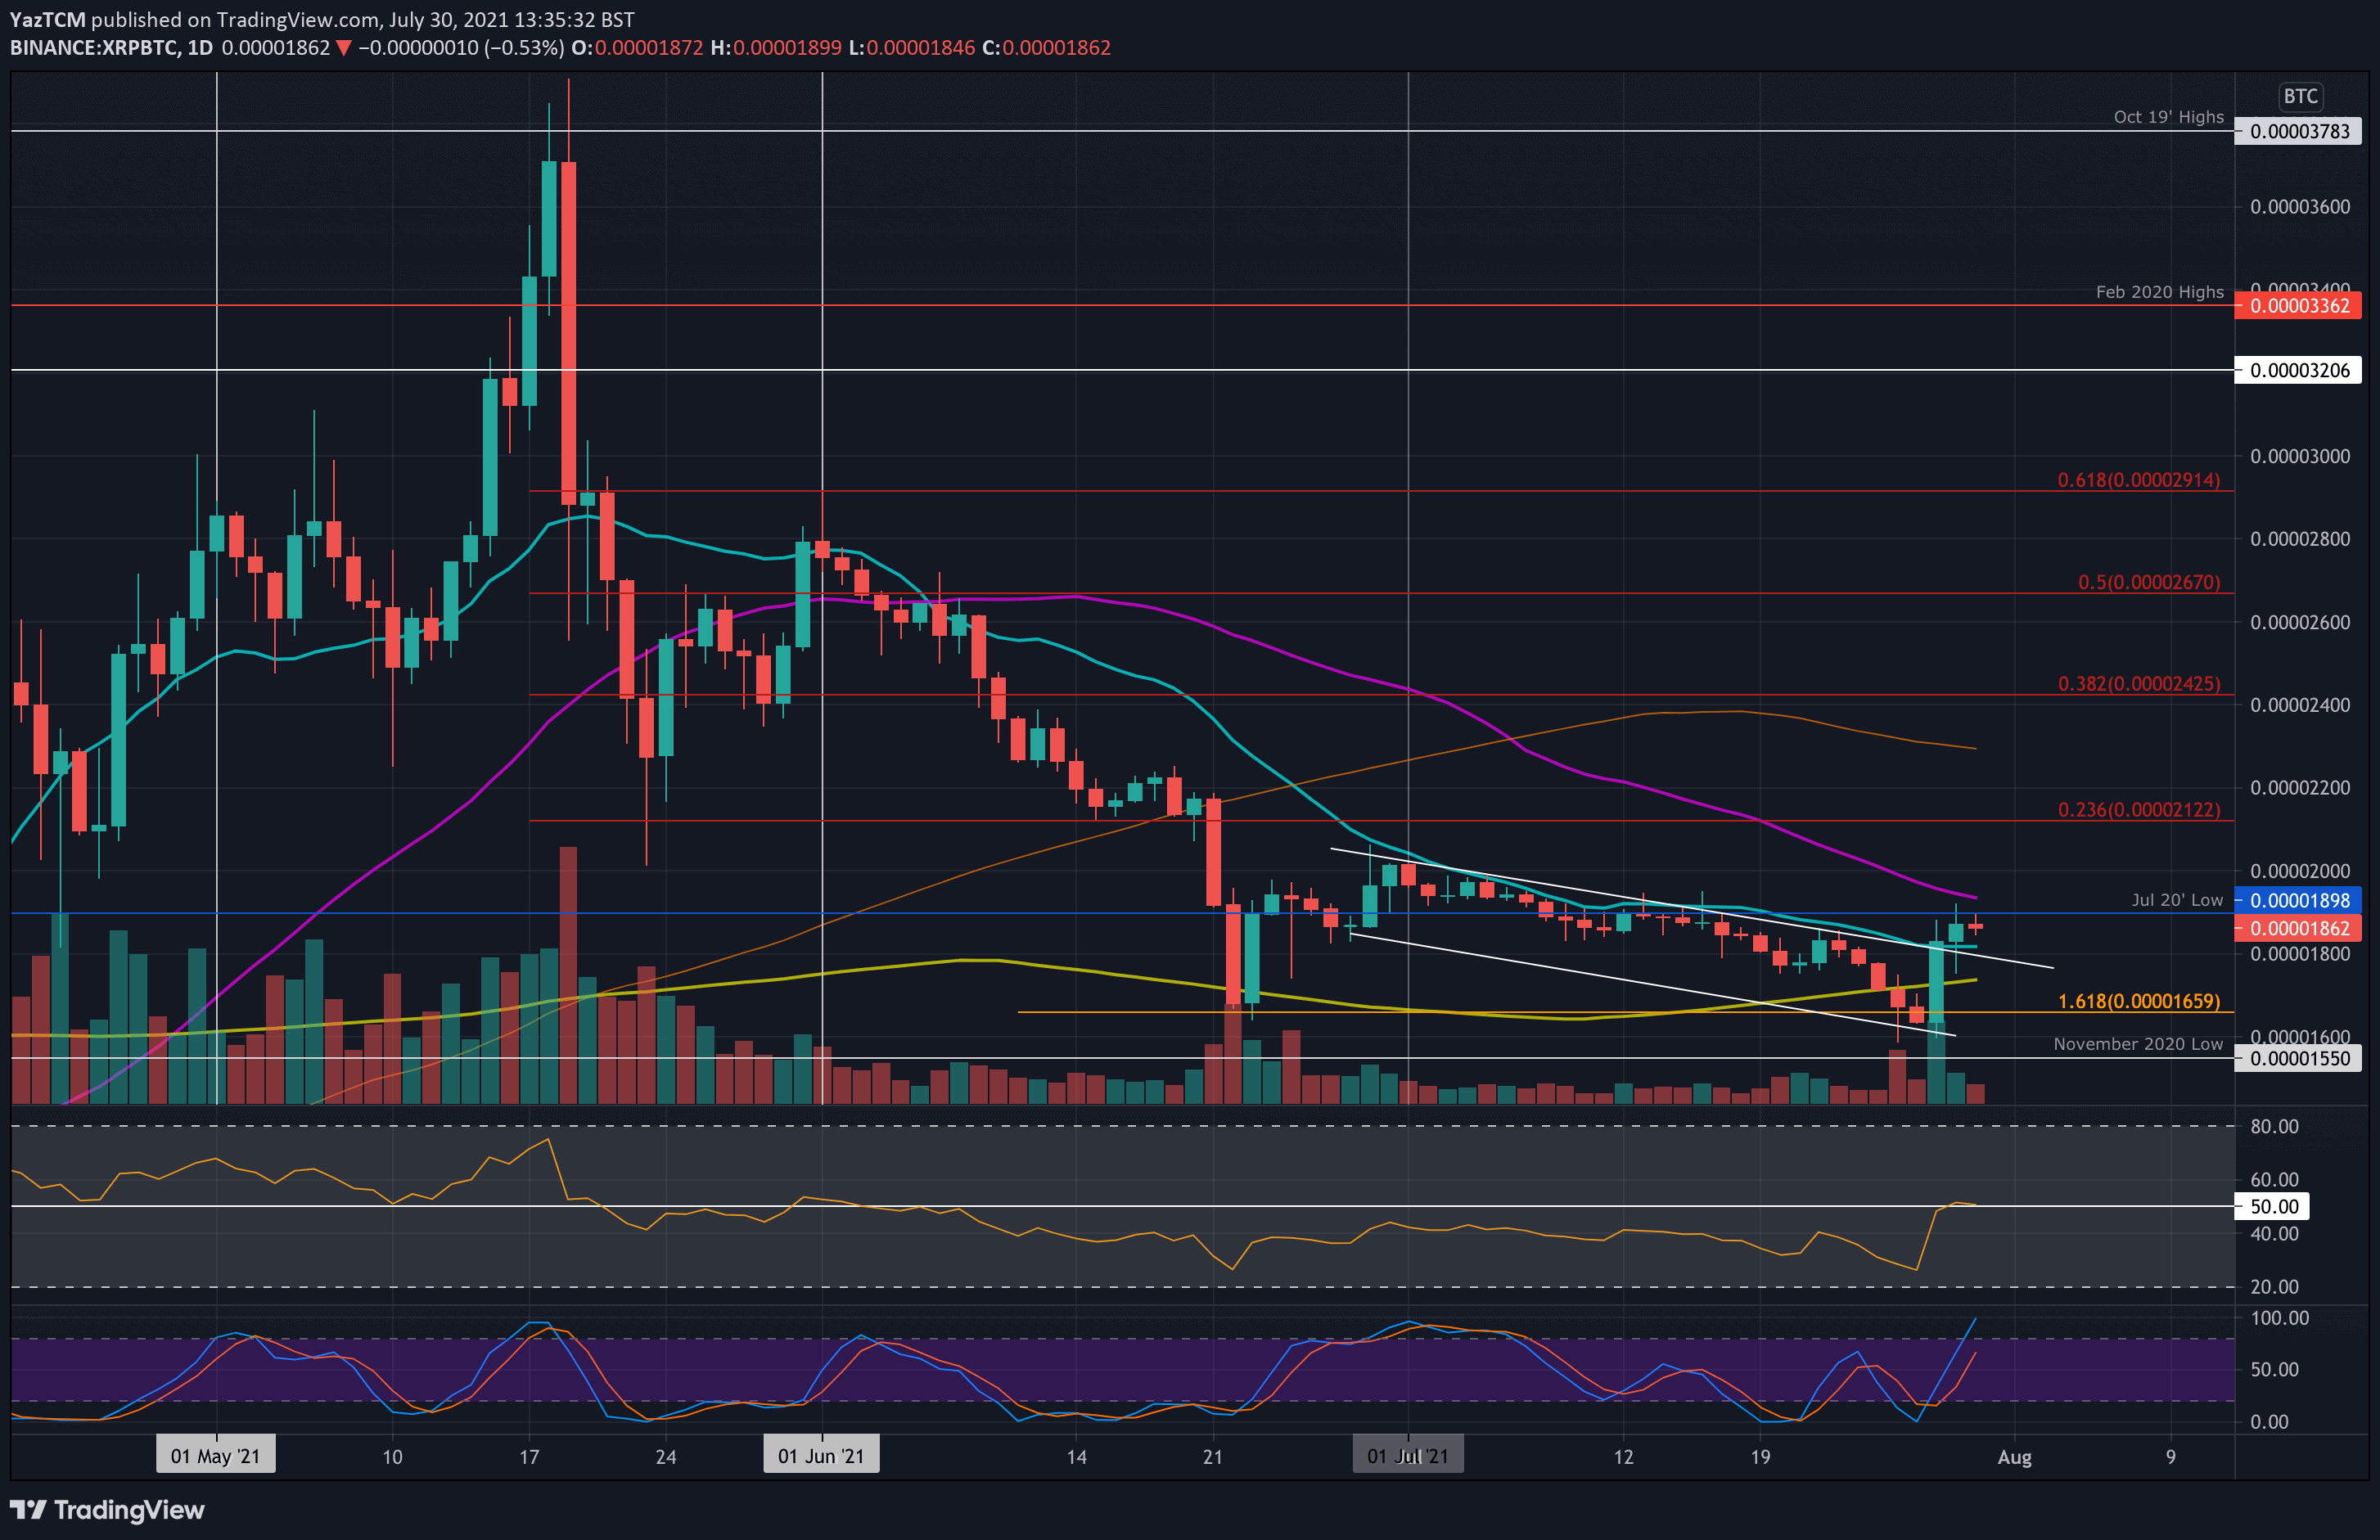
XRP is also performing well against BTC after bouncing from the support at 1600 SAT on Wednesday. There, it found support at the lower angle of a short-term descending price channel that it has been trading inside since the start of July.
The break above 1800 SAT on Wednesday allowed XRP to break the price channel and put XRP above the 20-day MA. Since then, XRP has pushed higher but is struggling to break 1900 SAT (July 2020 low).
Looking ahead, above 1900 SAT, the first resistance lies at 1950 SAT (50-day MA). This is followed by 2000 SAT, 2120 SAT (bearish .236 Fib), and 2300 SAT (100-day MA).
On the other side, the first support lies at 1800 SAT (20-day MA). This is followed by 1740 SAT (200-day MA), 1660 SAT, and 1600 SAT.
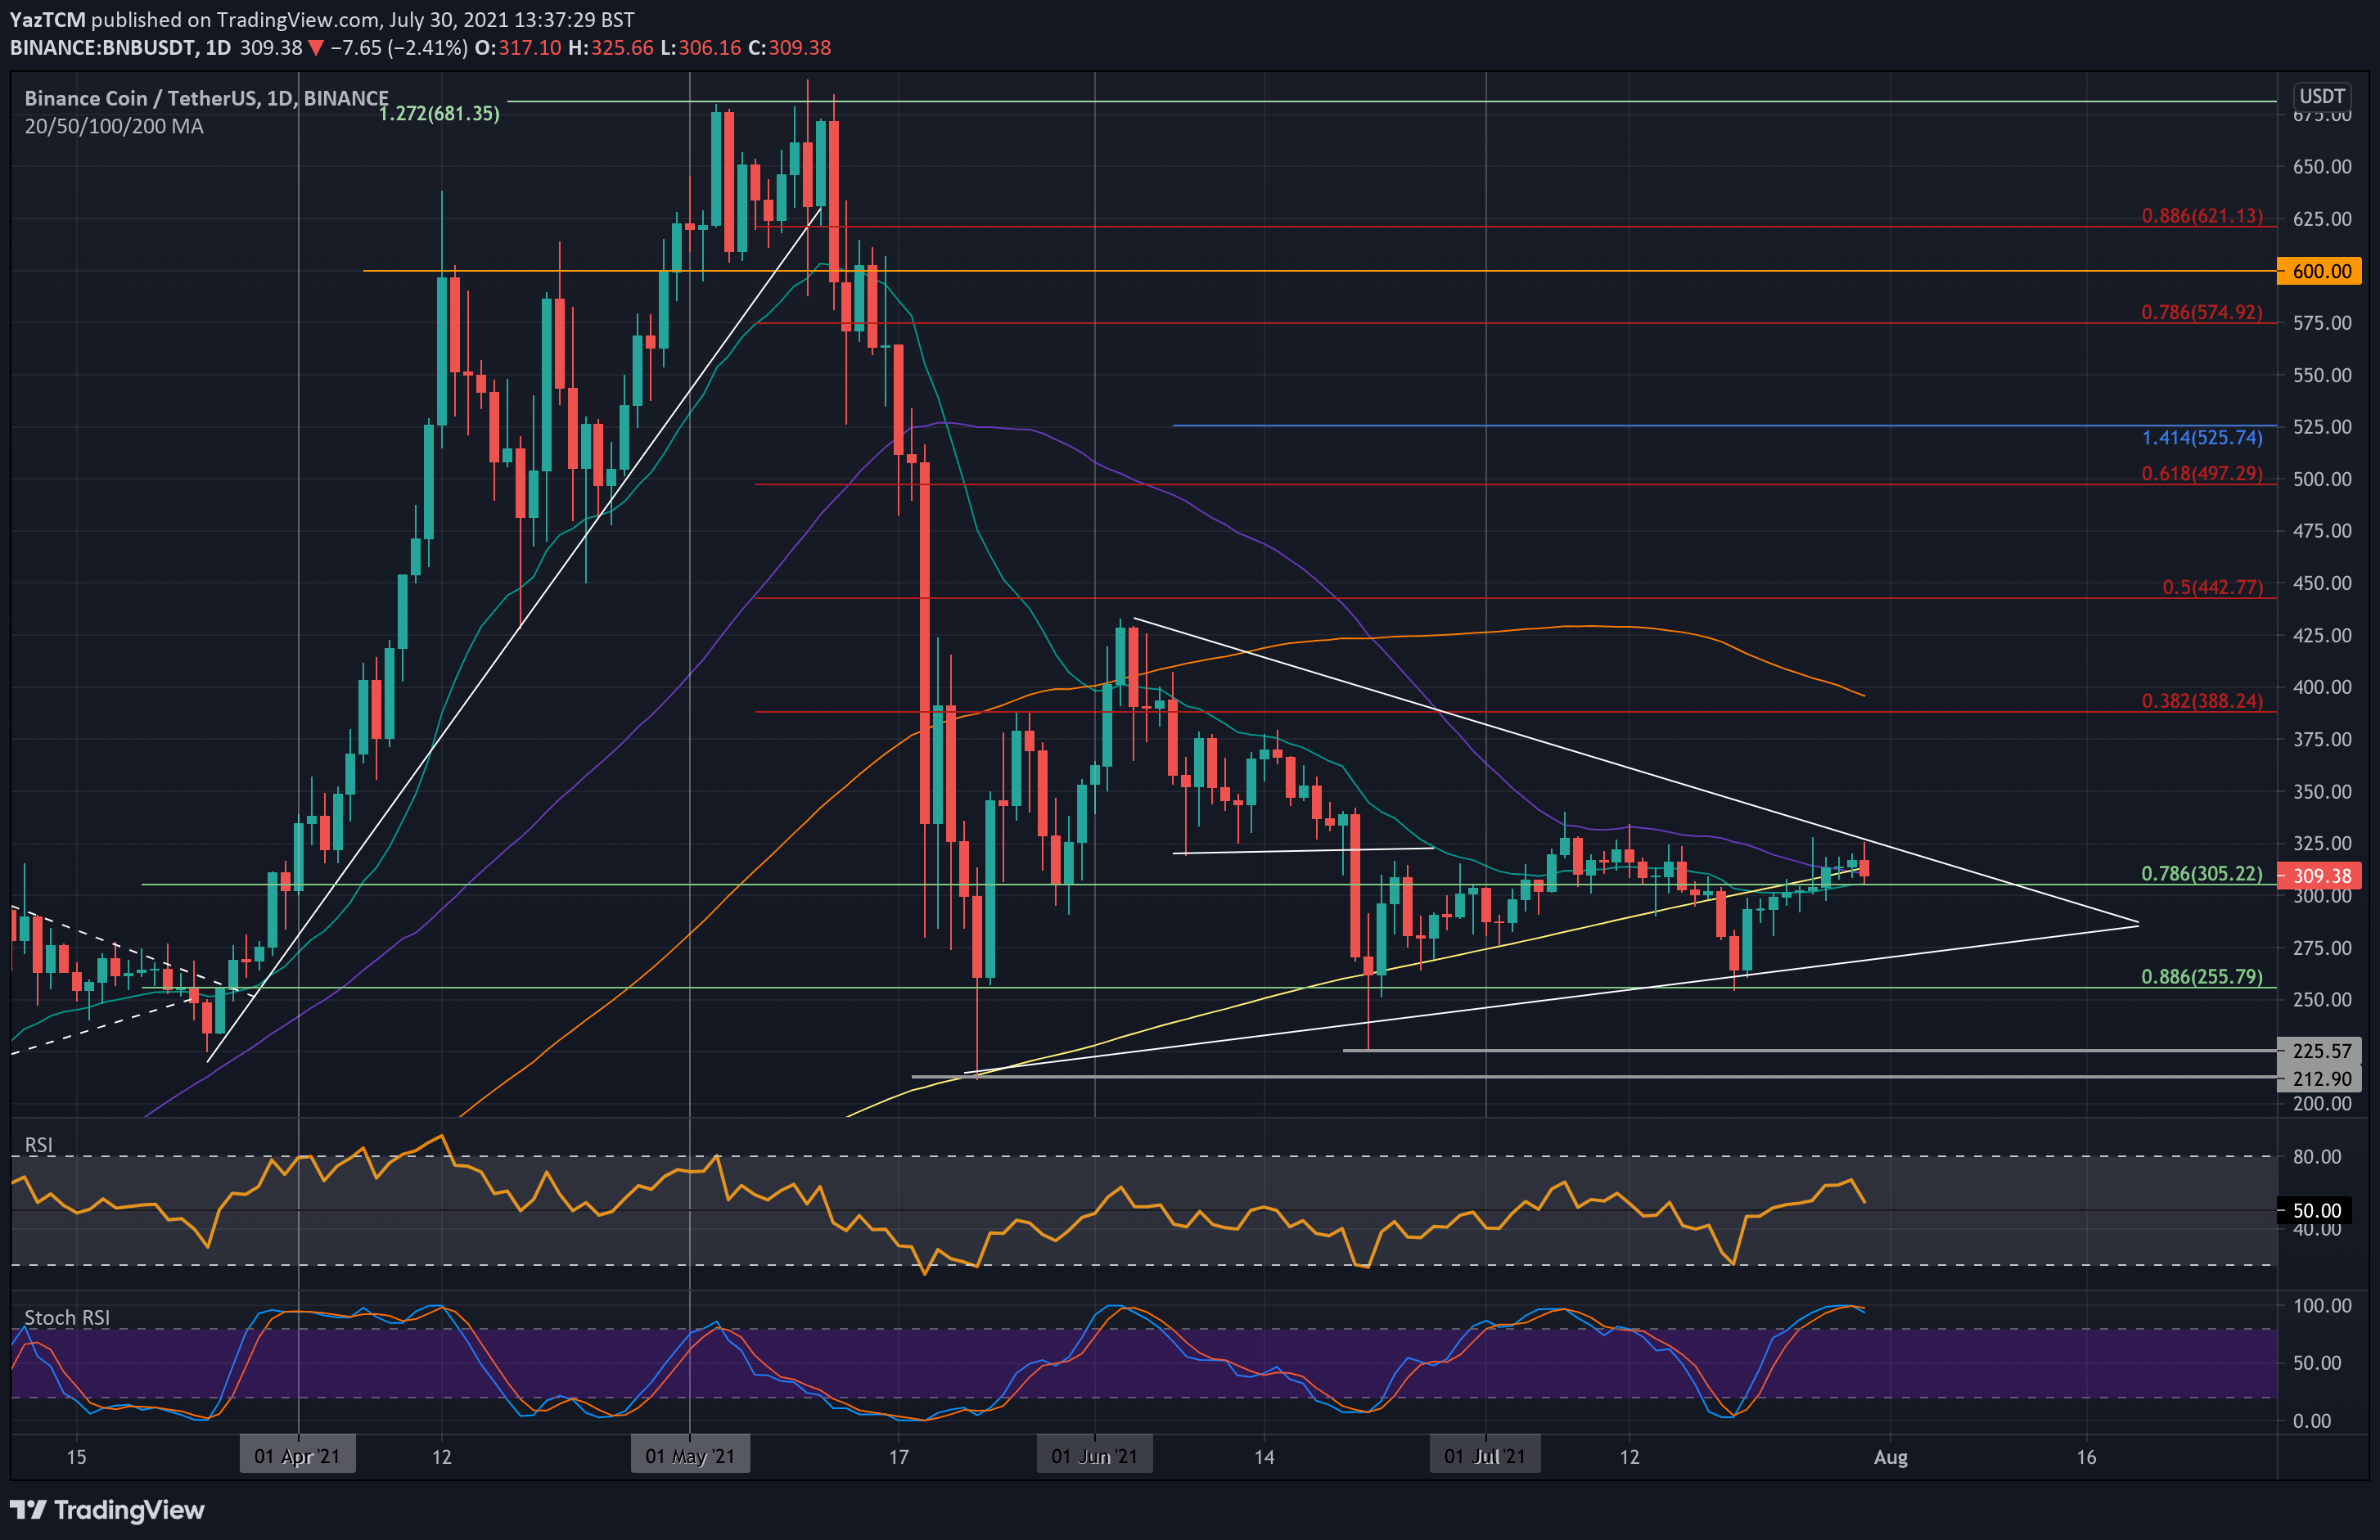
Binance Coin
BNB is up by a small 5.3% from where it was trading last Friday as it sits at $310. The cryptocurrency was beneath $300 at the start of the week but eventually managed to push above it during the BTC push higher.
BNB is trading inside a symmetrical triangle pattern and recently hit the upper angle of this pattern today at $325. A breakout of this triangle would be needed for a bullish push toward the June highs.
Looking ahead, the first support lies at $305 (.786 Fib & 20-day MA). This is followed by $300, $275 (lowe angle of the triangle), $244 (.886 Fib), and $225 (June lows).
On the other side, the first resistance lies at $325 (upper angle of the triangle). This is followed by $350, $288 (bearish .382 Fib), and $400 (100-day MA).
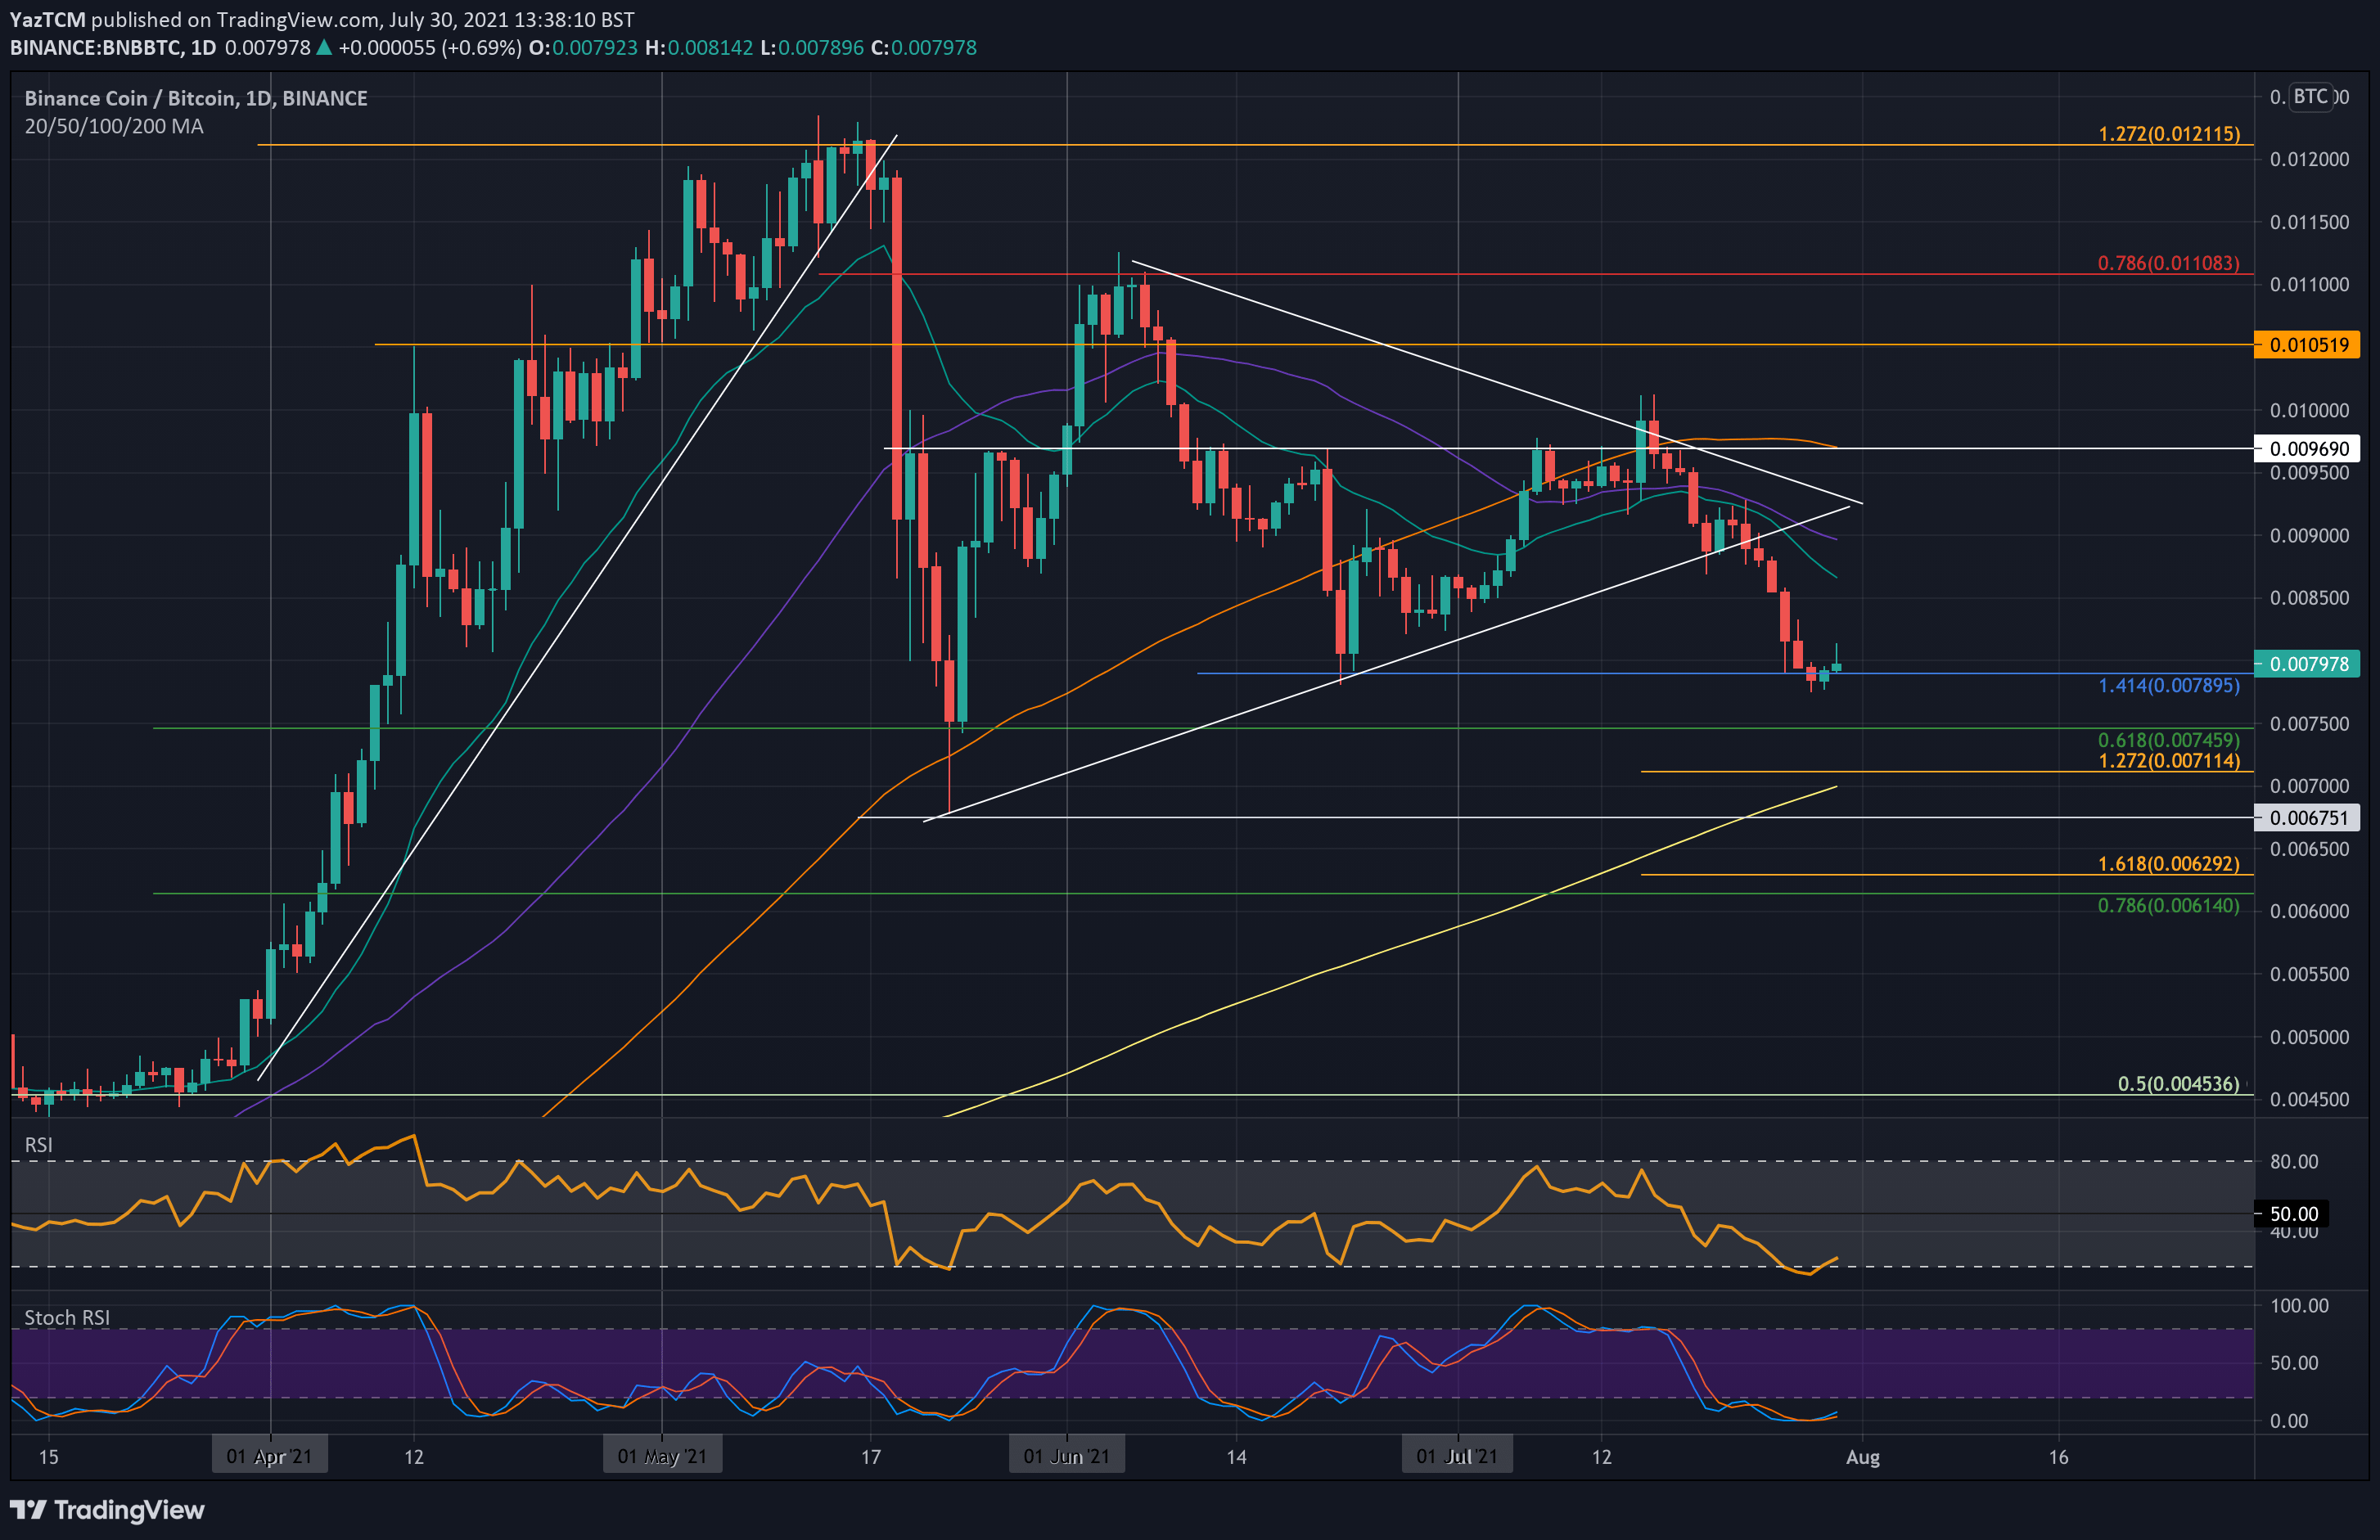
Against BTC, BNB is struggling after setting a new two-month-low this week at 0.0077 BTC. The coin dropped beneath a symmetrical triangle pattern at the start of the week and continued to plummet as the week progressed.
It has since rebounded from the July lows and is attempting to break the resistance at 0.008 BTC again.
Looking ahead, the first support lies at 0.0077 BTC. This is followed by 0.0075 BTC (.618 Fib), 0.007 BTC (200-day MA), 0.00675 BTC (May lows), and 0.0061 (.786 Fib).
On the other side, the first resistance above 0.008 BTC lies at 0.0085 BTC. This is followed by 0.009 BTC (50-day MA), 0.0096 BTC, and 0.01 BTC.
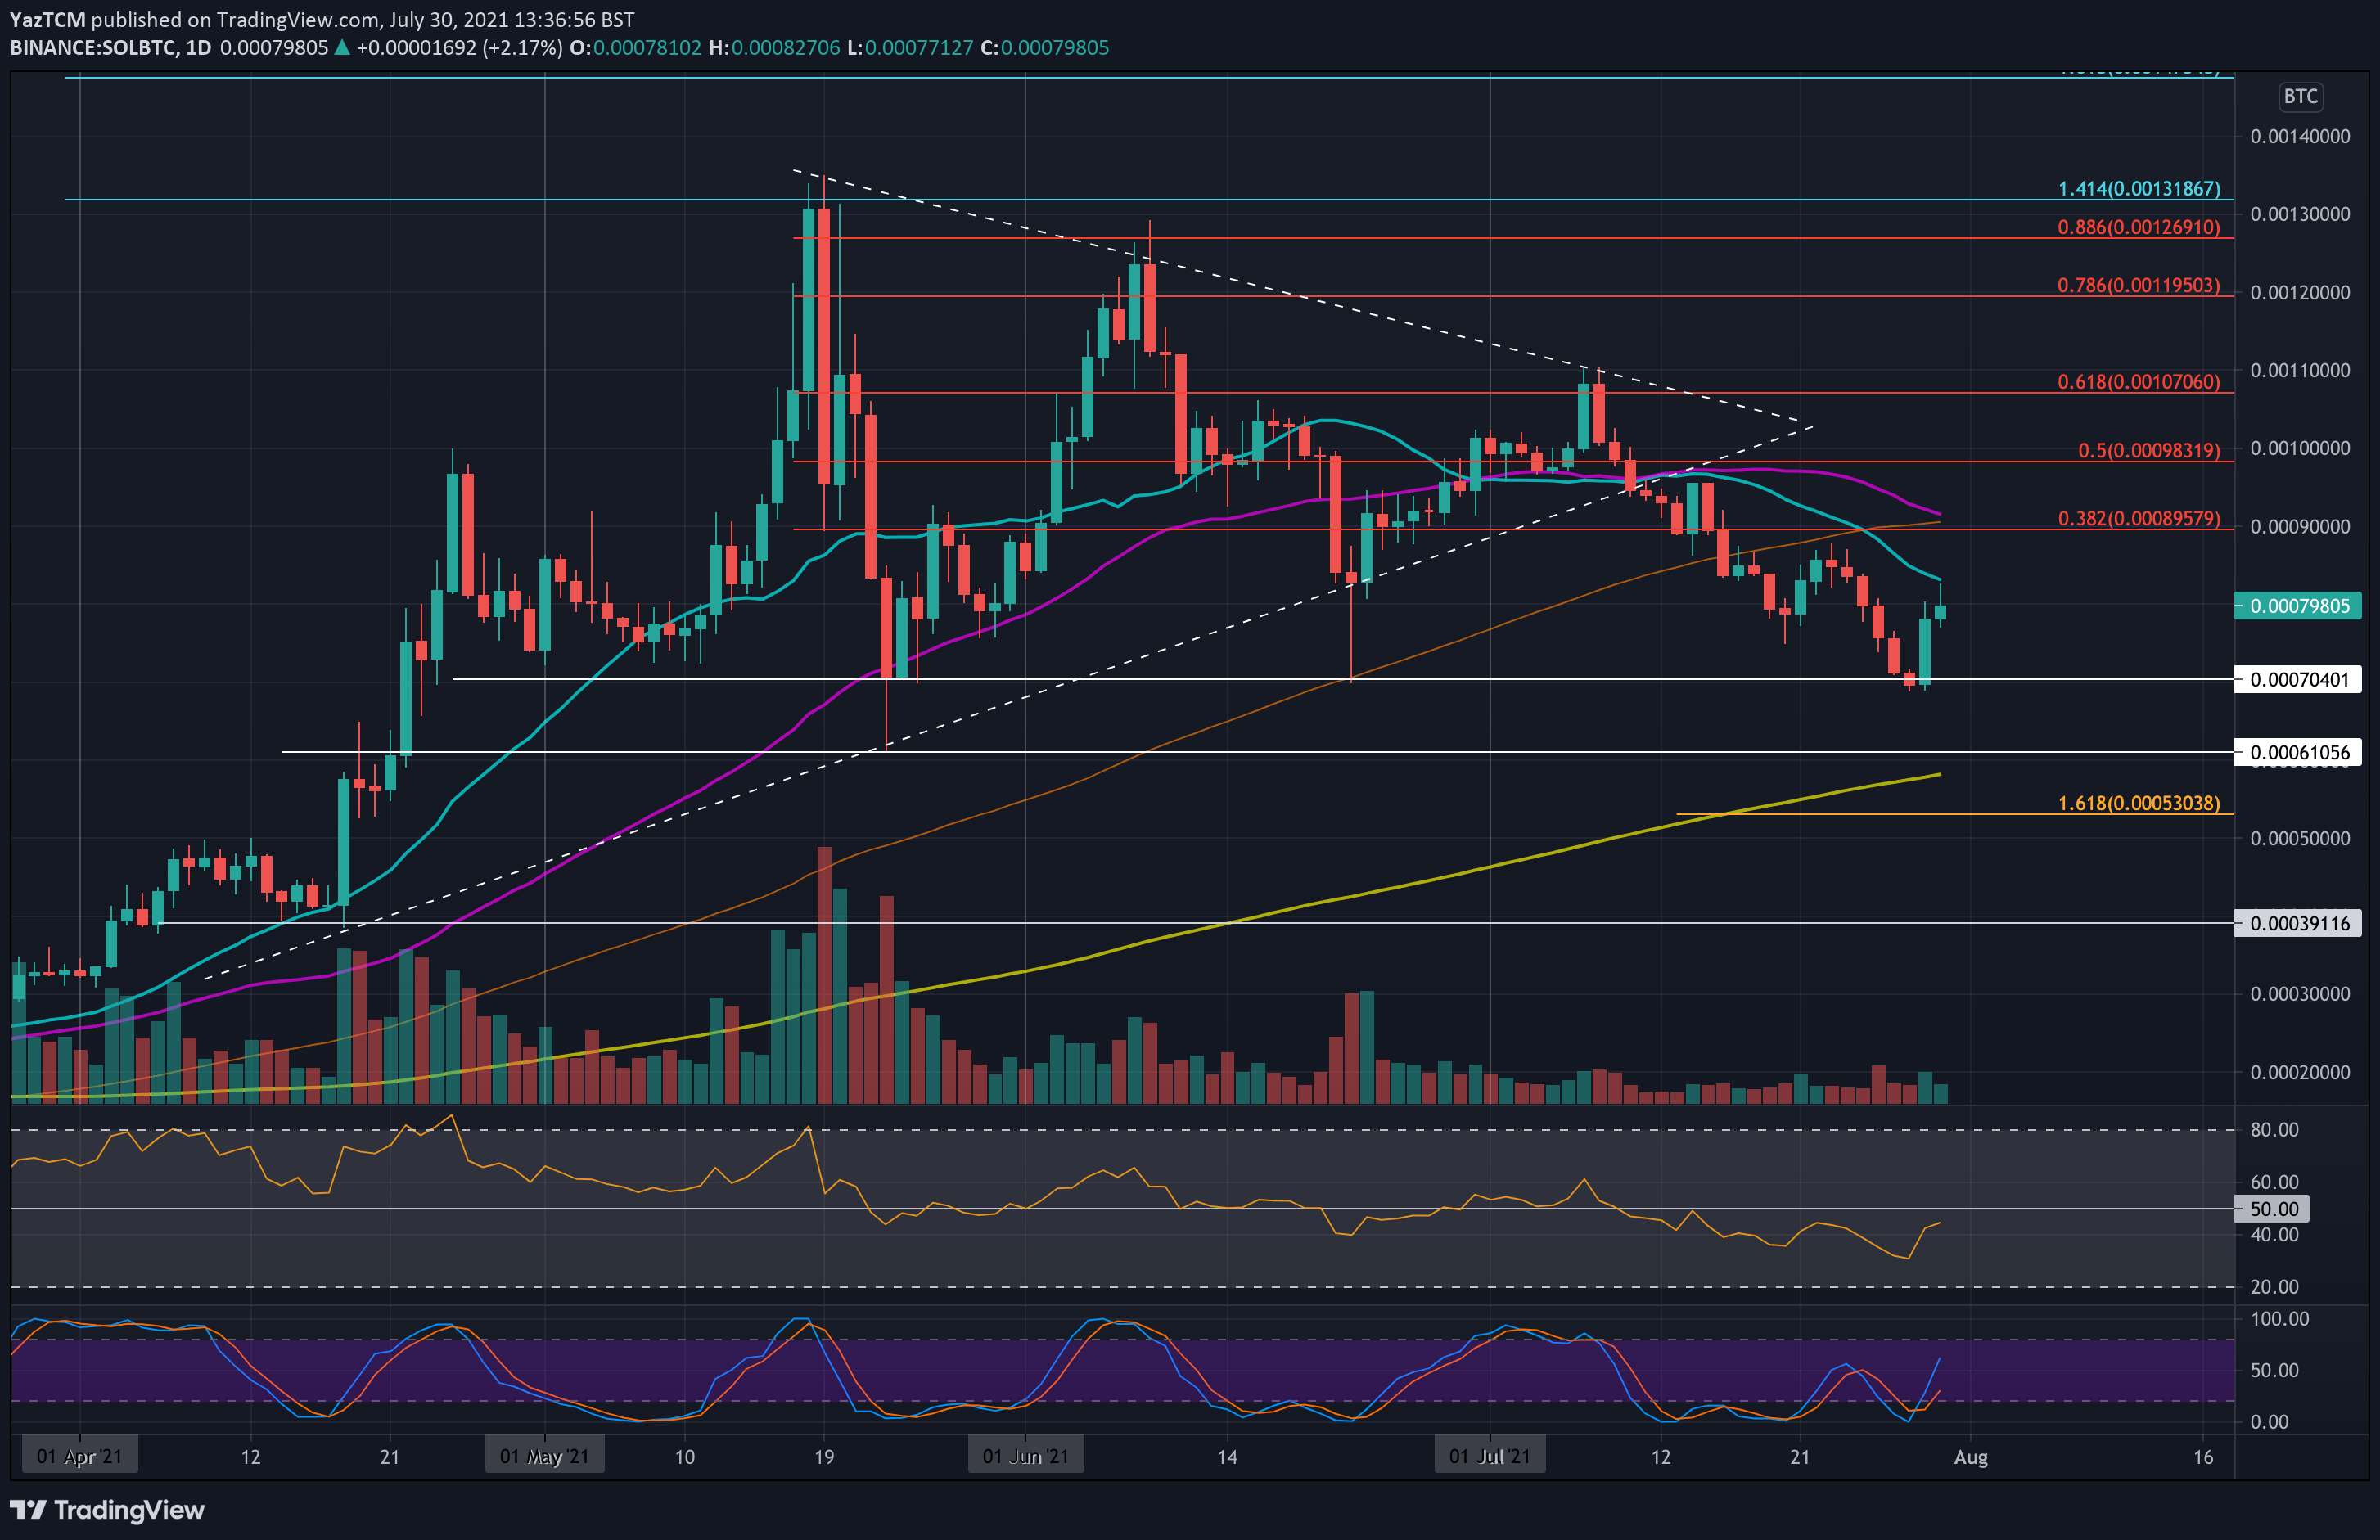
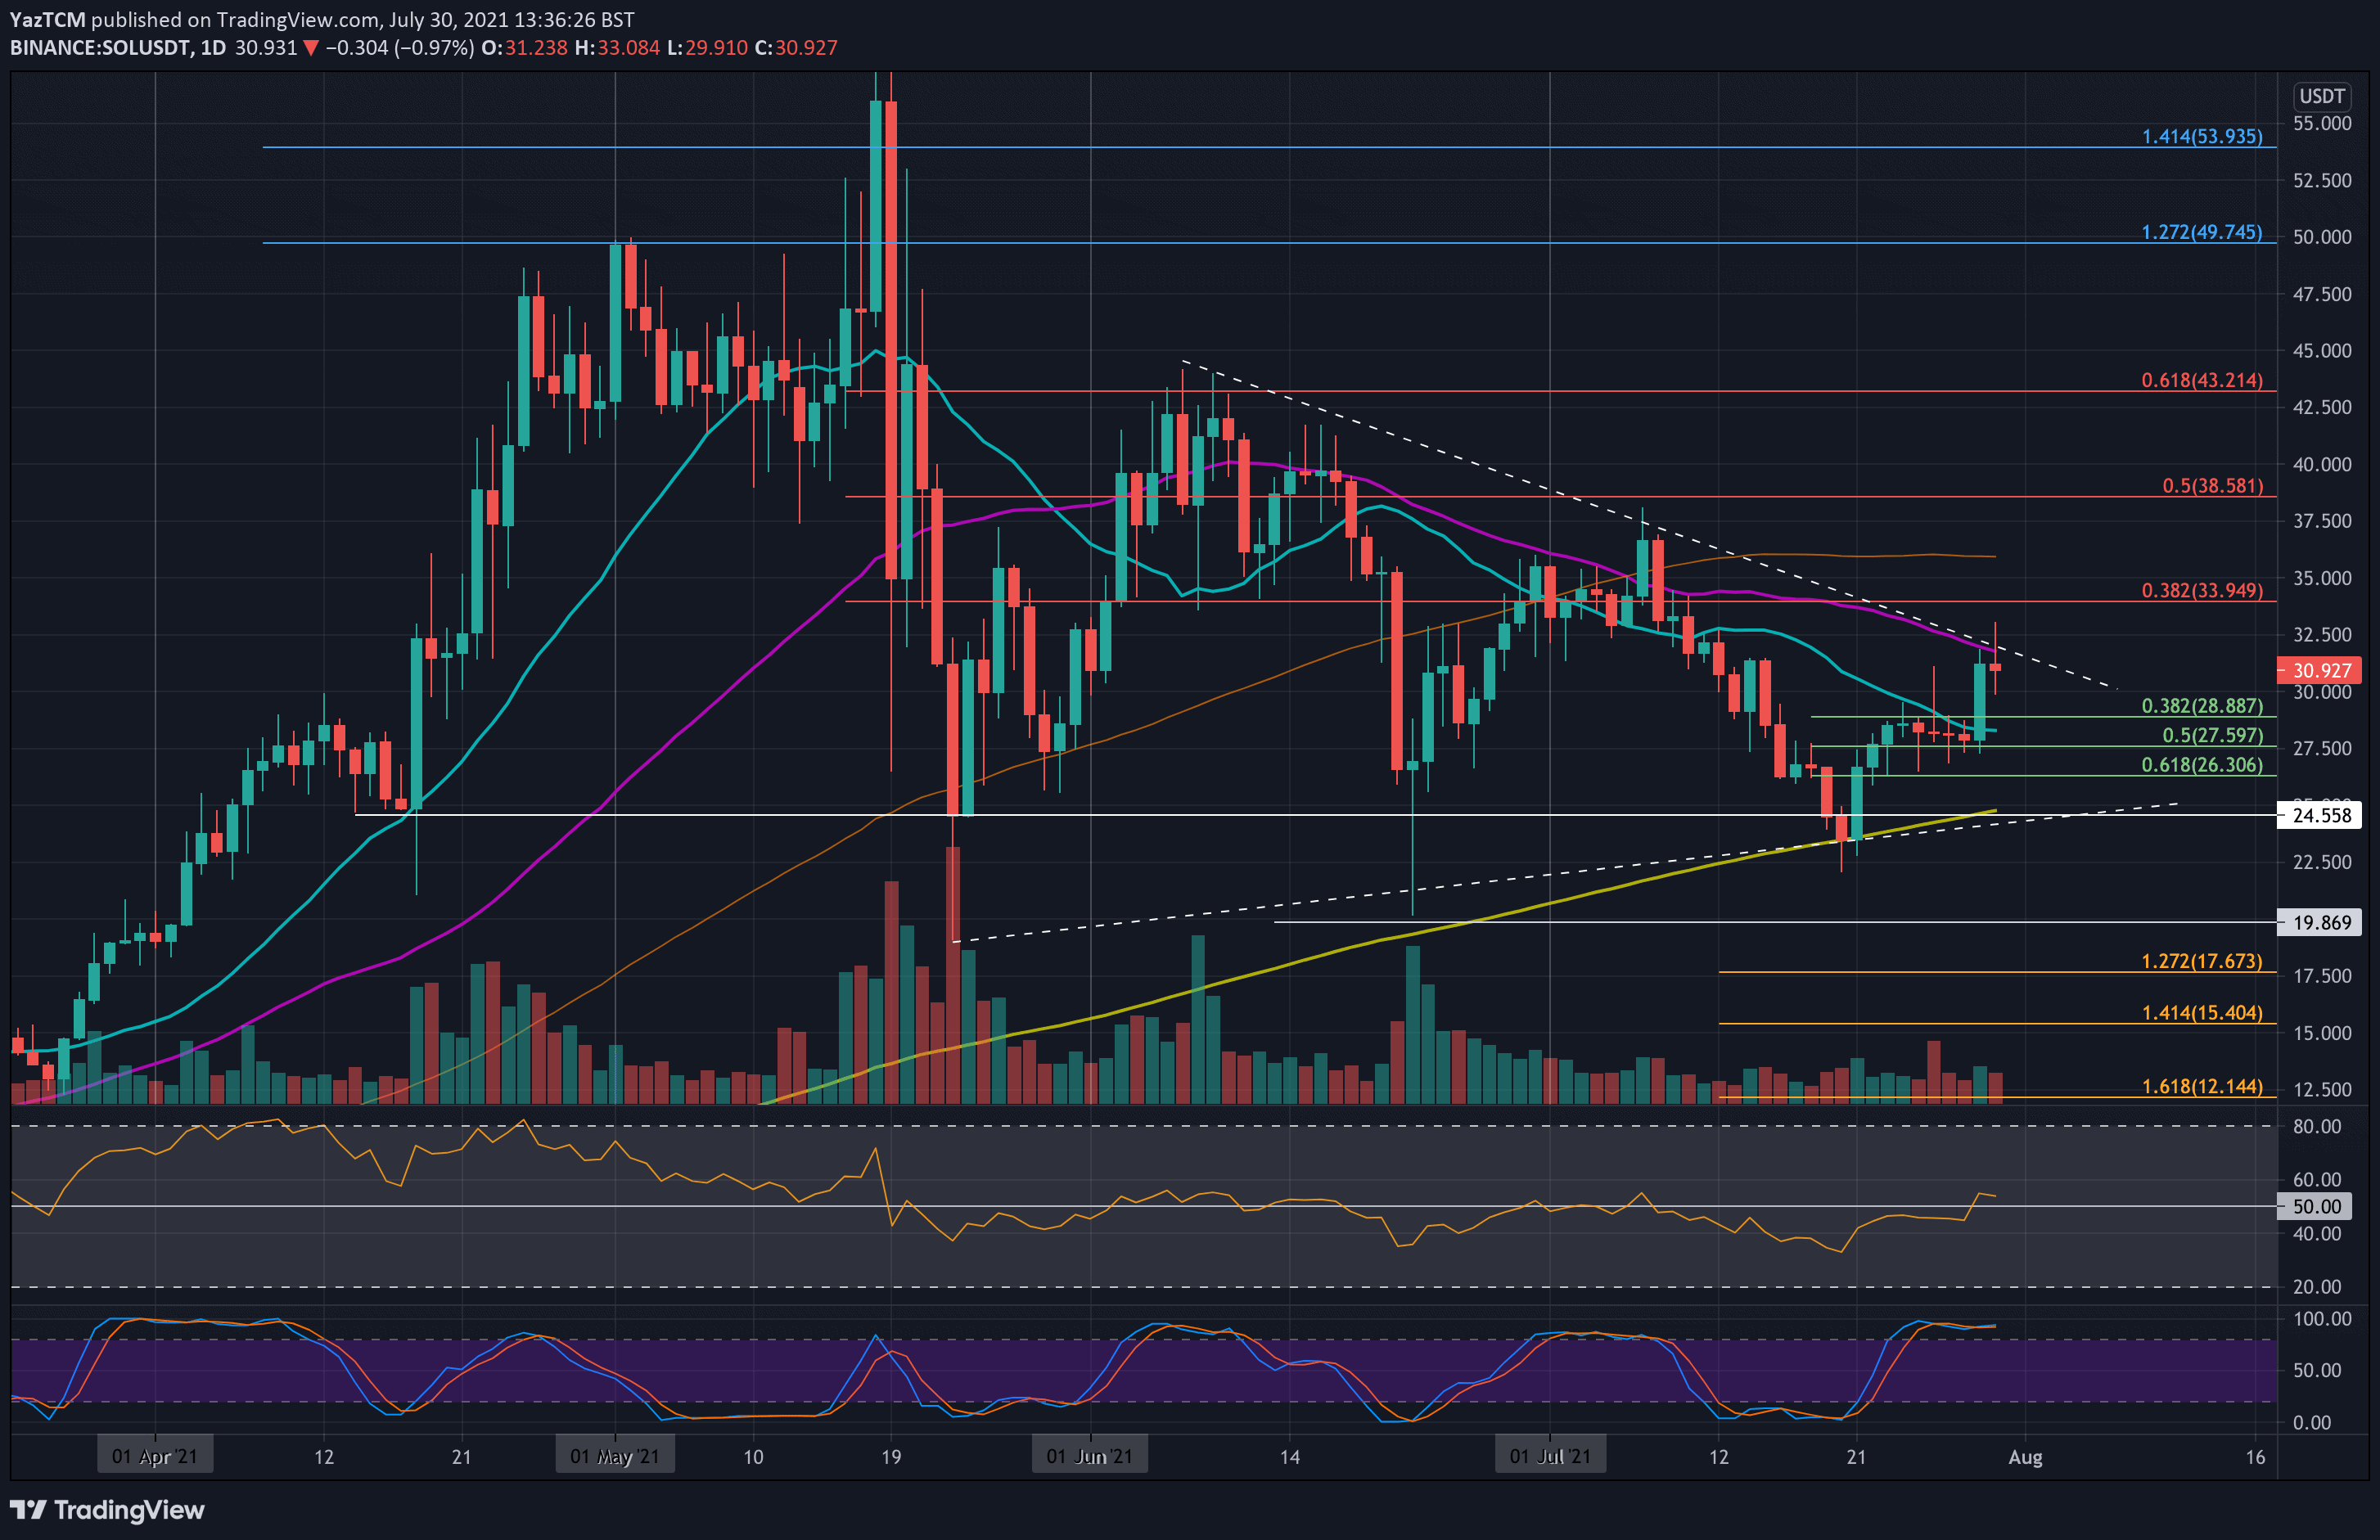
Solana
SOL is up around 10% this week as the coin attempts to break resistance at the 50-day MA level. It bounced from $26.30 at the start of the week and battled to break the 20-day MA at around $28.
The break above the 20-day MA finally came yesterday as SOL surged above $30. However, it is now battling the 50-day MA resistance that is bolstered by the upper angle of a short-term triangle pattern.
Looking ahead, if the bulls can break the 50-day MA at $32 and climb above the triangle, the first resistance lies at $34 (bearish .382 Fib Retracement). This is followed by $36 (100-day MA), $38.60 (bearish .5 Fib), and $40.
On the other side, the first support lies at $30. This is followed by $28.88 (.382 Fib), $28 (20-day MA), $26.30 (.618 Fb), and $25 (200-day MA & lower angle of the triangle).
Against BTC, SOL has been in a steady decline this week but found support at the June lows around 0.0007 BTC yesterday.
SOL rebounded at this support yesterday and hit the 20-day MA at 0.000831 BTC today.
Looking ahead, if the buyers can break the 20-day MA, the first strong resistance lies at 0.0009 BTC (bearish .382 Fib, 100-day MA & 50-day MA). This is followed by 0.001 BTC (bearish .5 Fib), 0.00107 BTC (bearish .618 Fib), and 0.0011 BTC.
On the other side, the first support lies at 0.0007 BTC. Beneath this, support lies at 0.00061 BTC (May low), 0.000581 BTC (200-day MA), 0.00053 BTC (downside 1.618 Fib Extension), and 0.0005 BTC.