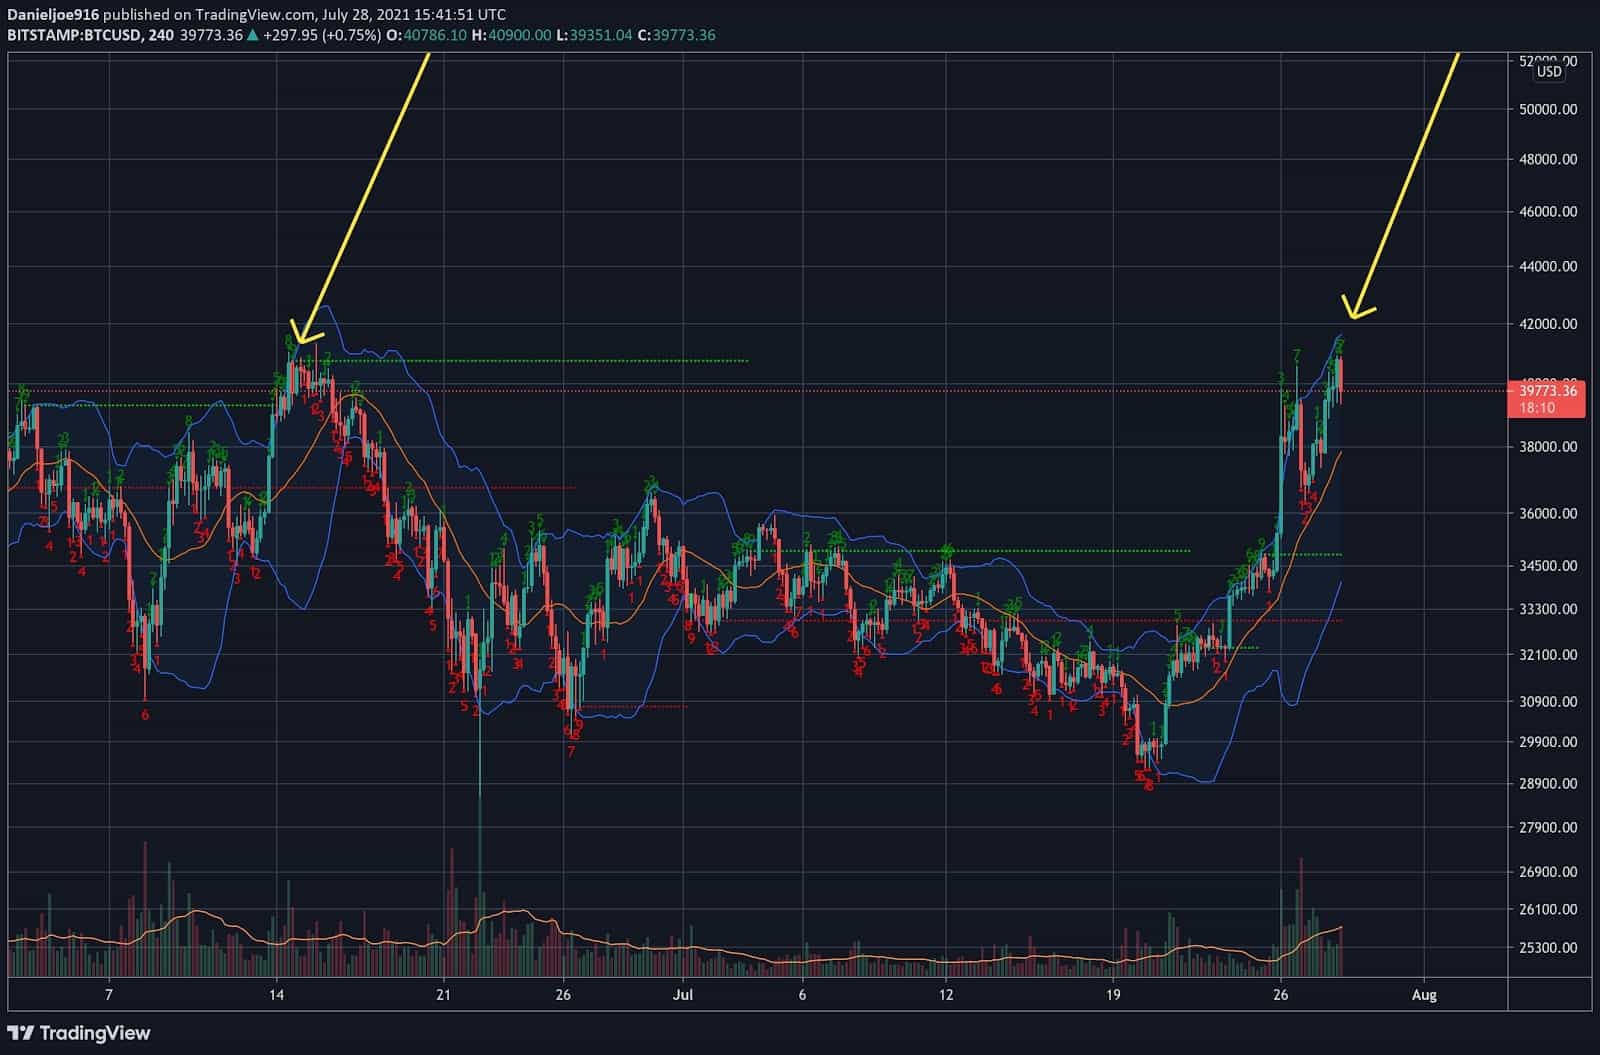
BTC’s recent 9 daily candle streak to the upside has been very impressive. We have been tracking the third-largest BTC whale wallet and found interesting activity and signals. The whale entity, at one point, held over 116,841 BTC. Its current total BTC holdings stand at 113,841. The recent sales from this address since April 2021 have accurately marked local tops in BTC, as shown in the chart below. Chart by TradingViewThis doesn’t necessarily mean that bitcoin’s price will crash. The activity has shown that this entity strategically sells BTC after large rallies to take profit, rebalance, and buy back on dips. Ever since this wallet was created, the total amount of BTC holding has increased month after month. In the below charts, the vertical red boxes indicate the time
Topics:
Daniel Joe considers the following as important: AA News, Bitcoin (BTC) Price, bitcoin whales, BTCEUR, BTCGBP, btcusd, btcusdt, social
This could be interesting, too:
Chayanika Deka writes Yuga Labs Secures Major Win as SEC Closes Investigation Without Charges
Andrew Throuvalas writes Bitcoin Soars Back To ,000 After BlackRock CEO Says “Buy The Dip”
Chayanika Deka writes XRP, SOL, and ADA Inclusion in US Crypto Reserve Pushes Traders on Edge
Chayanika Deka writes Why Arthur Hayes Is Bullish on Bitcoin Under Trump’s Economic Strategy
BTC’s recent 9 daily candle streak to the upside has been very impressive. We have been tracking the third-largest BTC whale wallet and found interesting activity and signals. The whale entity, at one point, held over 116,841 BTC. Its current total BTC holdings stand at 113,841.
The recent sales from this address since April 2021 have accurately marked local tops in BTC, as shown in the chart below.
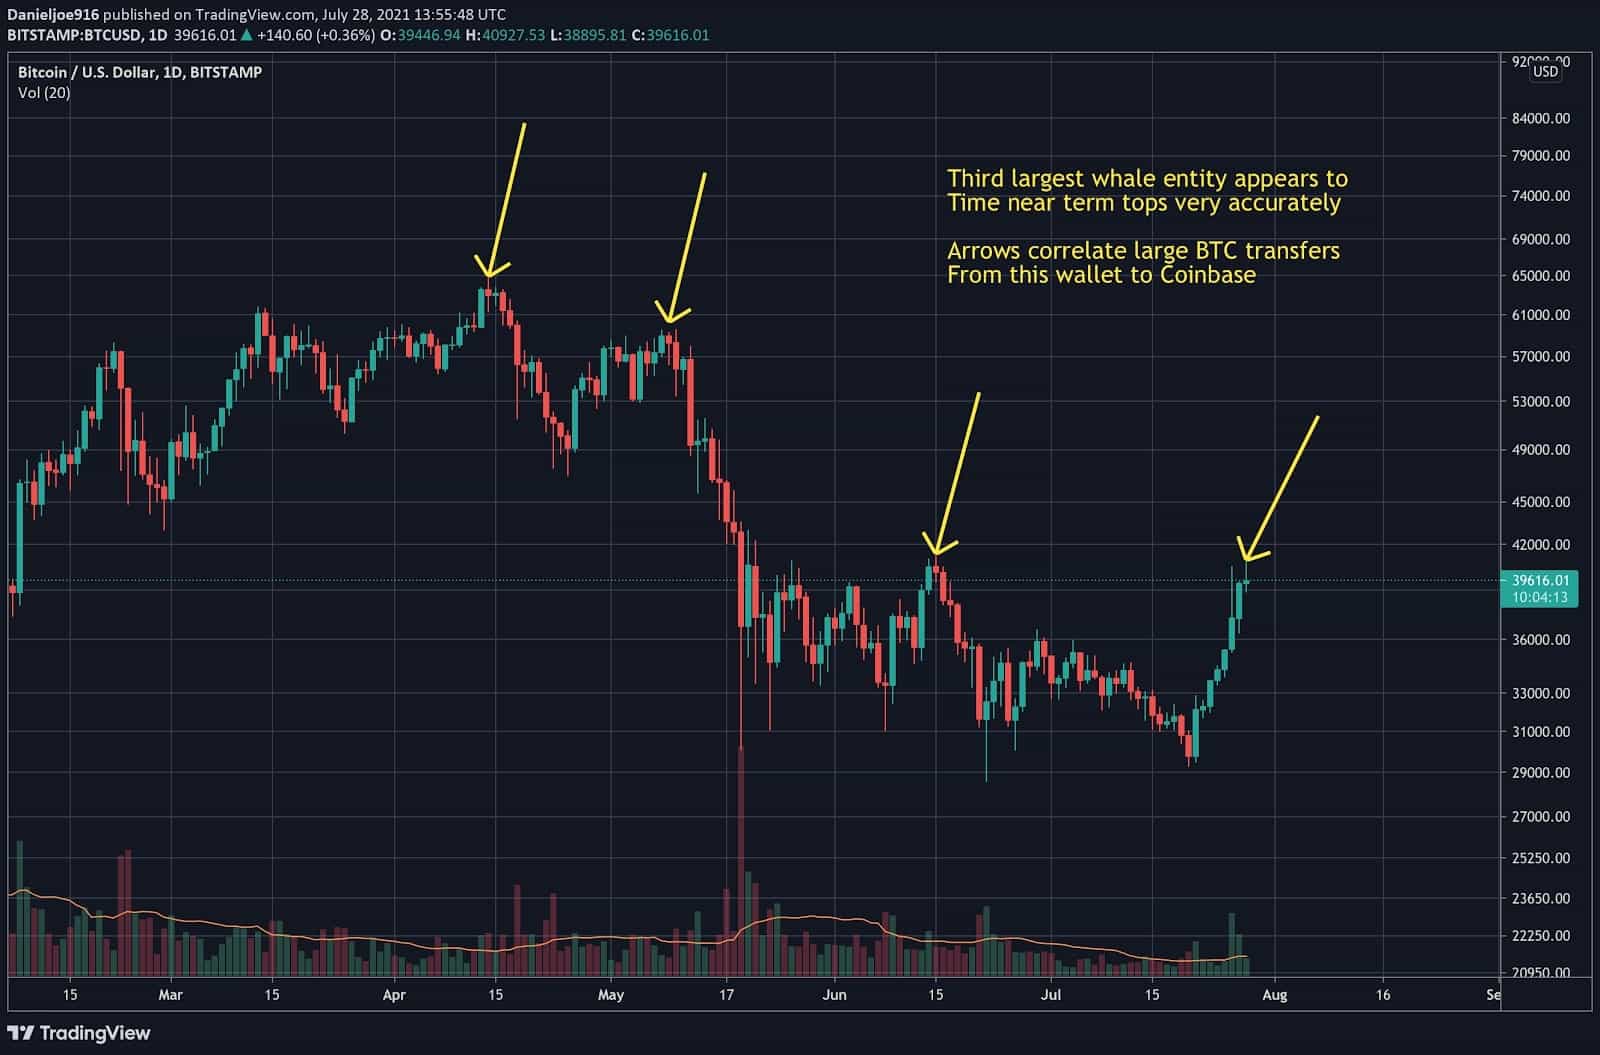
This doesn’t necessarily mean that bitcoin’s price will crash. The activity has shown that this entity strategically sells BTC after large rallies to take profit, rebalance, and buy back on dips. Ever since this wallet was created, the total amount of BTC holding has increased month after month.
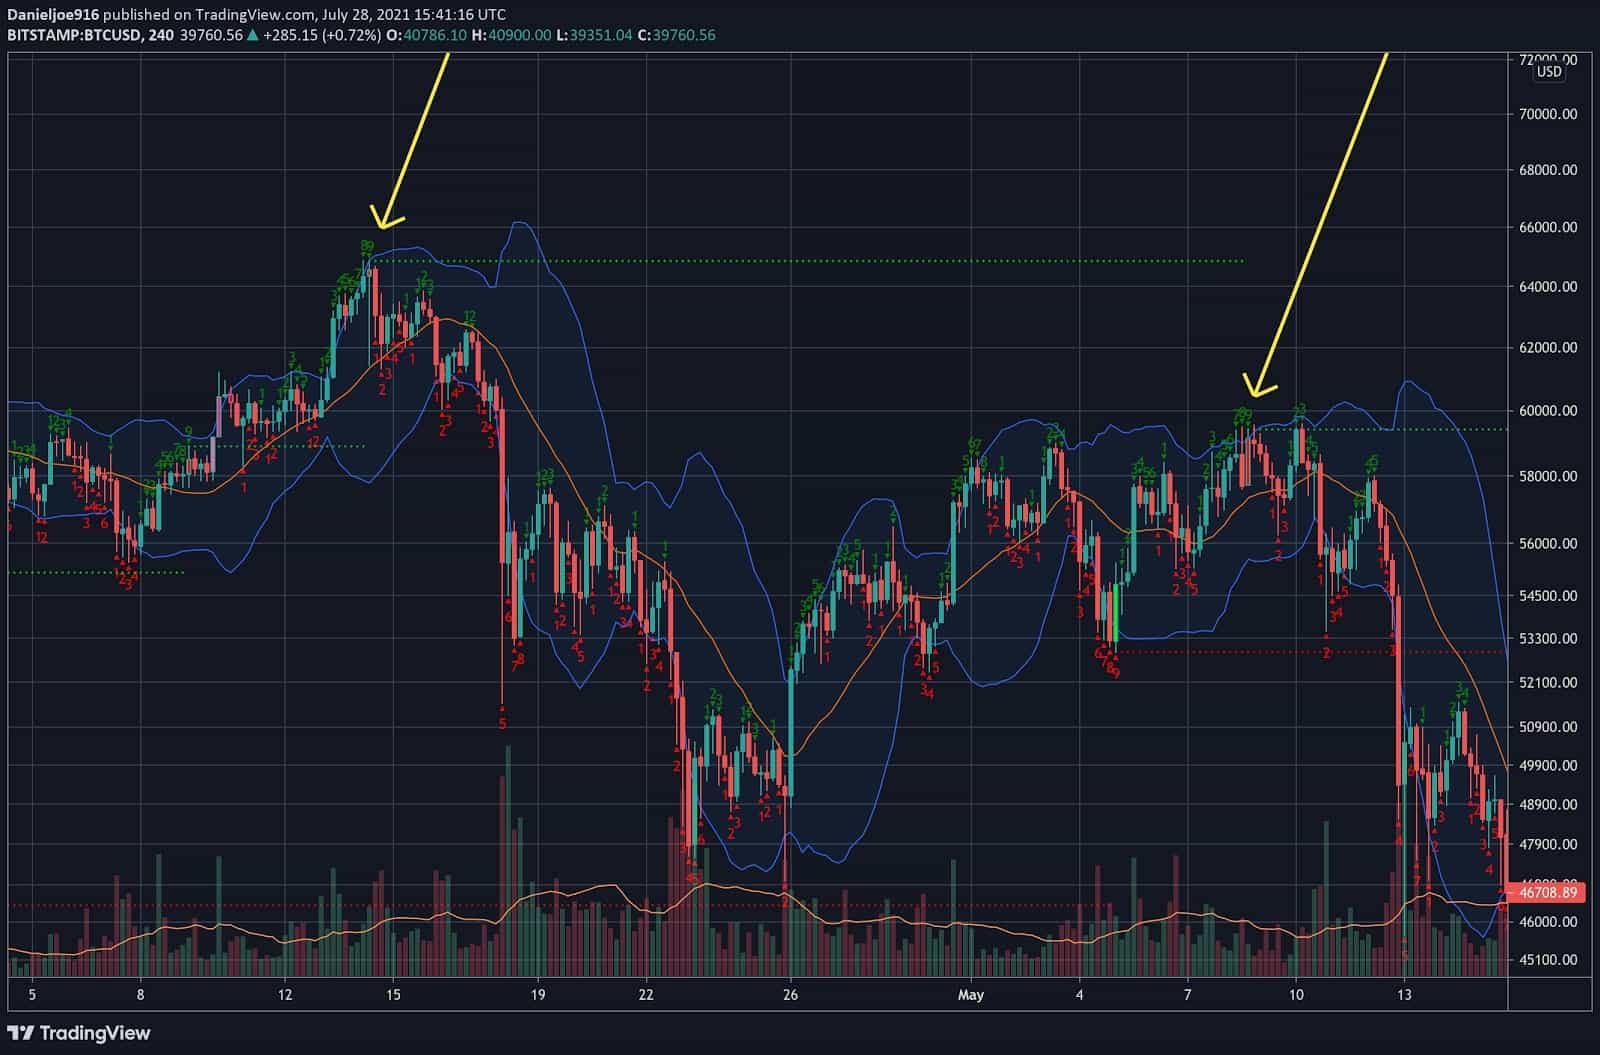
In the below charts, the vertical red boxes indicate the time when the whale entity was transferring BTC out of his account to exchanges.
Onchain Signals
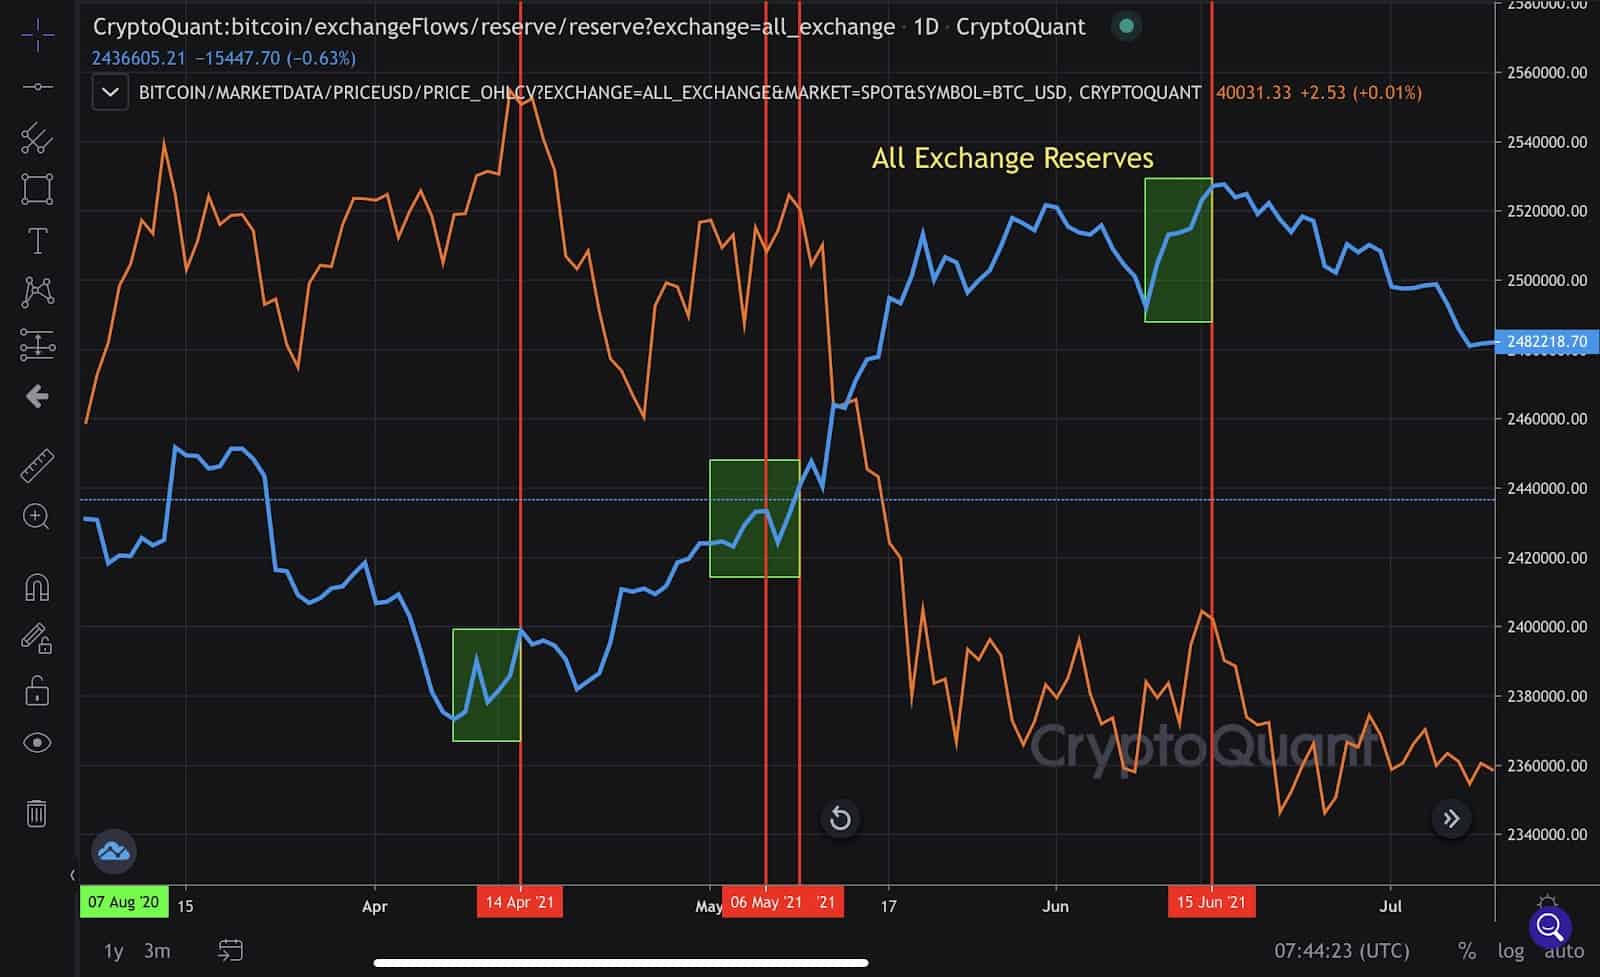
The first signal is the All Exchange Reserves metric trending higher. This means investors are depositing BTC onto exchanges causing the BTC reserves to increase. This is a warning signal for BTC, especially if prices have seen a large rally.
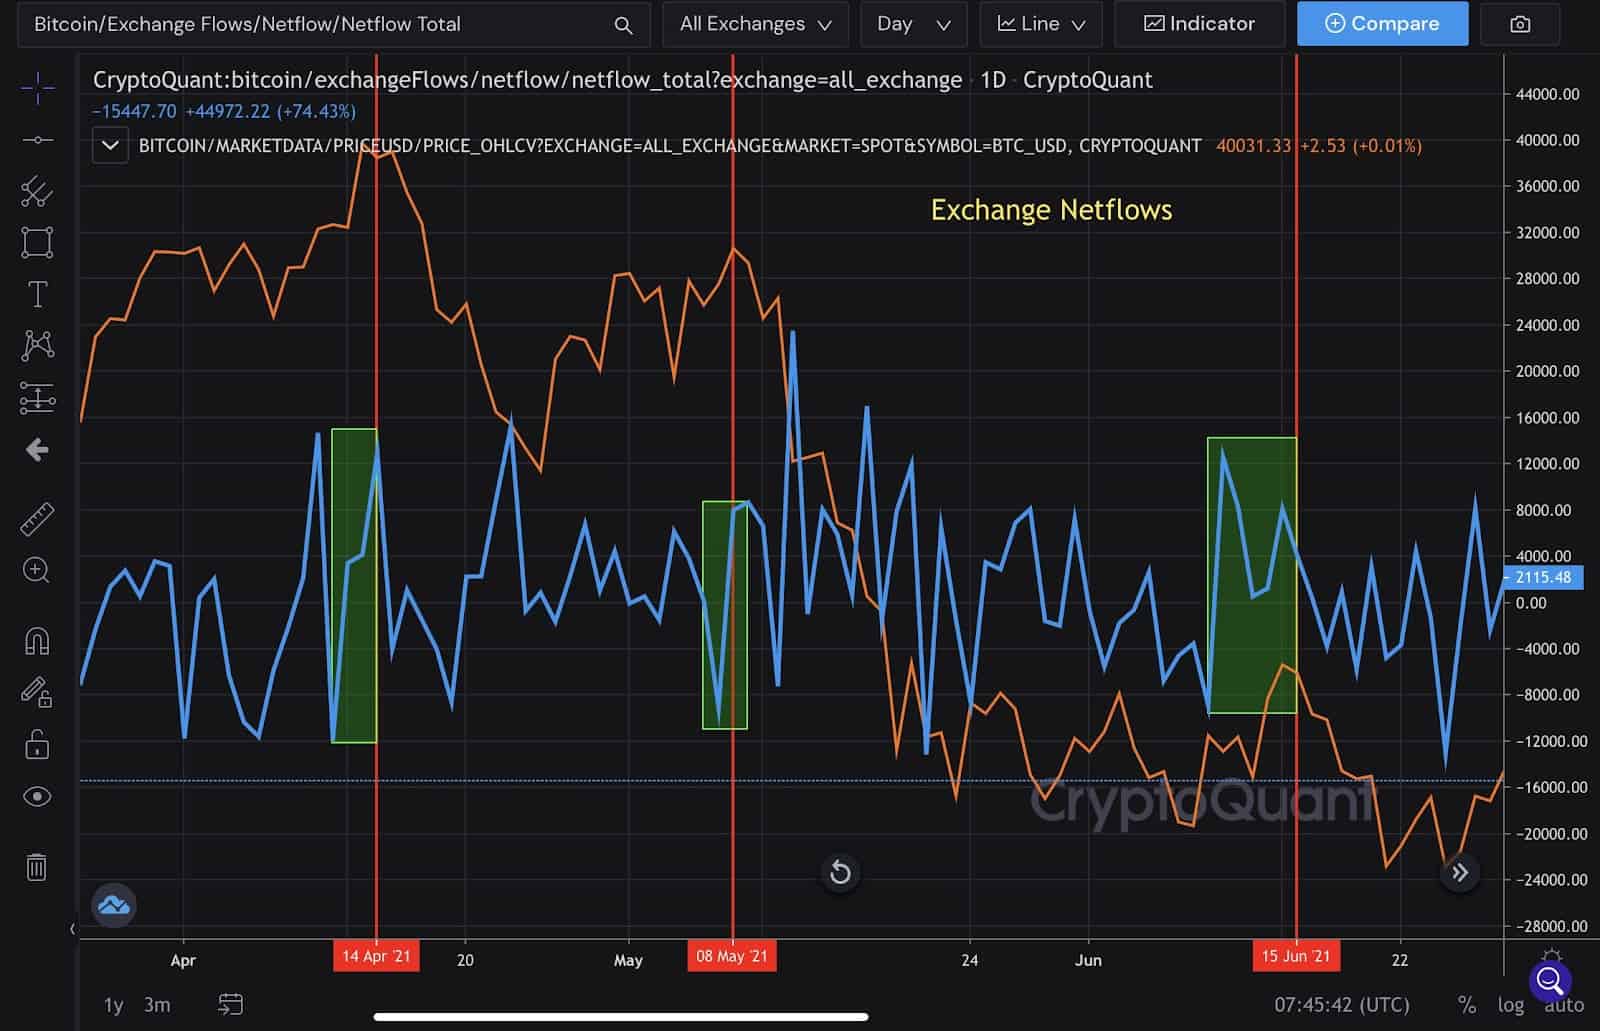
The second signal is the All Exchange Netflow Metric trending higher. This metric takes the difference between exchange inflows and exchange outflows. If the difference is positive, it means there is more BTC flowing into exchanges, signaling the intent to sell. A negative difference is bullish as more BTC is flowing out of exchanges, signaling more buying pressure.
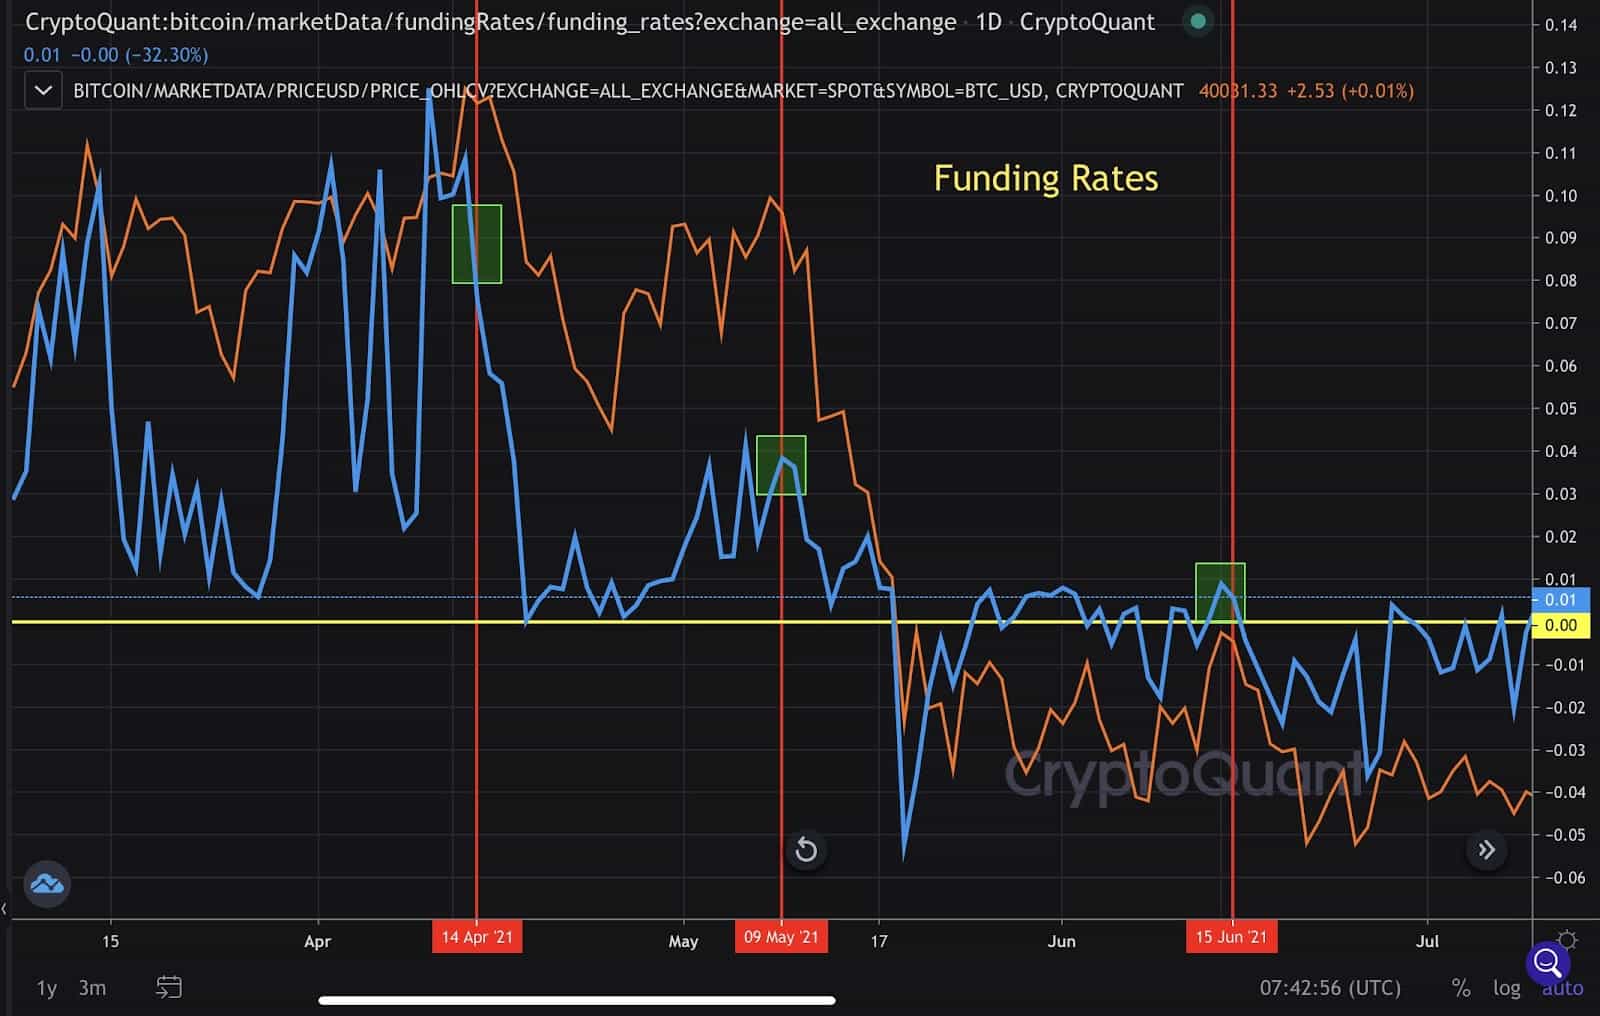
The third signal is a positive Funding Rate. A positive funding rate above zero means that investors holding long positions on derivative exchanges have to pay shorts to maintain their position. An increasing funding rate, especially if positive for an extended period of time, increases the risk of a local top and pullback.
Technical Signals
The first technical signal is the Stochastic RSI, which is a more sensitive indicator derived from the relative strength index. When the Stochastic RSI is above 80, it signals price is overbought.
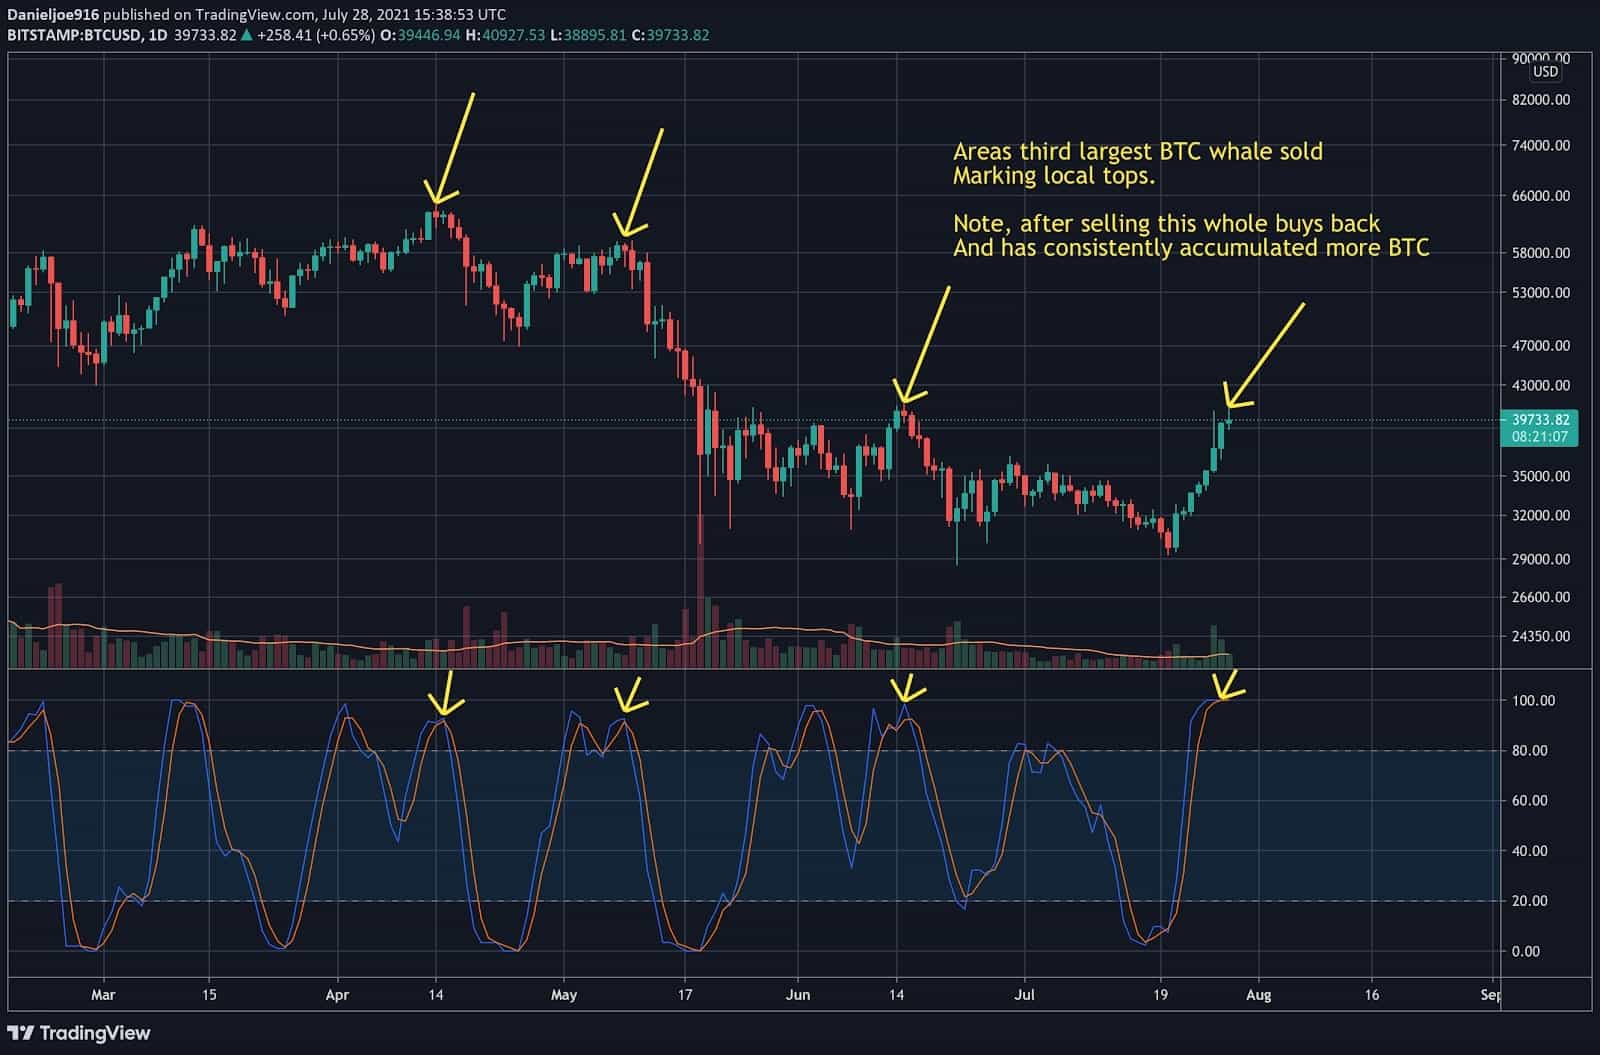
The second technical signal is the 4-hour TD Sequential indicator flashing the 9th candle. This means BTC rallied higher for 9 consecutive candles in a row on the 4-hour chart, signaling the risk of a local top or pullback.
The third technical signal is the 4-hour relative strength index hitting overbought conditions such as a reading above 70.
The fourth technical signal flashes a warning when the 4 hour and daily chart is at or above the upper band on the Bollinger Band. The Bollinger Band measures standard deviations of price movement from a specified moving average.
In aggregate, when the above-listed indicators and metrics are flashing signals, it signals the risk of a local top or incoming pullback for BTC. This does not mean BTC will crash, it just means the price is overheated, and in particular, the whale entity could be looking to sell, which will likely prevent the price from rising in the near term. It’s important to factor in other forms of analysis to ensure a more accurate signal.
As previous activity has shown, the whale entity has always bought back its position after selling and continues to net accumulate BTC over time. The Onchain and Technical signals near-term risk to the downside, but the long-term trend remains firmly bullish.