In an indecisive spot market, the low liquidity in the order book allows the aggressive traders to take control, leading to unexpected volatility. Currently, the futures market may see more liquidations before any price recovery. Technical Analysis Daily Timeframe The image below shows that bitcoin is in a strong downtrend, and the bears are in charge. However, we’re in a zone that can hold the price for a few days or even weeks. Additionally, the RSI indicator, which helps us gauge the price momentum (currently
Topics:
CryptoVizArt considers the following as important: Bitcoin (BTC) Price, BTC Analysis, BTCEUR, BTCGBP, btcusd, btcusdt
This could be interesting, too:
Chayanika Deka writes XRP, SOL, and ADA Inclusion in US Crypto Reserve Pushes Traders on Edge
Chayanika Deka writes Why Arthur Hayes Is Bullish on Bitcoin Under Trump’s Economic Strategy
Mandy Williams writes Why the Bitcoin Market Is Stuck—and the Key Metric That Could Change It: CryptoQuant CEO
Wayne Jones writes Metaplanet Acquires 156 BTC, Bringing Total Holdings to 2,391
In an indecisive spot market, the low liquidity in the order book allows the aggressive traders to take control, leading to unexpected volatility. Currently, the futures market may see more liquidations before any price recovery.
Technical Analysis
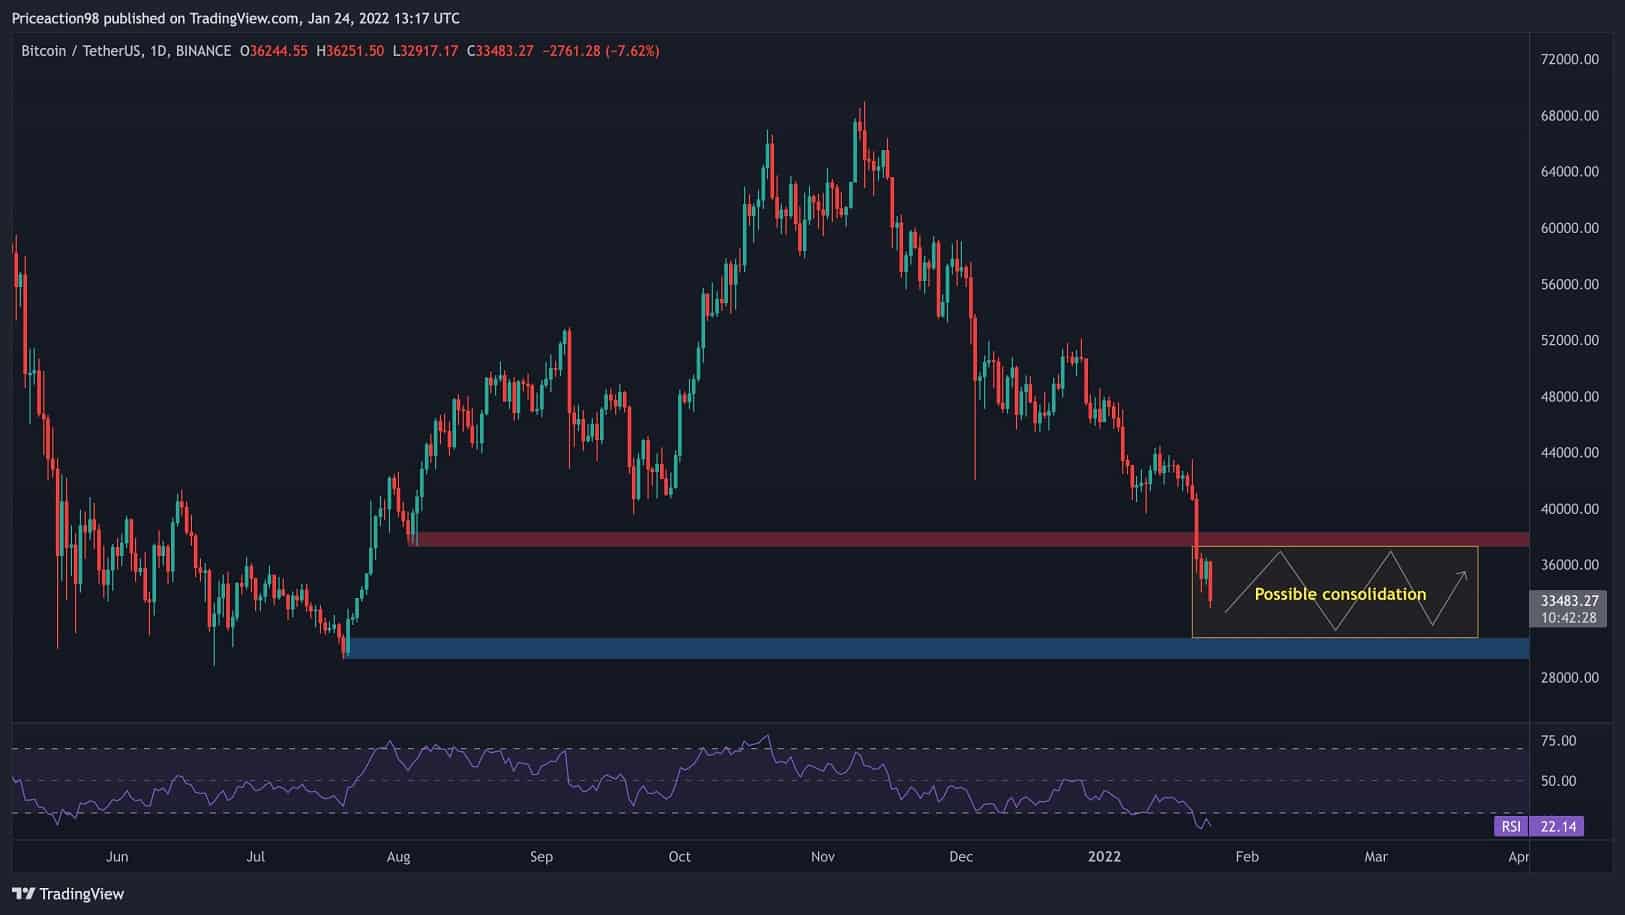
Daily Timeframe
The image below shows that bitcoin is in a strong downtrend, and the bears are in charge. However, we’re in a zone that can hold the price for a few days or even weeks. Additionally, the RSI indicator, which helps us gauge the price momentum (currently <20), shows that the market is in a “Strong Oversold” phase.
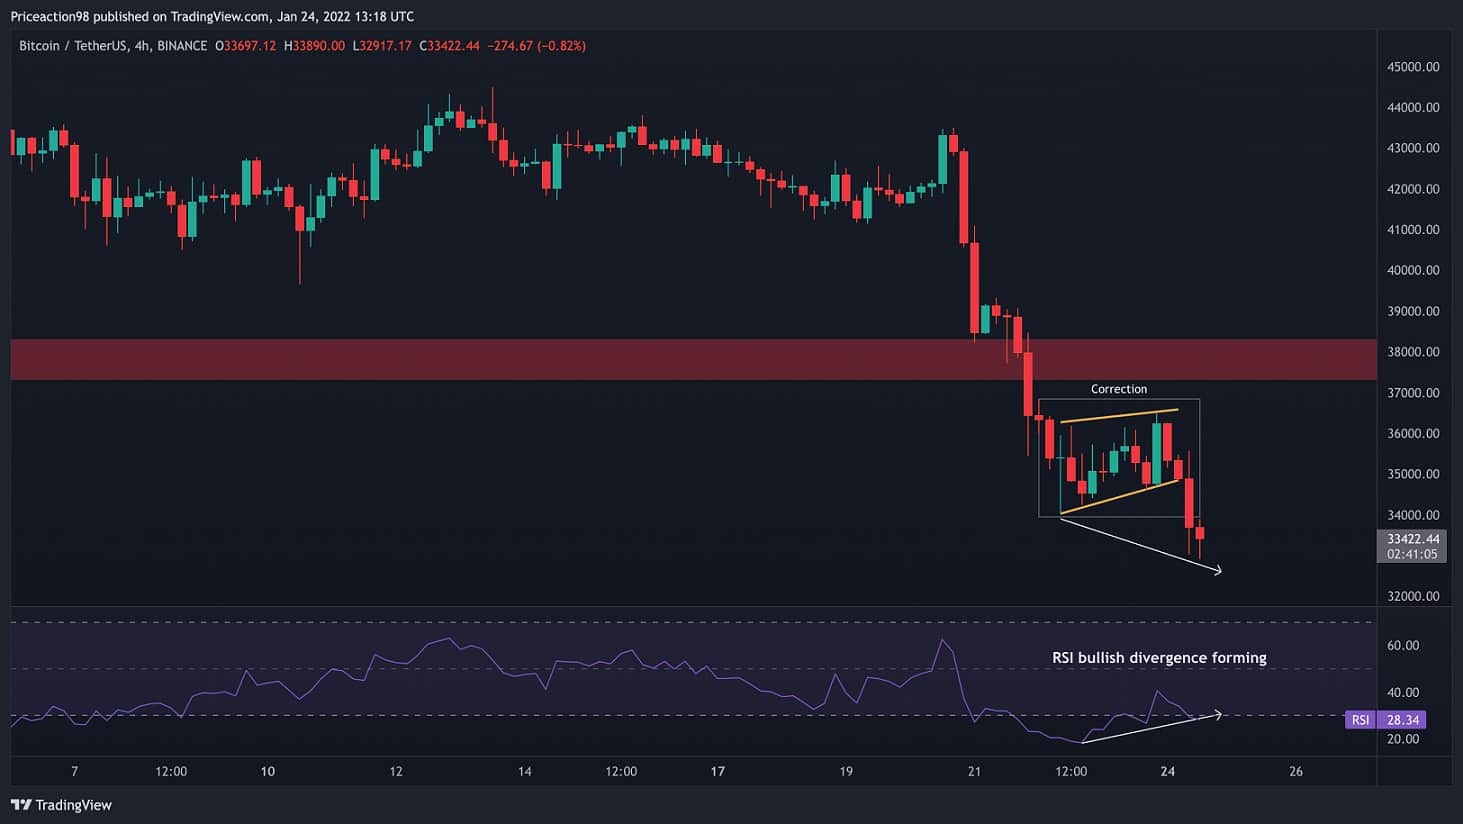
4-Hour Timeframe
On the 4-hour timeframe, we can observe that the price formed a continuation pattern followed by another bearish impulse after the bearish flag breakout.
It’s also clear that RSI is probably creating a bullish divergence, indicating that the price is likely to consolidate in the short term. It’s important to monitor the market in the next few days to determine if the price has formed an accumulation/distribution pattern to forecast future action.
Onchain Analysis
By Shayan
Retail traders tend to enter high-leverage positions in futures markets. This behavior indicates a market with an excessive appetite for risk and leverage. Naturally, when the bitcoin price is falling, the high-risk positions vulnerable to volatility will cause a cascade of liquidations.
Following the sentiment of the futures market in June-July 2021, a significant drop in open interest (OI) is crucial before any price recovery.
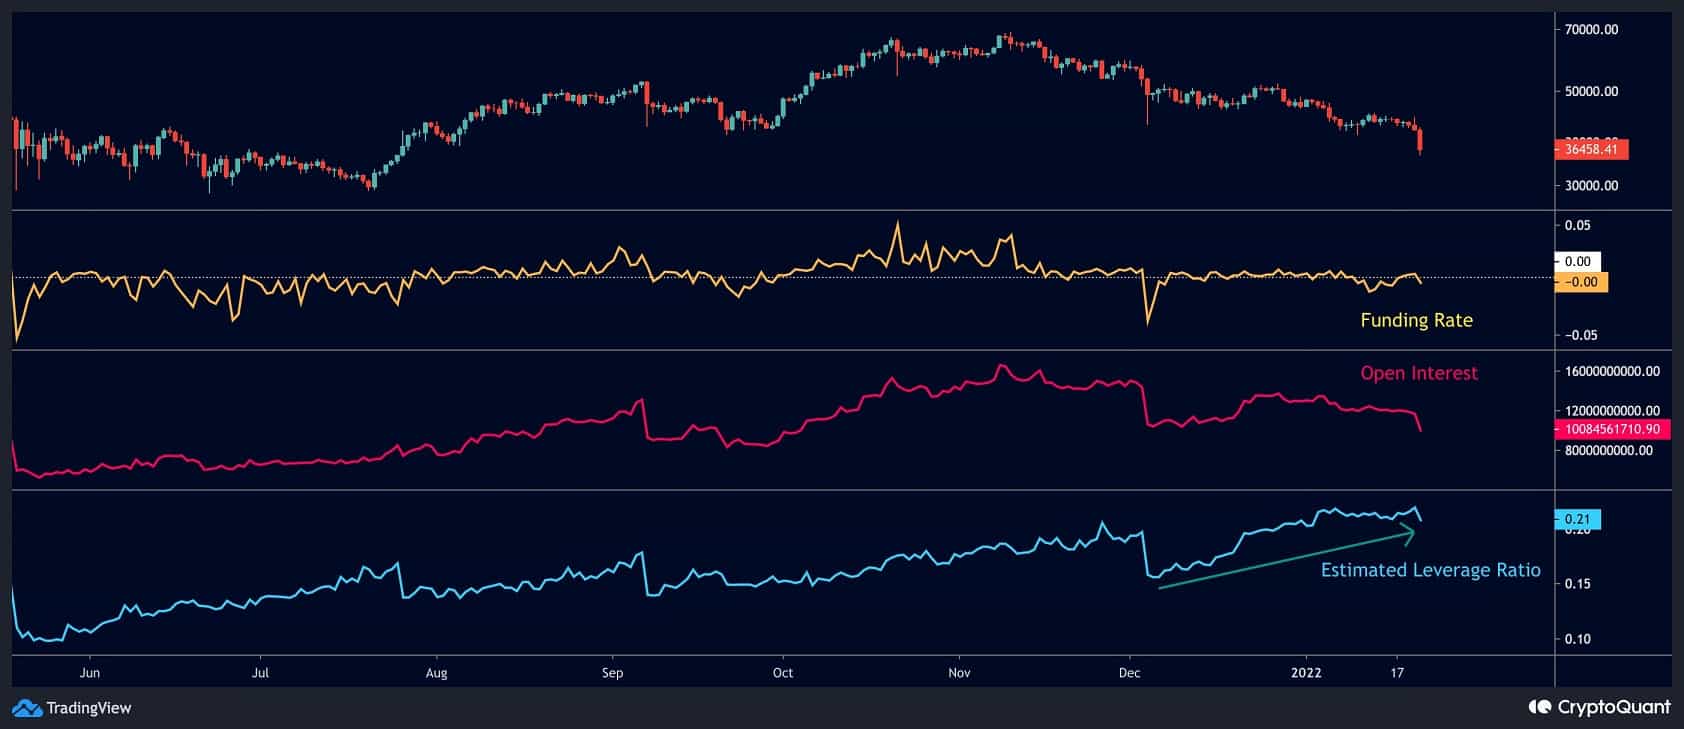
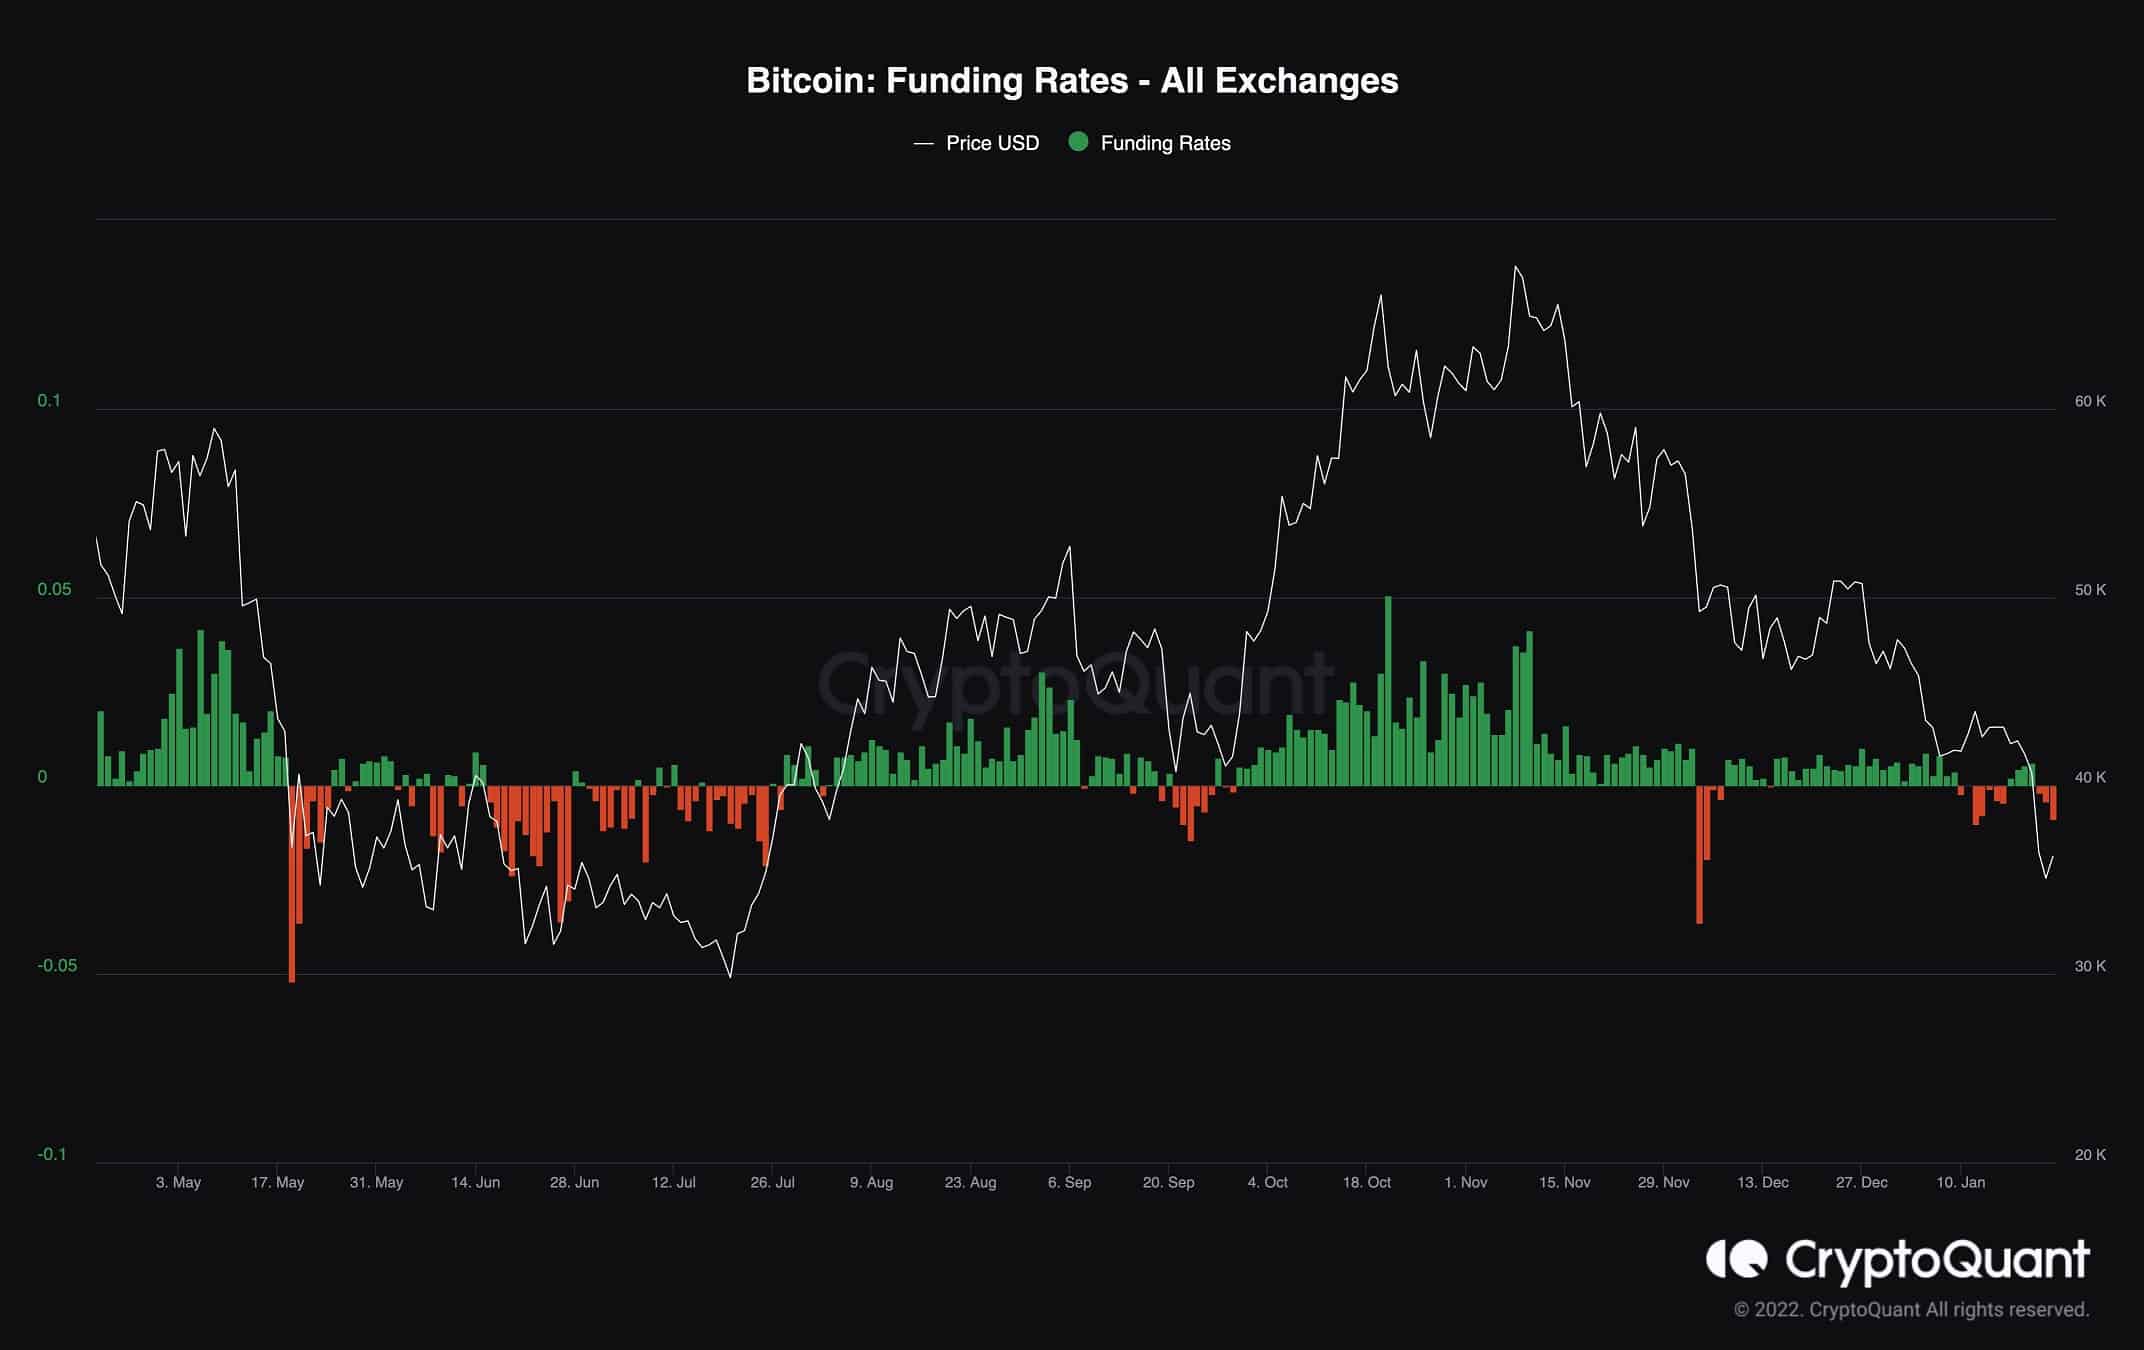
A sharp decline in both OI and ELR metrics, as well as a long period of negative funding rate, are the necessary signals for a market recovery.
The technical analysis was made for CryptoPotato by Edris, while the on-chain analysis was prepared by Shayan.