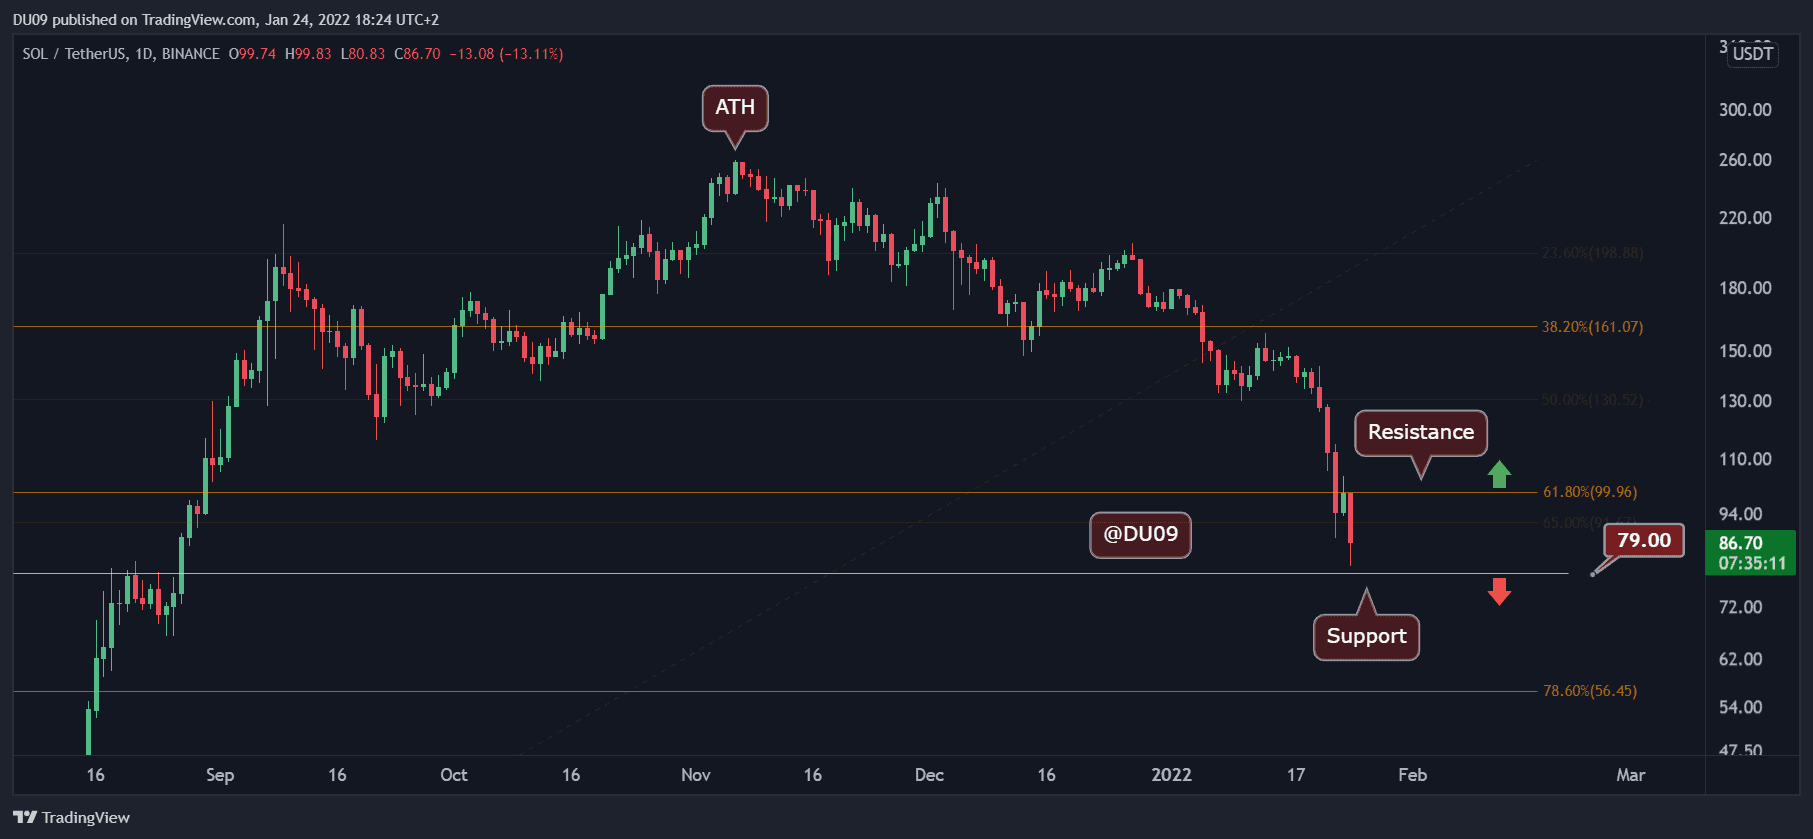
Over the weekend, SOL lost the 0 support level, which turned it into resistance. Unsurprisingly, following the negative sentiment, the SOL price dropped today to . Key Support levels: , Key Resistance level: 0, 0 On Sunday, SOL rejected attempting to break above 0 and, by doing so, confirmed the level as resistance. Earlier today, the price took a nosedive reaching for a short period before a slight recovery. -80 support likely be tested again if buyers do not place orders. However, SOL is extremely oversold right now, and a temp correction may take place at any moment in the next hours or days. Chart by TradingViewTechnical Indicators Trading Volume: Selling volume was very high over the past four days, a bad sign for the bulls, but follows
Topics:
Duo Nine considers the following as important: Price Analysis, Solana (SOL) Price, SOLBTC, SOLUSD
This could be interesting, too:
Jordan Lyanchev writes Trump Confirms Work on Strategic Crypto Reserve: XRP, ADA, SOL Included
Chayanika Deka writes Bitcoin Ends Week with 5M Inflows as Multi-Asset Products Face 1M in Losses
Wayne Jones writes Solana Surpasses Ethereum as Top Ecosystem for New Developers in 2024: Report
Jordan Lyanchev writes Solana Whales Begin Accumulation Spree Amid Predictions of SOL at 0
Over the weekend, SOL lost the $100 support level, which turned it into resistance. Unsurprisingly, following the negative sentiment, the SOL price dropped today to $80.
Key Support levels: $79, $56
Key Resistance level: $100, $130
On Sunday, SOL rejected attempting to break above $100 and, by doing so, confirmed the level as resistance. Earlier today, the price took a nosedive reaching $80 for a short period before a slight recovery.
$79-80 support likely be tested again if buyers do not place orders. However, SOL is extremely oversold right now, and a temp correction may take place at any moment in the next hours or days.
Technical Indicators
Trading Volume: Selling volume was very high over the past four days, a bad sign for the bulls, but follows the overall market sentiment, along with fundamental reasons regarding the Solana network conjunctions.
RSI: The RSI has entered the oversold area at 20 points on the daily timeframe. Such a low RSI level was not seen since December 2020, which is extremely low. The RSI rarely stayed at such levels for long.
MACD: The daily MACD has been bearish for almost a week and there are no signs that this condition will end any time soon. Both the histogram and moving averages are making lower lows.

Bias
The current bias is bearish. SOL is currently suffering from an extreme sell-off, which might trigger a temp correction towards $100.
Short-Term Prediction for SOL Price
At some point, the sellers will become exhausted and it will be too costly to continue to push price lower in terms of risk/reward ratio. At that point, SOL has a good chance to enter a strong relief rally that can take it back towards $100 or above.
Until that happens, the sellers have the upper hand and the critical support at $79 must hold to reverse this downtrend.