Though the major static and dynamic support lines failed on a daily time frame, the long-term holders’ sell pressure (inflows to all exchanges) was reduced after failing the K support levels. A consolidation phase in the K-K range is the most expected behavior for the mid-term window. Technical Analysis By: Edris Long-Term Bitcoin price has lost two significant supports in the last couple of days, and the hopes for a recovery turned into fear. BTC is currently trading below the k mark and the 50-day moving average, both key levels were broken in the recent upside move. The following critical level to watch would be the k area. Having enough demand, a reversal towards the k resistance and the 50-day moving average could be anticipated. Source:
Topics:
CryptoVizArt considers the following as important: Bitcoin (BTC) Price, BTC Analysis, BTCEUR, BTCGBP, btcusd, btcusdt
This could be interesting, too:
Chayanika Deka writes XRP, SOL, and ADA Inclusion in US Crypto Reserve Pushes Traders on Edge
Chayanika Deka writes Why Arthur Hayes Is Bullish on Bitcoin Under Trump’s Economic Strategy
Mandy Williams writes Why the Bitcoin Market Is Stuck—and the Key Metric That Could Change It: CryptoQuant CEO
Wayne Jones writes Metaplanet Acquires 156 BTC, Bringing Total Holdings to 2,391
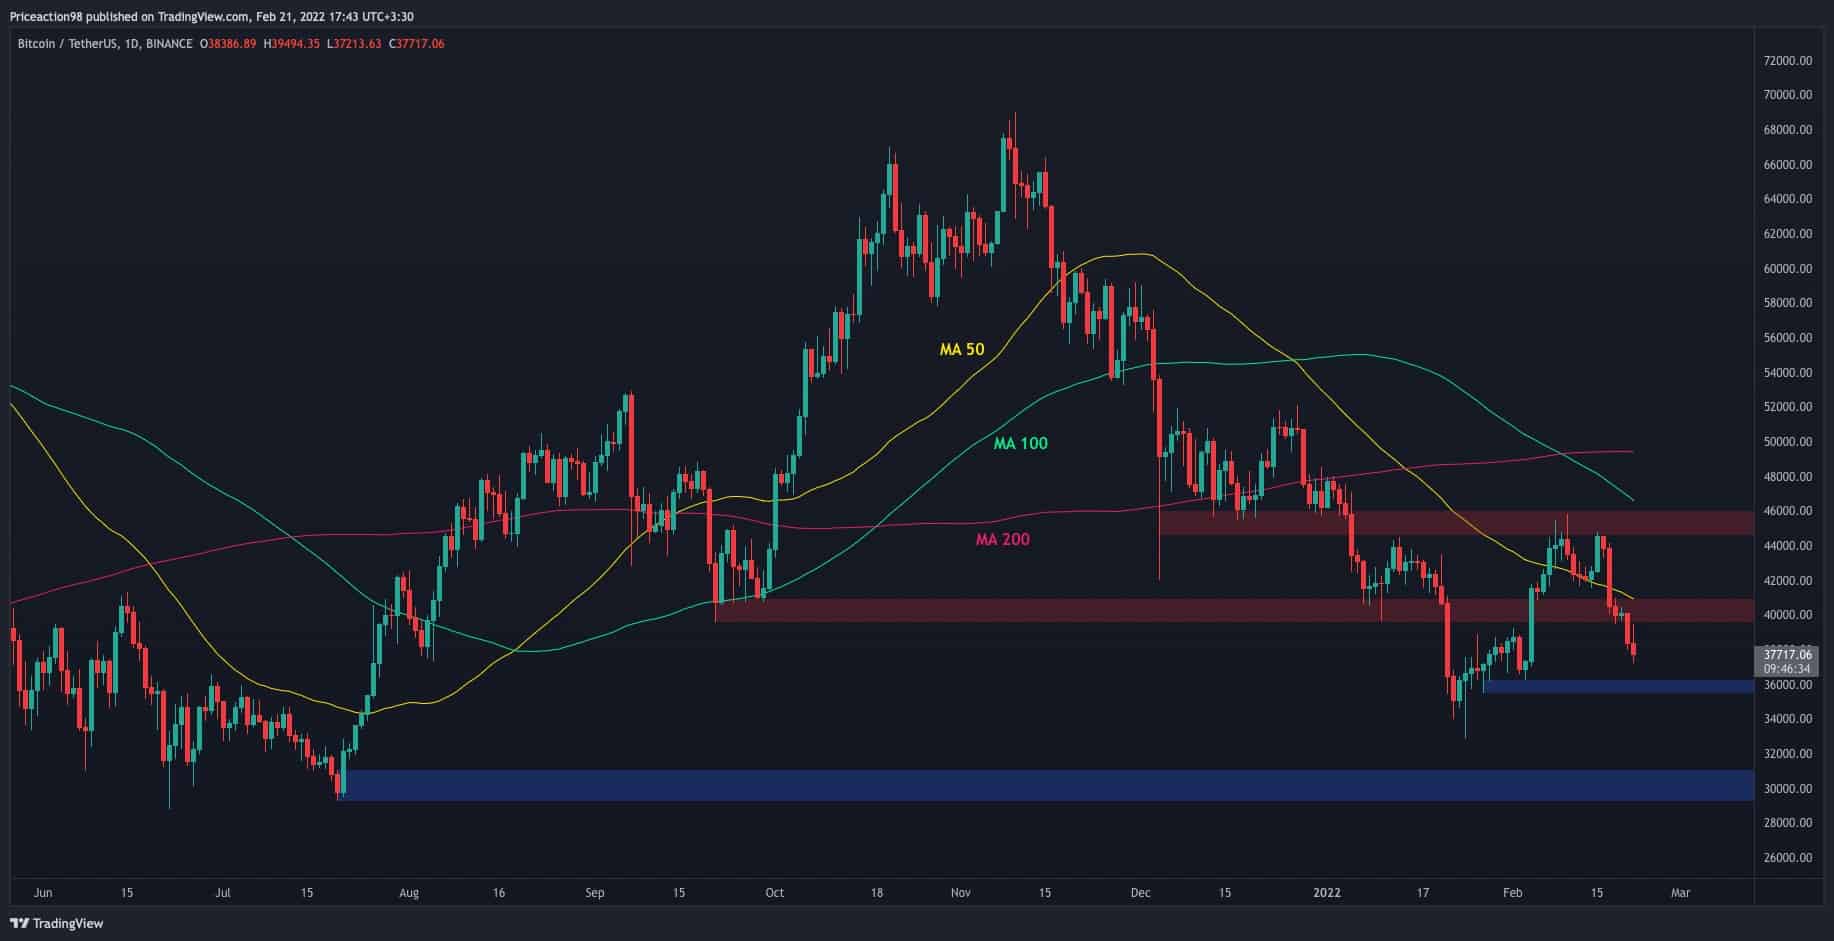
Though the major static and dynamic support lines failed on a daily time frame, the long-term holders’ sell pressure (inflows to all exchanges) was reduced after failing the $39K support levels. A consolidation phase in the $36K-$40K range is the most expected behavior for the mid-term window.
Technical Analysis
By: Edris
Long-Term
Bitcoin price has lost two significant supports in the last couple of days, and the hopes for a recovery turned into fear. BTC is currently trading below the $40k mark and the 50-day moving average, both key levels were broken in the recent upside move. The following critical level to watch would be the $36k area. Having enough demand, a reversal towards the $40k resistance and the 50-day moving average could be anticipated.
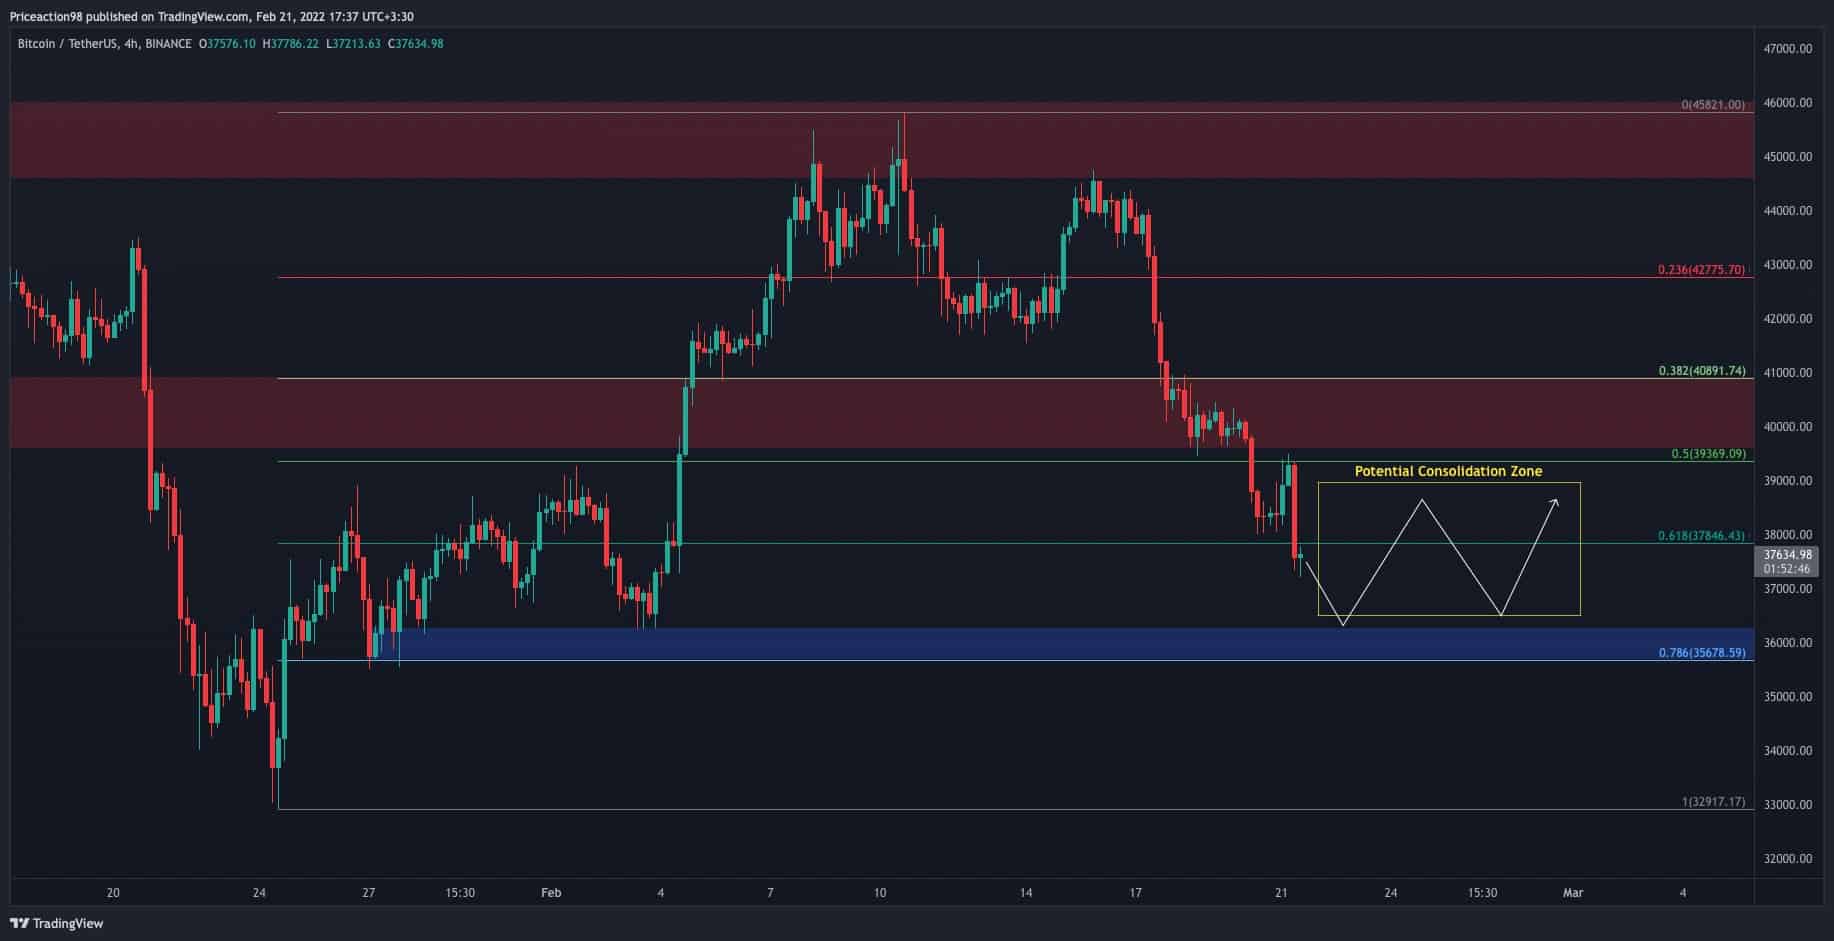
Short-Term
The bearish momentum seems overwhelming on the 4-hour time frame as the price has been breaking below supports with ease. However, it is currently trading in a key Fibonacci retracement zone (between 50% and 78.6%) which could potentially halt the drop in the short term. So, a consolidation phase is expected in the next couple of days where the bulls and bears collide between the $36k and $40k levels.
Onchain Analysis
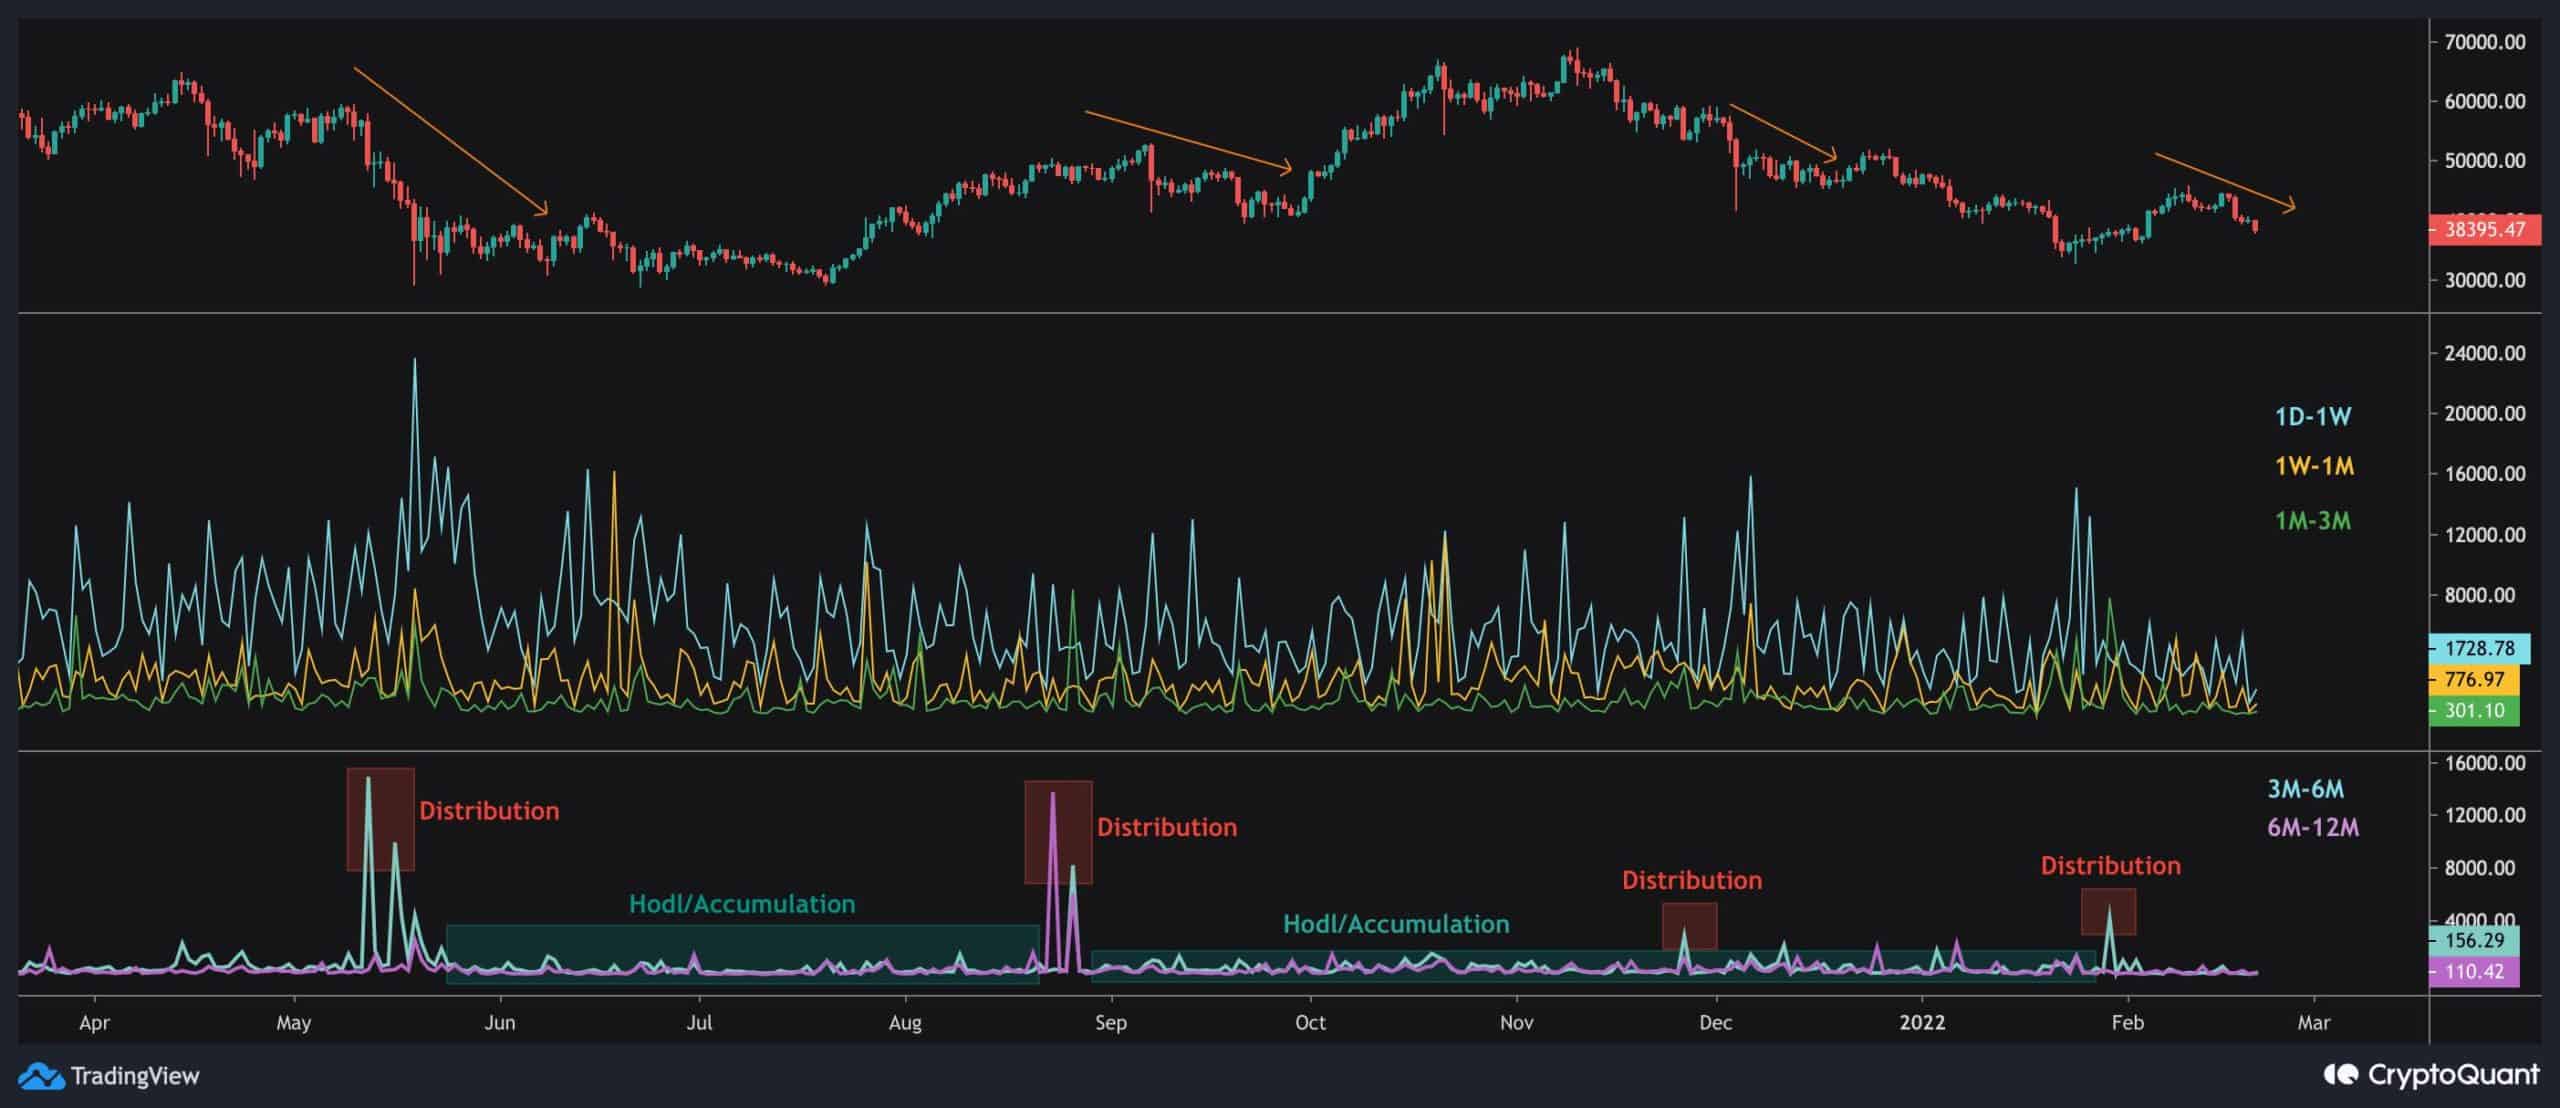
By: Shayan
Here, the inflow to all exchanges is divided into various age bands illustrated in the graph. Interestingly, each time the inflow of 6M-12M old coins surged, the market has witnessed a shakeout. This structure can be interpreted as long/mid-term holders’ distribution through recoveries.
On the other hand, short-term investors have displayed a lot of panic selling during bearish periods. Investigating the short-term holders’ behavior (<3M), most inflows to the exchanges come from 1D-1M holders, also known as “retailers.” After breaking below the $39K, long-term holders’ selling pressure is diminishing and mostly shifting to accumulating.