Key Support level: %excerpt%.70 Key Resistance levels: %excerpt%.96, Despite high volatility and bears pushing the market in the red, XRP has managed to remains somewhat stable and continued to consolidate in the blue pennant (represented in blue on the below chart). Price remains in a key range between %excerpt%.70 as support and %excerpt%.96 as resistance. However, selling pressure is building up, and if XRP buyers can’t absorb it, then the cryptocurrency may fall to the critical support. Chart by TradingViewTechnical Indicators Trading Volume: The volume remains flat with an equal distribution between buyers and sellers. But this fragile balance may break soon. RSI: The daily RSI is making lower lows and lower highs. This is bearish and may lead to sellers taking over soon. MACD: The daily MACD
Topics:
Duo Nine considers the following as important: Ripple (XRP) Price, XRP Analysis, xrpbtc, xrpusd
This could be interesting, too:
Jordan Lyanchev writes Ripple’s (XRP) Surge to Triggers Over Million in Short Liquidations
Jordan Lyanchev writes Trump Confirms Work on Strategic Crypto Reserve: XRP, ADA, SOL Included
Dimitar Dzhondzhorov writes Is a Major Ripple v. SEC Lawsuit Development Expected This Week? Here’s Why
Mandy Williams writes Ripple Releases Institutional DeFi Roadmap for XRP Ledger in 2025
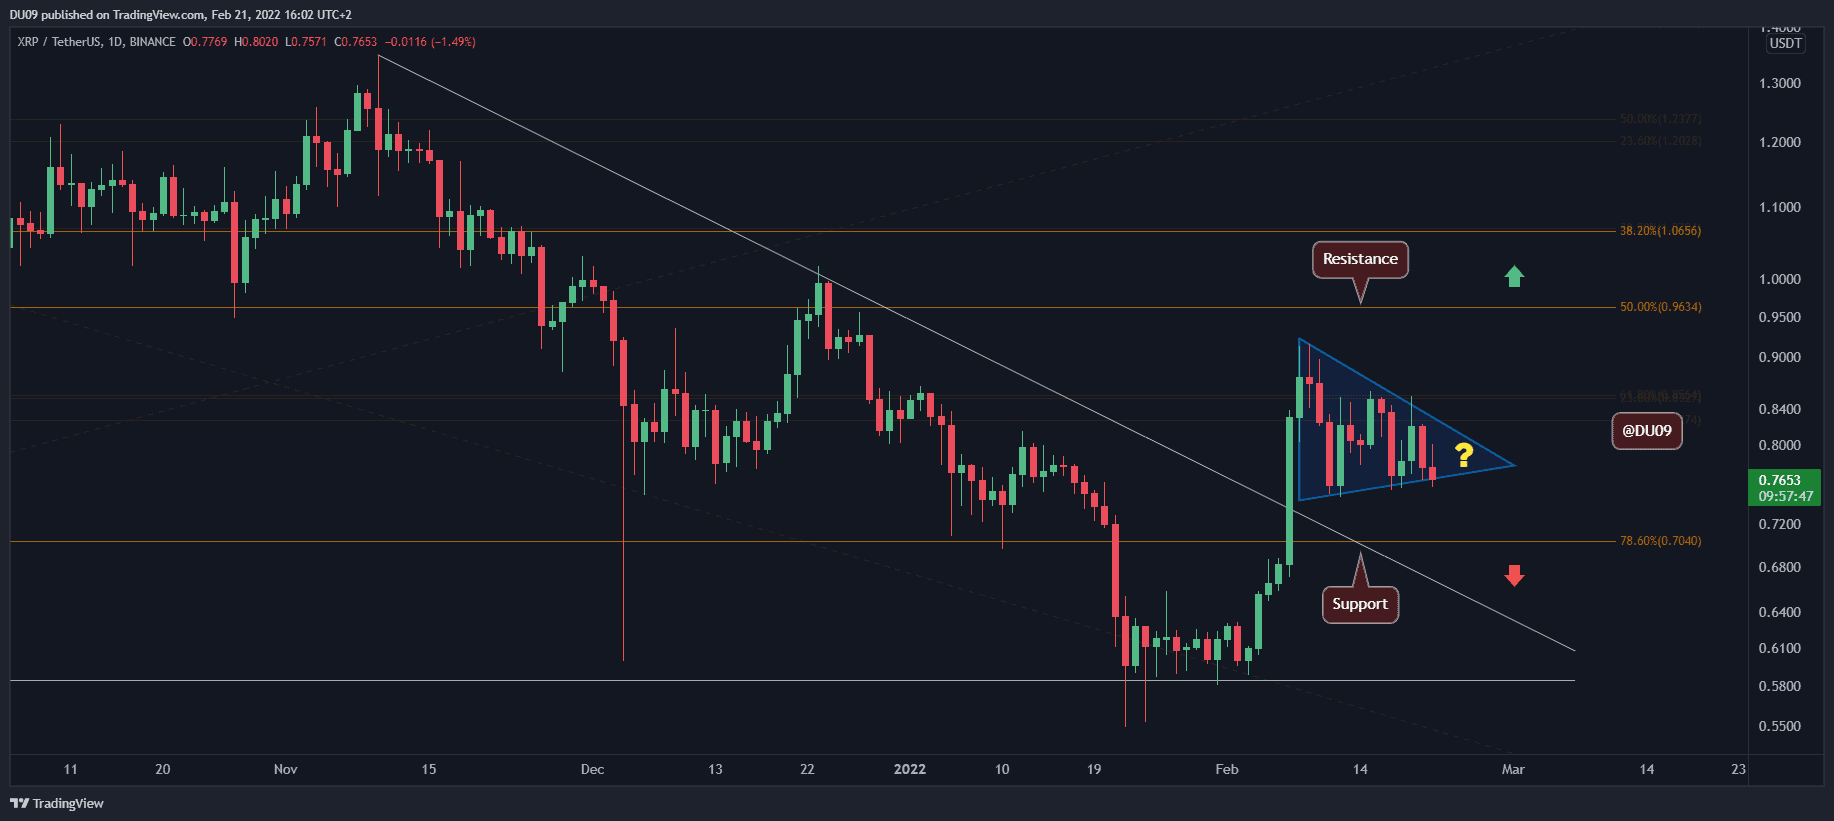
Key Support level: $0.70
Key Resistance levels: $0.96, $1
Despite high volatility and bears pushing the market in the red, XRP has managed to remains somewhat stable and continued to consolidate in the blue pennant (represented in blue on the below chart). Price remains in a key range between $0.70 as support and $0.96 as resistance.
However, selling pressure is building up, and if XRP buyers can’t absorb it, then the cryptocurrency may fall to the critical support.
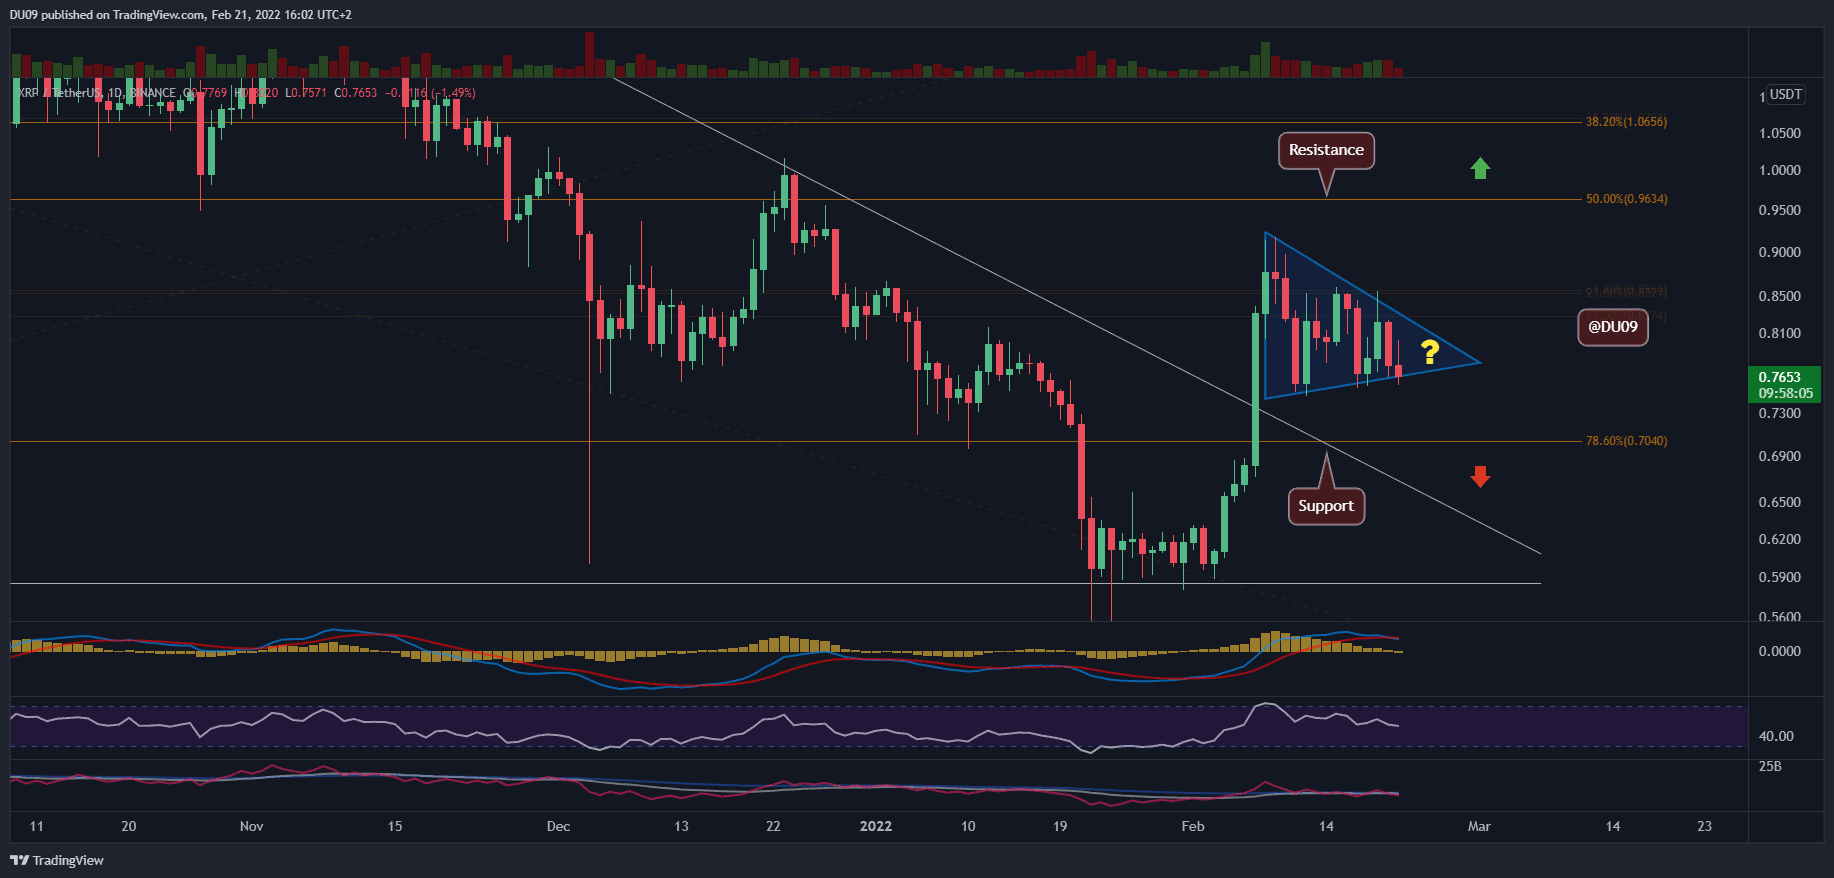
Technical Indicators
Trading Volume: The volume remains flat with an equal distribution between buyers and sellers. But this fragile balance may break soon.
RSI: The daily RSI is making lower lows and lower highs. This is bearish and may lead to sellers taking over soon.
MACD: The daily MACD just completed a bearish cross today. This is not good news. For this reason, XRP’s price can drop back to the key support at $0.70.
Bias
The current XRP bias is slightly bearish bearing in mind the indicators.
Short-Term Prediction for XRP Price
If the current momentum intensifies, then XRP is likely to fall to the key support at $0.70. The indicators are turning negative, and XRP seems vulnerable to a breakdown from the current pennant.