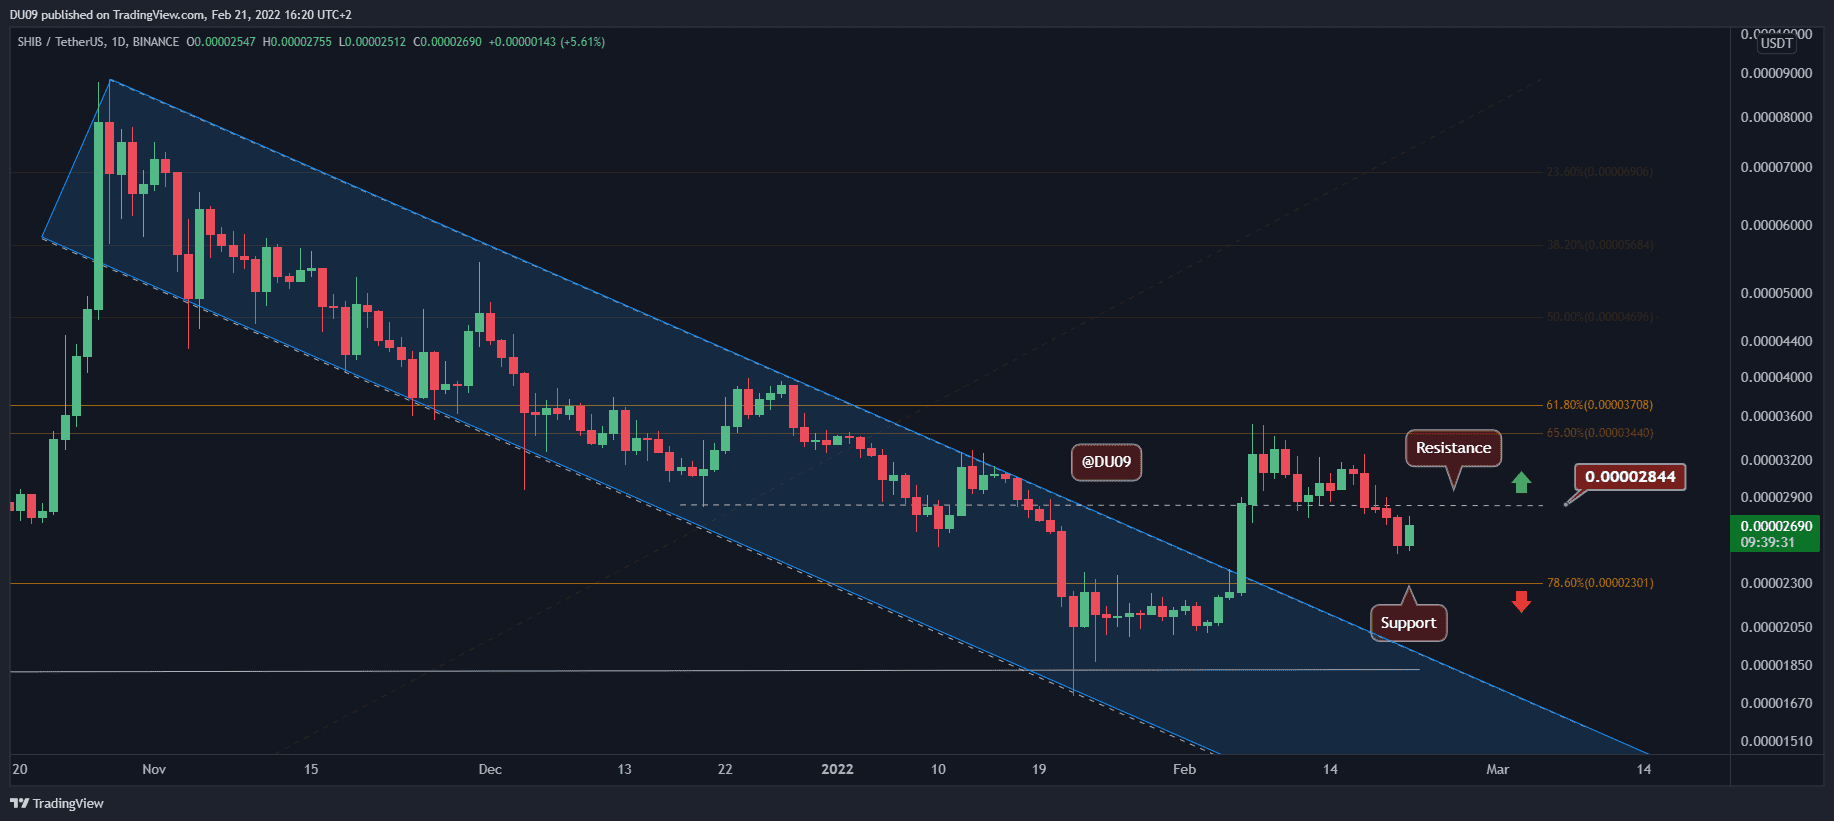
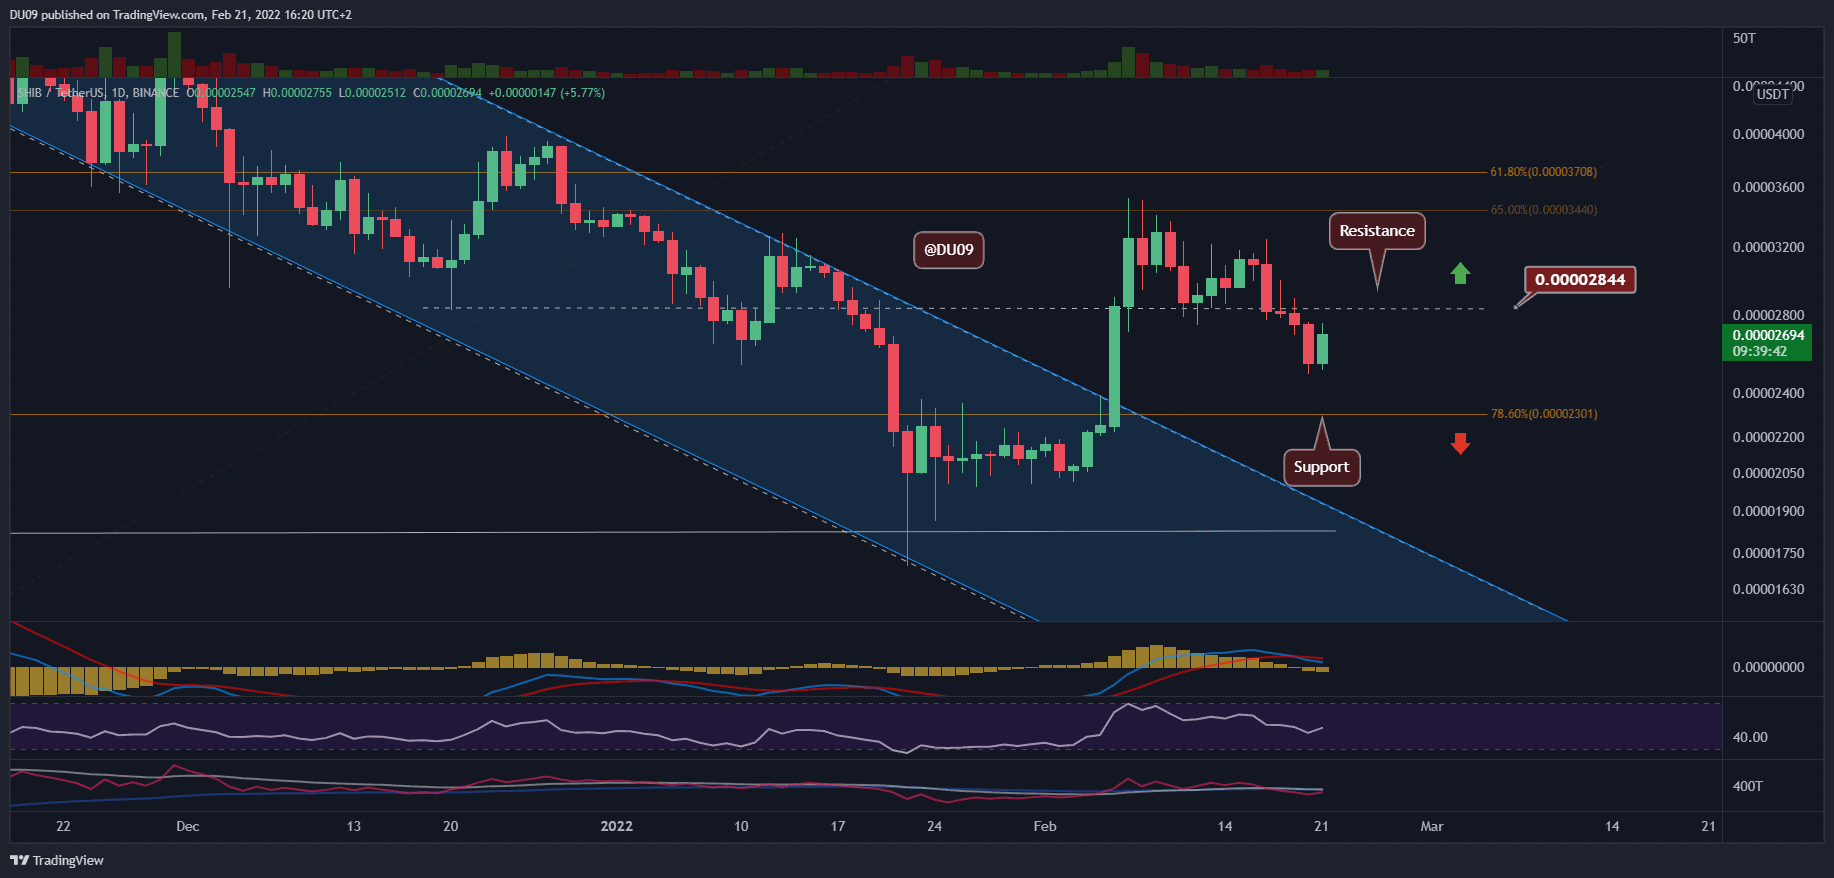
Key Support level: %excerpt%.000023 Key Resistance levels: %excerpt%.000028 SHIB fell below the critical level at %excerpt%.000028, which has now turned into resistance. The next support is found at %excerpt%.000023. The current downtrend in price is unlikely to stop until SHIB reaches the key support. Chart by TradingViewTechnical Indicators Trading Volume: The volume remains low and gives no indication of recovery. Sellers have dominated the chart so far. RSI: The daily RSI fell under 50 points and is making lower lows and lower highs. This is a clear bearish sign. MACD: The daily MACD completed a bearish crossover yesterday. This may be the start of a more significant correction. Chart by TradingViewBias The bias on SHIB is bearish. Short-Term Prediction for SHIB Price At this point, it looks like
Topics:
Duo Nine considers the following as important: Price Analysis, Shiba Inu (SHIB), SHIBBTC, SHIBUSD
This could be interesting, too:
Jordan Lyanchev writes Shiba Inu Price Forecasts: Another 50% Crash or 420% Rally Ahead for SHIB?
Dimitar Dzhondzhorov writes This Trader Made Over Million by Selling Shiba Inu (SHIB) Holdings: Details
Dimitar Dzhondzhorov writes Shiba Inu (SHIB) Drops by 15% in 2 Weeks: These Factors Suggest Extended Correction
Jordan Lyanchev writes Meme Coin Bloodbath: BONK, FLOKI, WIF, SHIB, and DOGE Crash by Double Digits
Key Support level: $0.000023
Key Resistance levels: $0.000028
SHIB fell below the critical level at $0.000028, which has now turned into resistance. The next support is found at $0.000023. The current downtrend in price is unlikely to stop until SHIB reaches the key support.
Technical Indicators
Trading Volume: The volume remains low and gives no indication of recovery. Sellers have dominated the chart so far.
RSI: The daily RSI fell under 50 points and is making lower lows and lower highs. This is a clear bearish sign.
MACD: The daily MACD completed a bearish crossover yesterday. This may be the start of a more significant correction.
Bias
The bias on SHIB is bearish.
Short-Term Prediction for SHIB Price
At this point, it looks like there’s a possibility to see SHIB reach $0.000023 in the near future as the price searches for support. The current trend is bearish, and this is likely to continue for a while, considering the MACD crossover.