Ripple has not been exempt from the recent decline in the cryptocurrency market. Despite this, XRP paints a different picture against Bitcoin. It’s worth noting that there have been two entirely different outlooks when analyzing the two pairs. In the last 24 hours, the price fell by 8% while increasing by about 3% against Bitcoin. Technical Analysis By Grizzly The Daily Chart The bulls are undeniably weaker than the bears as lower highs, and lower lows are seen in the chart. The long upper wicks in the red candles, as well as the length of their bodies, indicate just how vigorously the bears are guarding those higher levels. In terms of the last day, sellers pushed the pair until close to %excerpt%.31, but the support zone there was able to save XRP once more (in green). This was
Topics:
CryptoVizArt considers the following as important: Ripple (XRP) Price, XRP Analysis, xrpbtc, xrpusd
This could be interesting, too:
Jordan Lyanchev writes Ripple’s (XRP) Surge to Triggers Over Million in Short Liquidations
Jordan Lyanchev writes Trump Confirms Work on Strategic Crypto Reserve: XRP, ADA, SOL Included
Dimitar Dzhondzhorov writes Is a Major Ripple v. SEC Lawsuit Development Expected This Week? Here’s Why
Mandy Williams writes Ripple Releases Institutional DeFi Roadmap for XRP Ledger in 2025
Ripple has not been exempt from the recent decline in the cryptocurrency market. Despite this, XRP paints a different picture against Bitcoin. It’s worth noting that there have been two entirely different outlooks when analyzing the two pairs. In the last 24 hours, the price fell by 8% while increasing by about 3% against Bitcoin.
Technical Analysis
By Grizzly
The Daily Chart
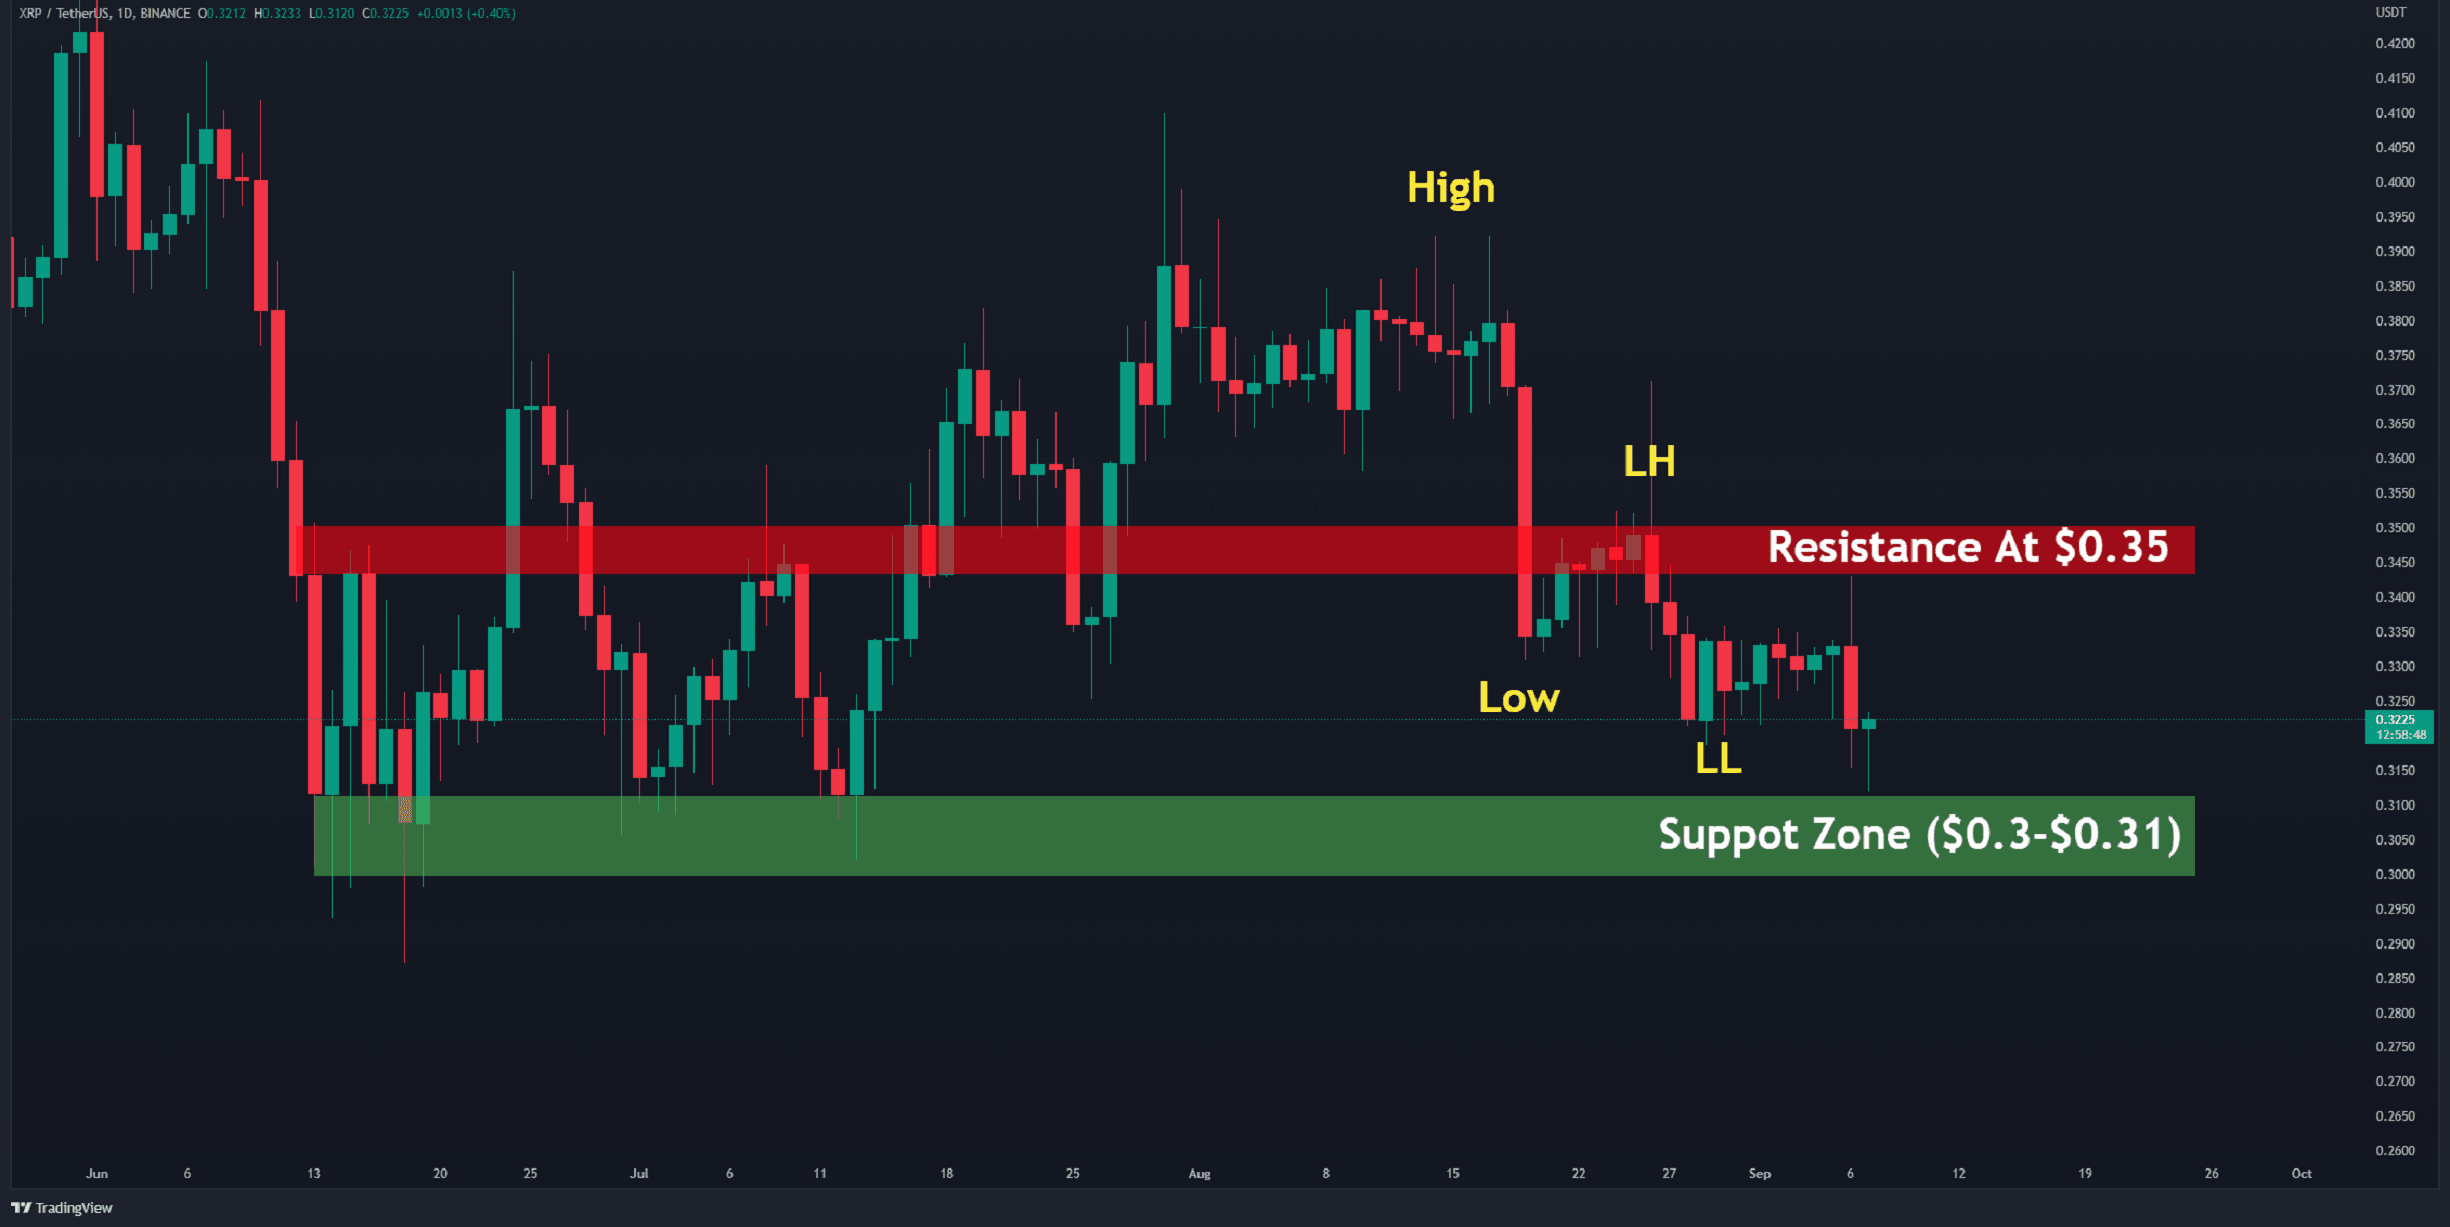
The bulls are undeniably weaker than the bears as lower highs, and lower lows are seen in the chart. The long upper wicks in the red candles, as well as the length of their bodies, indicate just how vigorously the bears are guarding those higher levels.
In terms of the last day, sellers pushed the pair until close to $0.31, but the support zone there was able to save XRP once more (in green). This was reminiscent of June and July.
Given the current market dominance by the bears, it is unlikely that the horizontal resistance at $0.35 will be breached anytime soon. Unless there is a breakout above it, the structure is entirely bearish.
As closing below $0.3 will probably cause numerous stop losses to be triggered, it is crucial to hold the price above that level.
Key Support Levels: $0.30 & $0.24
Key Resistance Levels: $0.35 & $0.40
Daily Moving Averages:
MA20: $0.33
MA50: $0.35
MA100: $0.35
MA200: $0.51
The XRP/BTC Chart
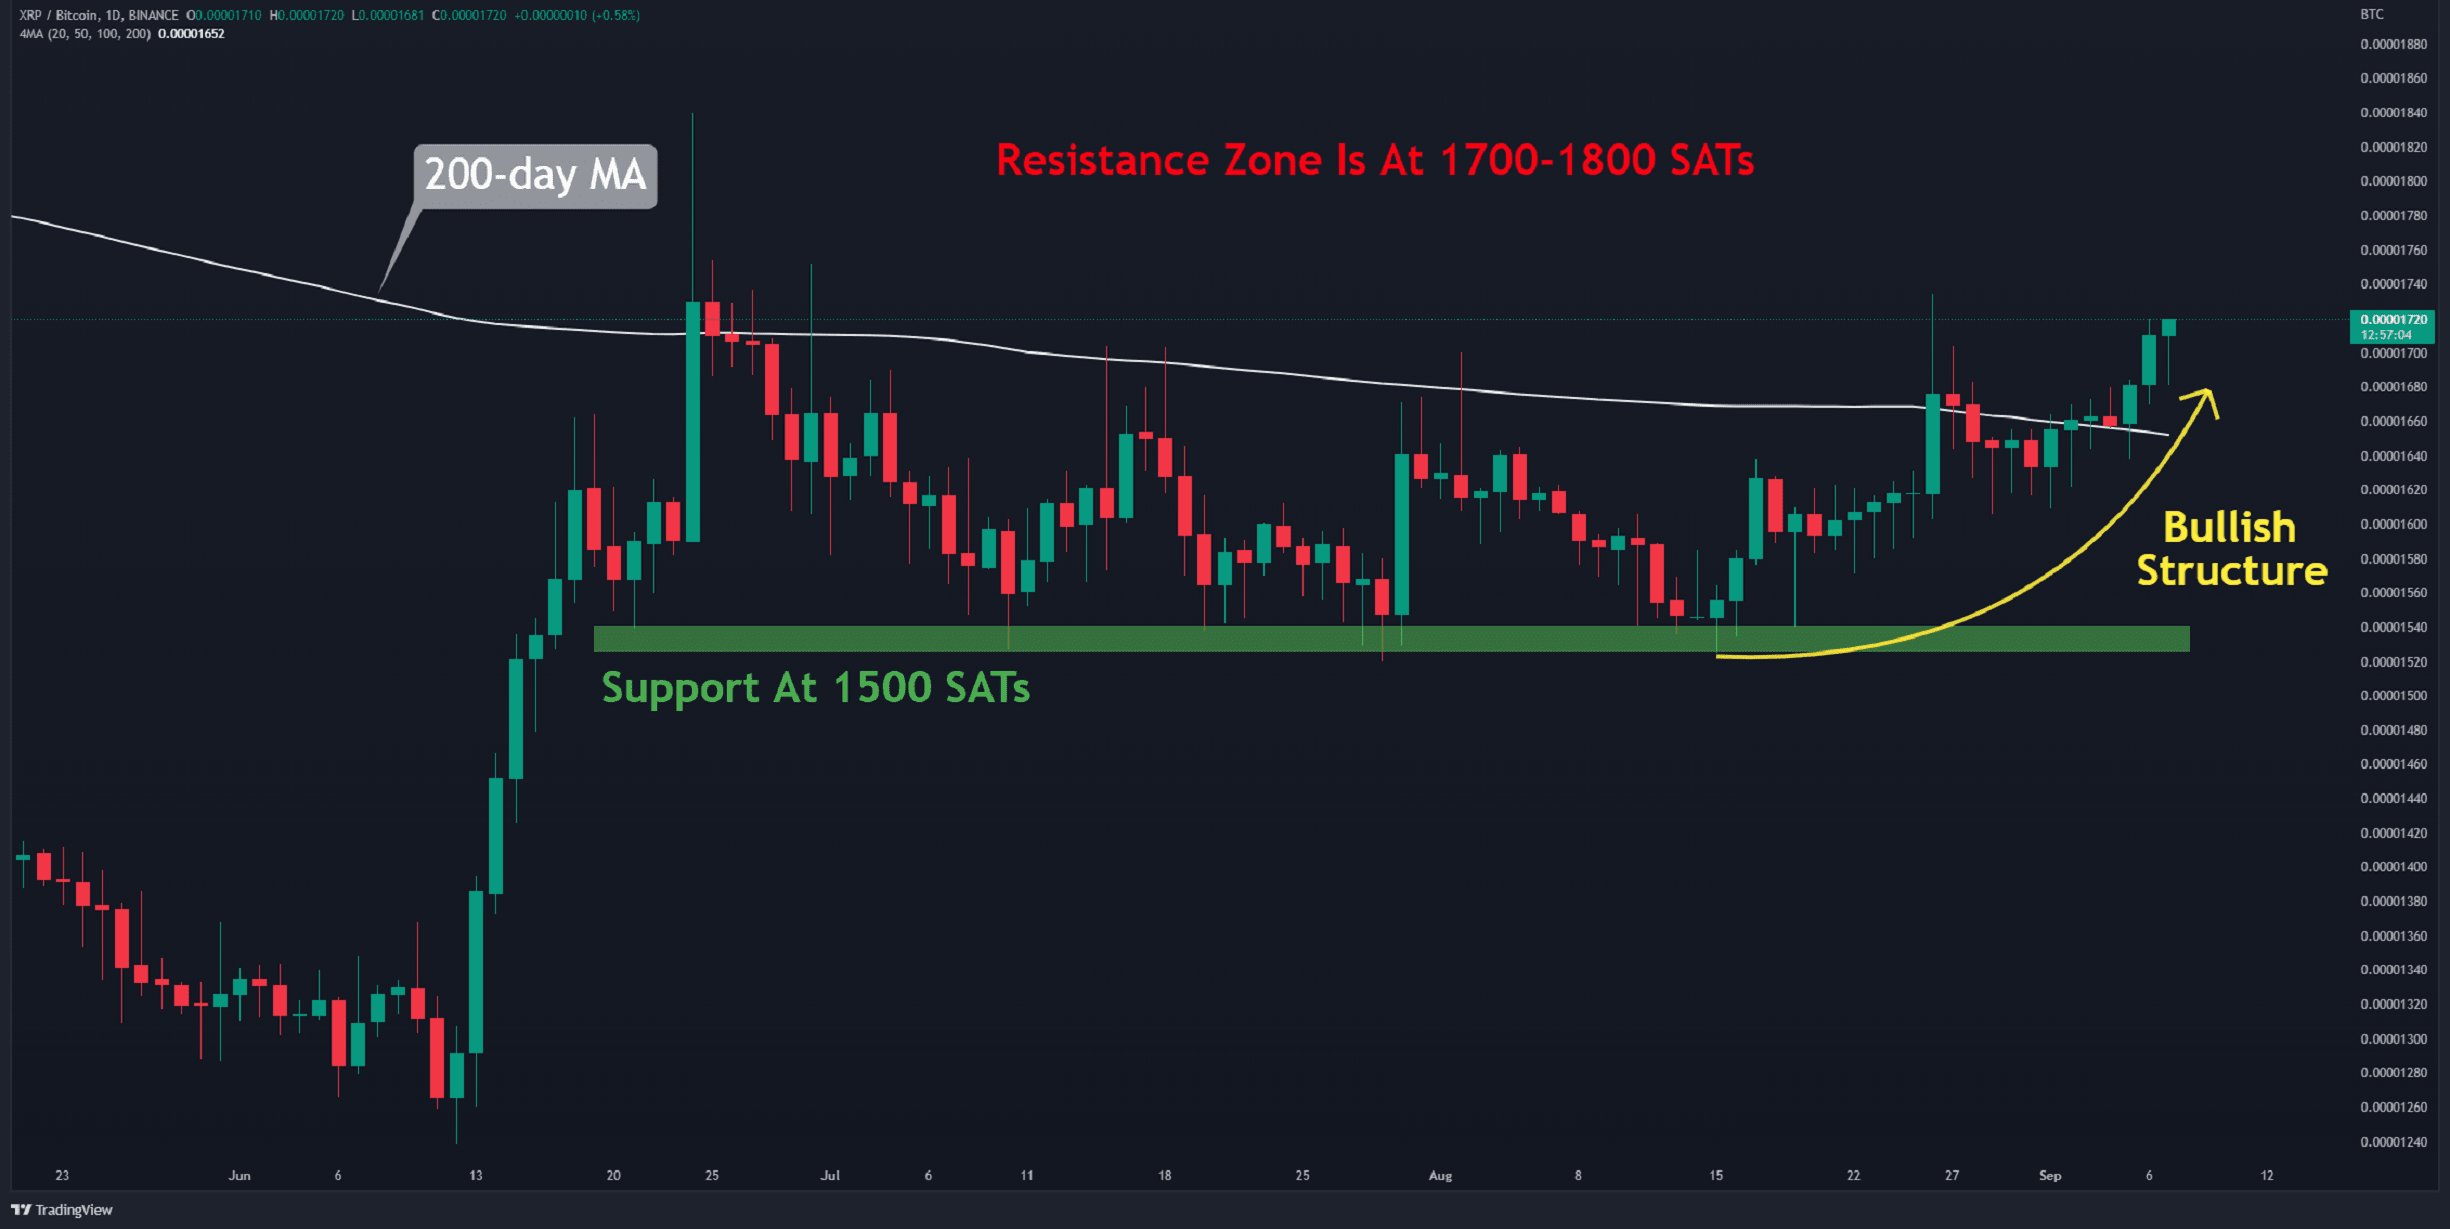
As mentioned earlier, the structure in the XRP/BTC trading pair chart is bullish. Buyers seem likely to close the sixth consecutive candle above the 200-day moving average (in white). The resistance zone between 1700 and 1800 SATs (shown in red) is a strong barrier that the price must overcome, although it hasn’t been able to do so in 75 days.
If the pair can flip this level, a new bullish structure will be established. In this case, a higher high will be formed in the weekly chart, which has not happened since May 2021.
Ripple was no different from the majority of altcoins today in outperforming Bitcoin.
Key Support Levels: 1500 SATs & 1370 SATs
Key Resistance Levels: 1800 SATs & 2100 SATs