Bitcoin’s price has recently fallen below the key K support level. Despite this, investors still have hope that the market will rebound. Technical Analysis By: Edris The Daily Chart: On the daily timeframe, the price has been consolidating above the K level before dropping below it. The 50-day moving average, located around the K mark, is currently providing support for the price. If this level holds, the market will be more likely to rally toward the K resistance zone in the coming months. However, if the mentioned moving average breaks down, the 200-day MA trending near the K area would be the next likely target. Source: TradingViewThe 4-Hour Chart: Looking at the 4-hour chart, the price action becomes clearer. The cryptocurrency is currently breaking
Topics:
CryptoVizArt considers the following as important: Bitcoin (BTC) Price, BTC Analysis, BTCEUR, BTCGBP, btcusd, btcusdt
This could be interesting, too:
Chayanika Deka writes XRP, SOL, and ADA Inclusion in US Crypto Reserve Pushes Traders on Edge
Chayanika Deka writes Why Arthur Hayes Is Bullish on Bitcoin Under Trump’s Economic Strategy
Mandy Williams writes Why the Bitcoin Market Is Stuck—and the Key Metric That Could Change It: CryptoQuant CEO
Wayne Jones writes Metaplanet Acquires 156 BTC, Bringing Total Holdings to 2,391
Bitcoin’s price has recently fallen below the key $30K support level. Despite this, investors still have hope that the market will rebound.
Technical Analysis
By: Edris
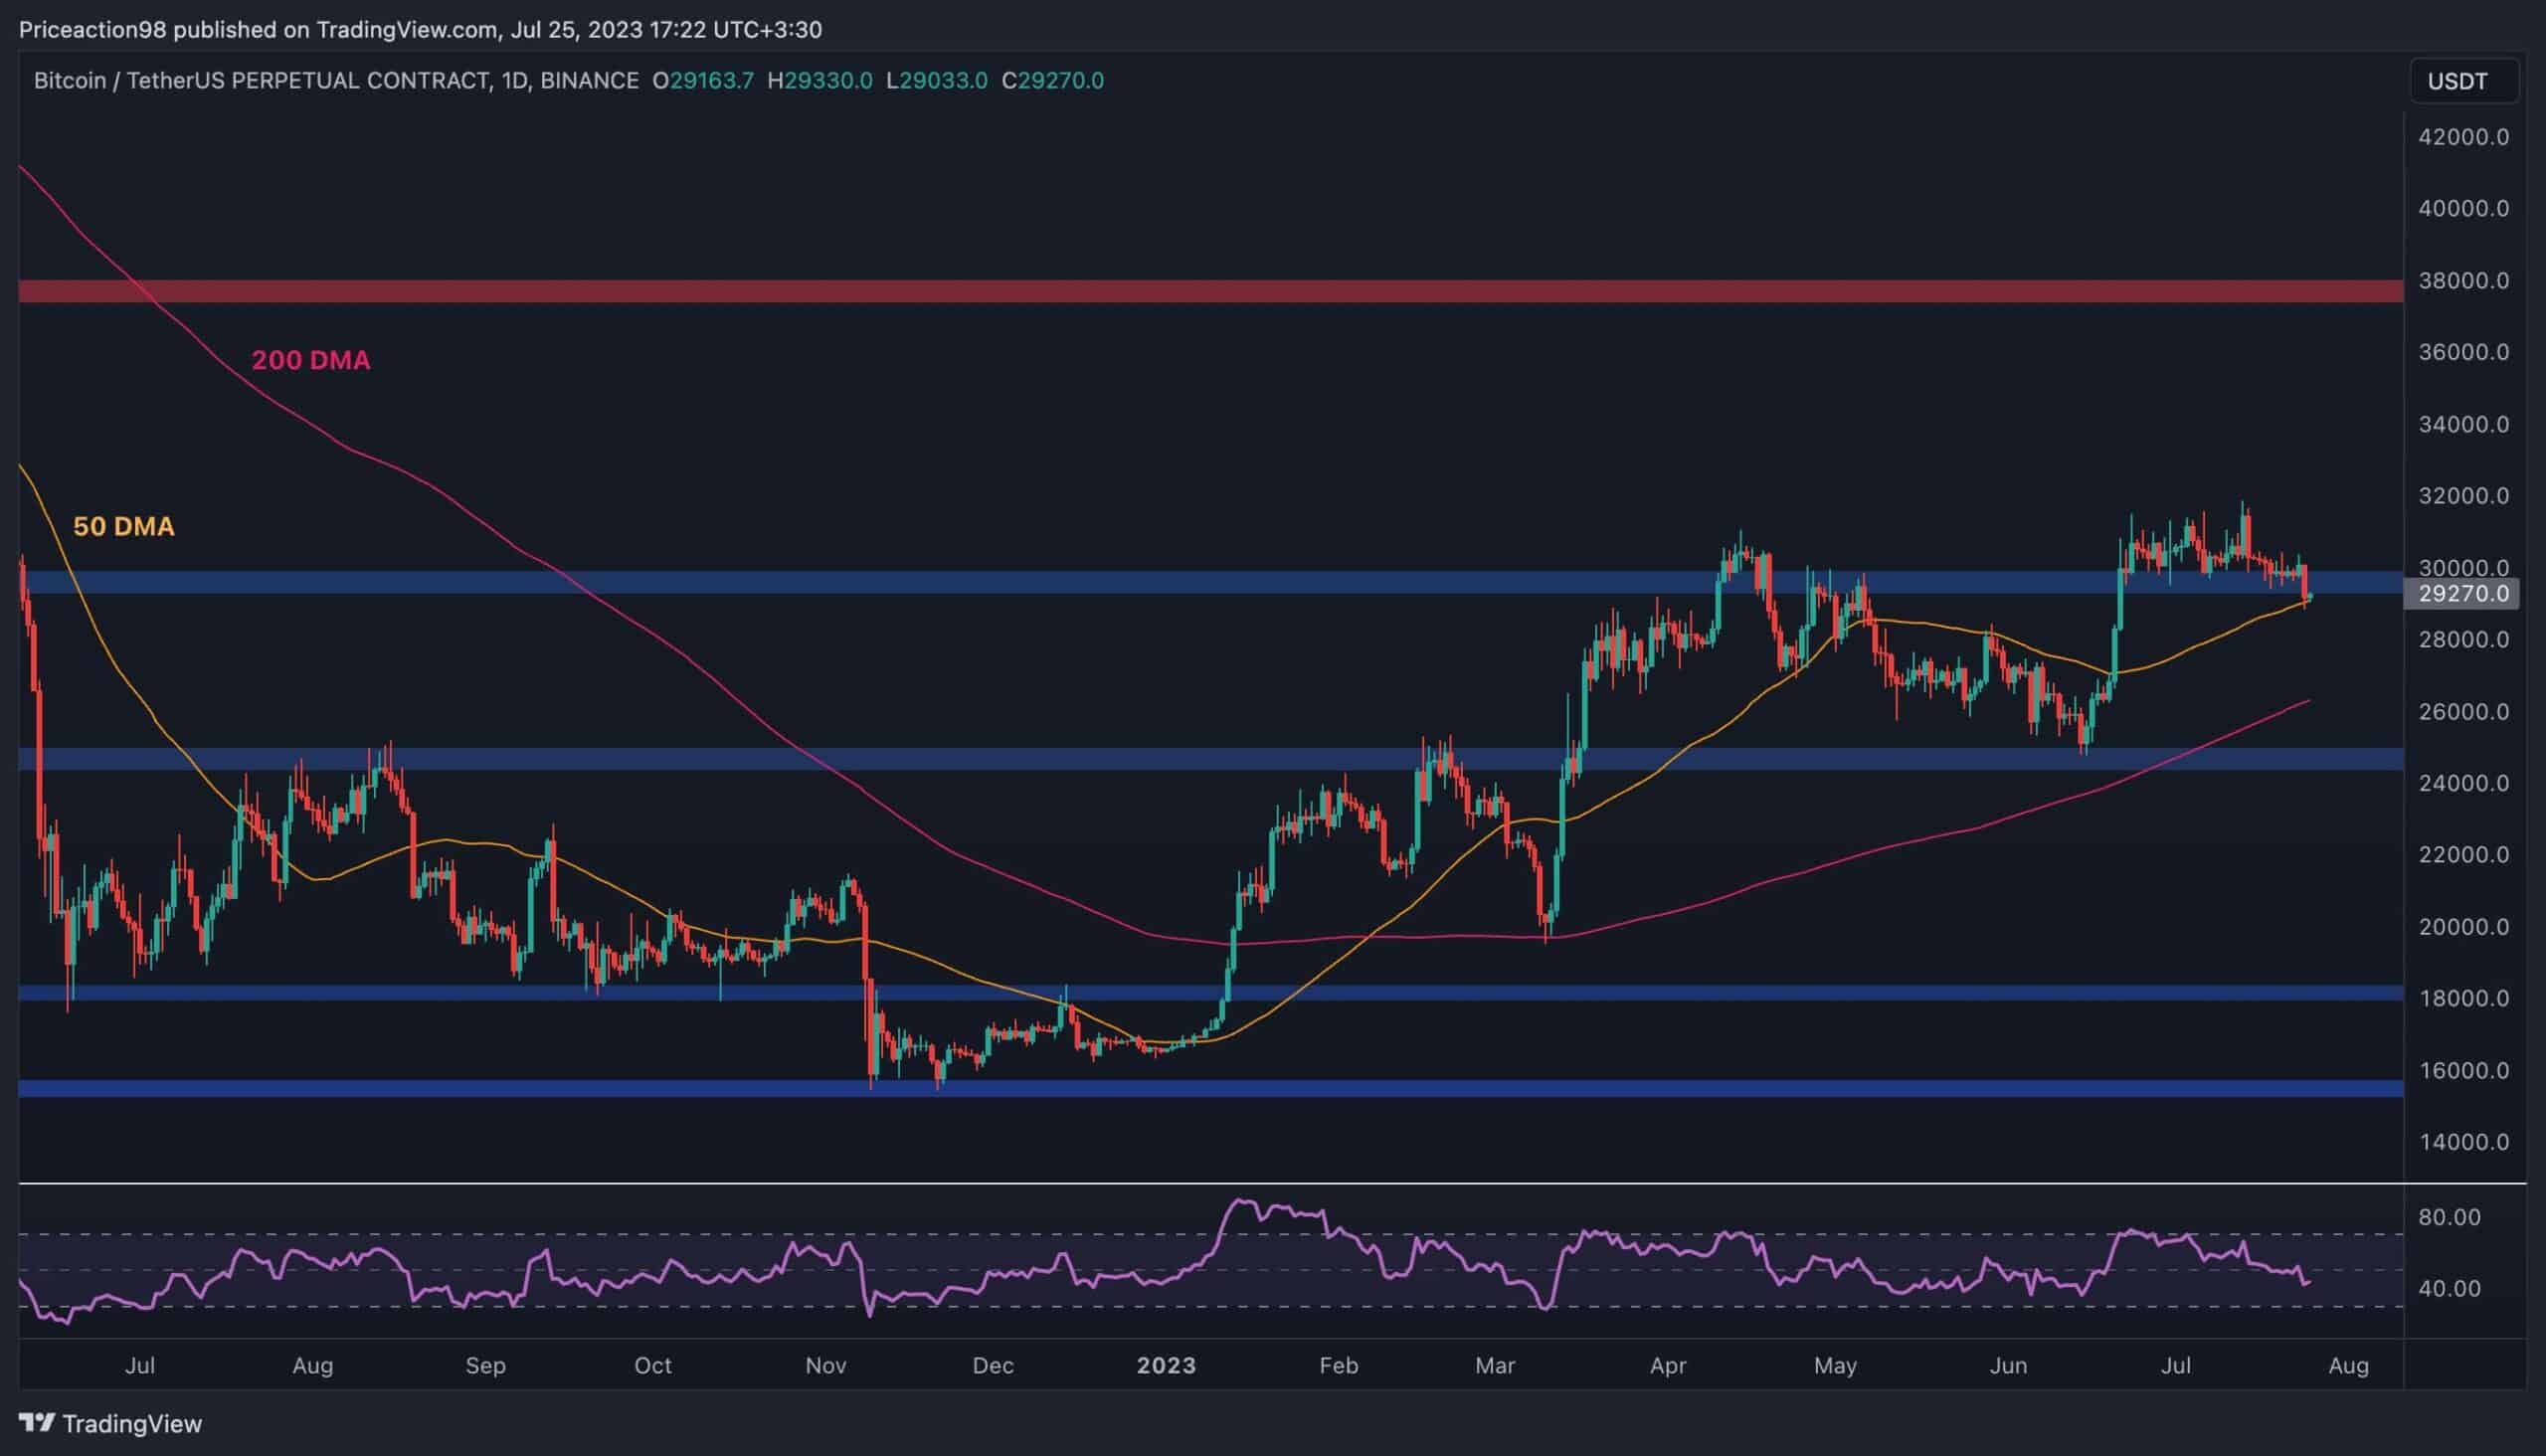
The Daily Chart:
On the daily timeframe, the price has been consolidating above the $30K level before dropping below it. The 50-day moving average, located around the $29K mark, is currently providing support for the price.
If this level holds, the market will be more likely to rally toward the $38K resistance zone in the coming months. However, if the mentioned moving average breaks down, the 200-day MA trending near the $26K area would be the next likely target.
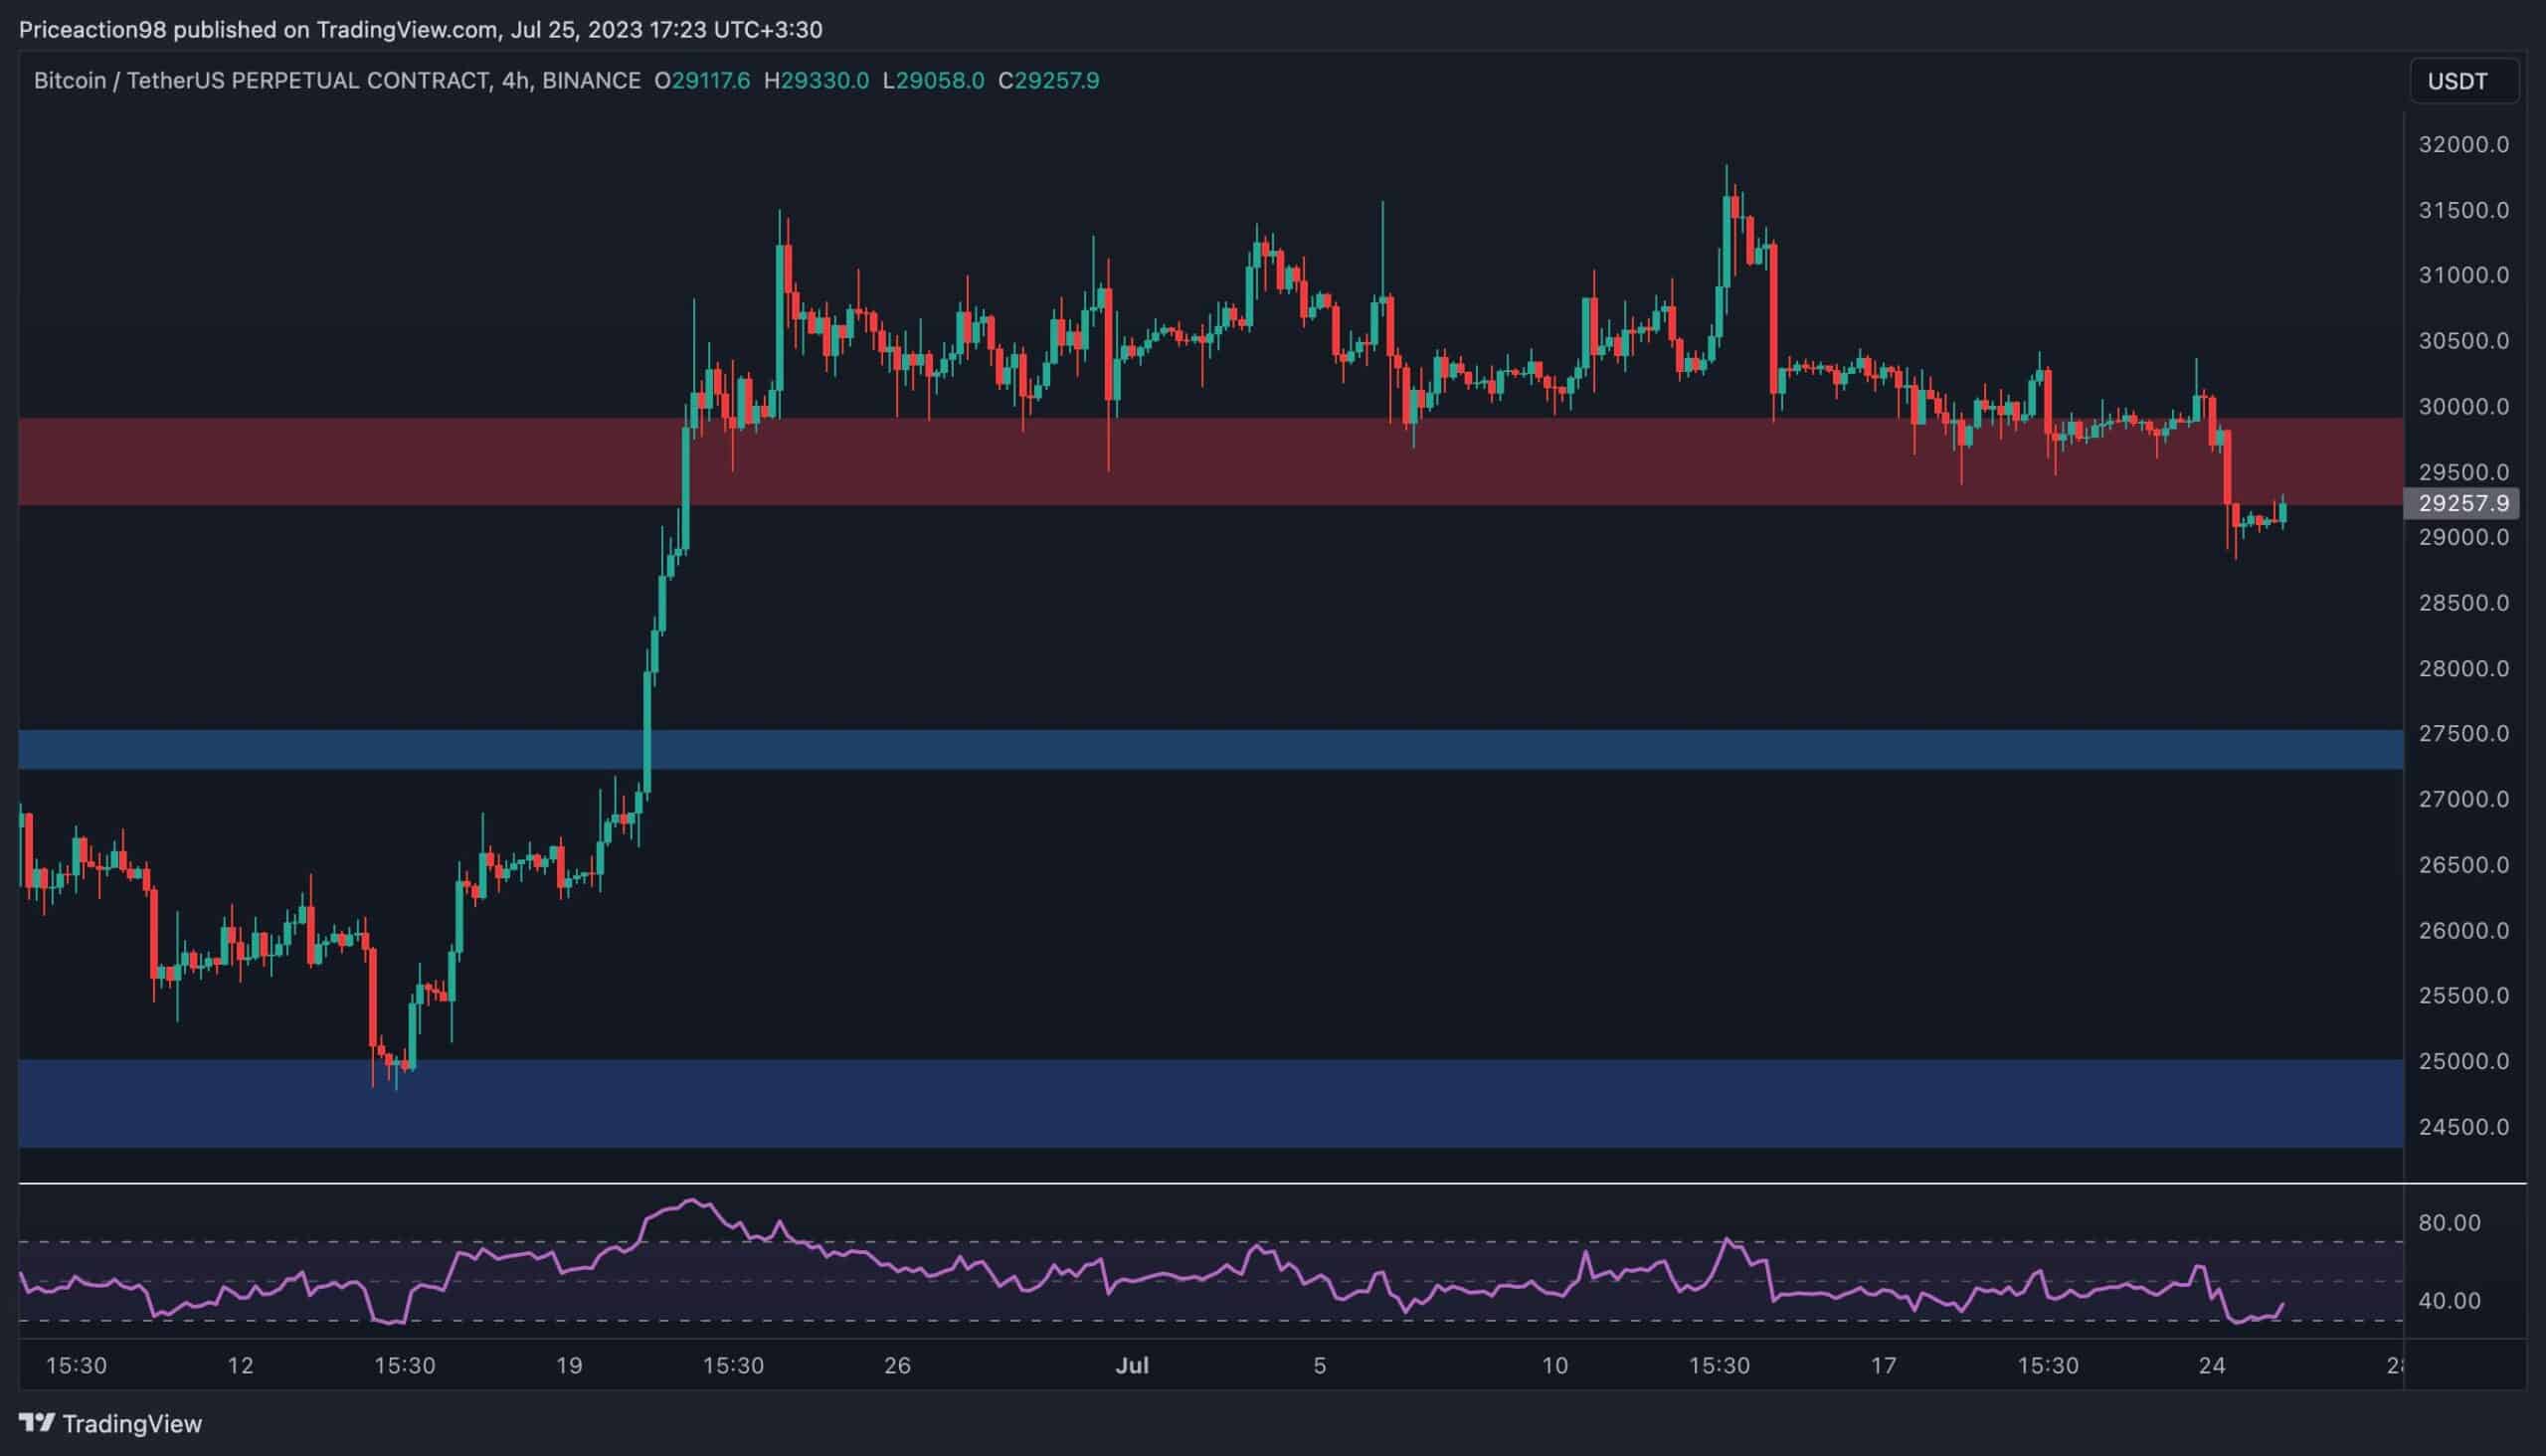
The 4-Hour Chart:
Looking at the 4-hour chart, the price action becomes clearer. The cryptocurrency is currently breaking below the $30K support area, with the next level located around the $27,500 mark.
However, the RSI indicator is approaching the oversold region, pointing to a potential reversal or pullback in the short term. If the price climbs back above the $30K level, a bullish continuation higher may be expected.
Sentiment Analysis
By: Edris
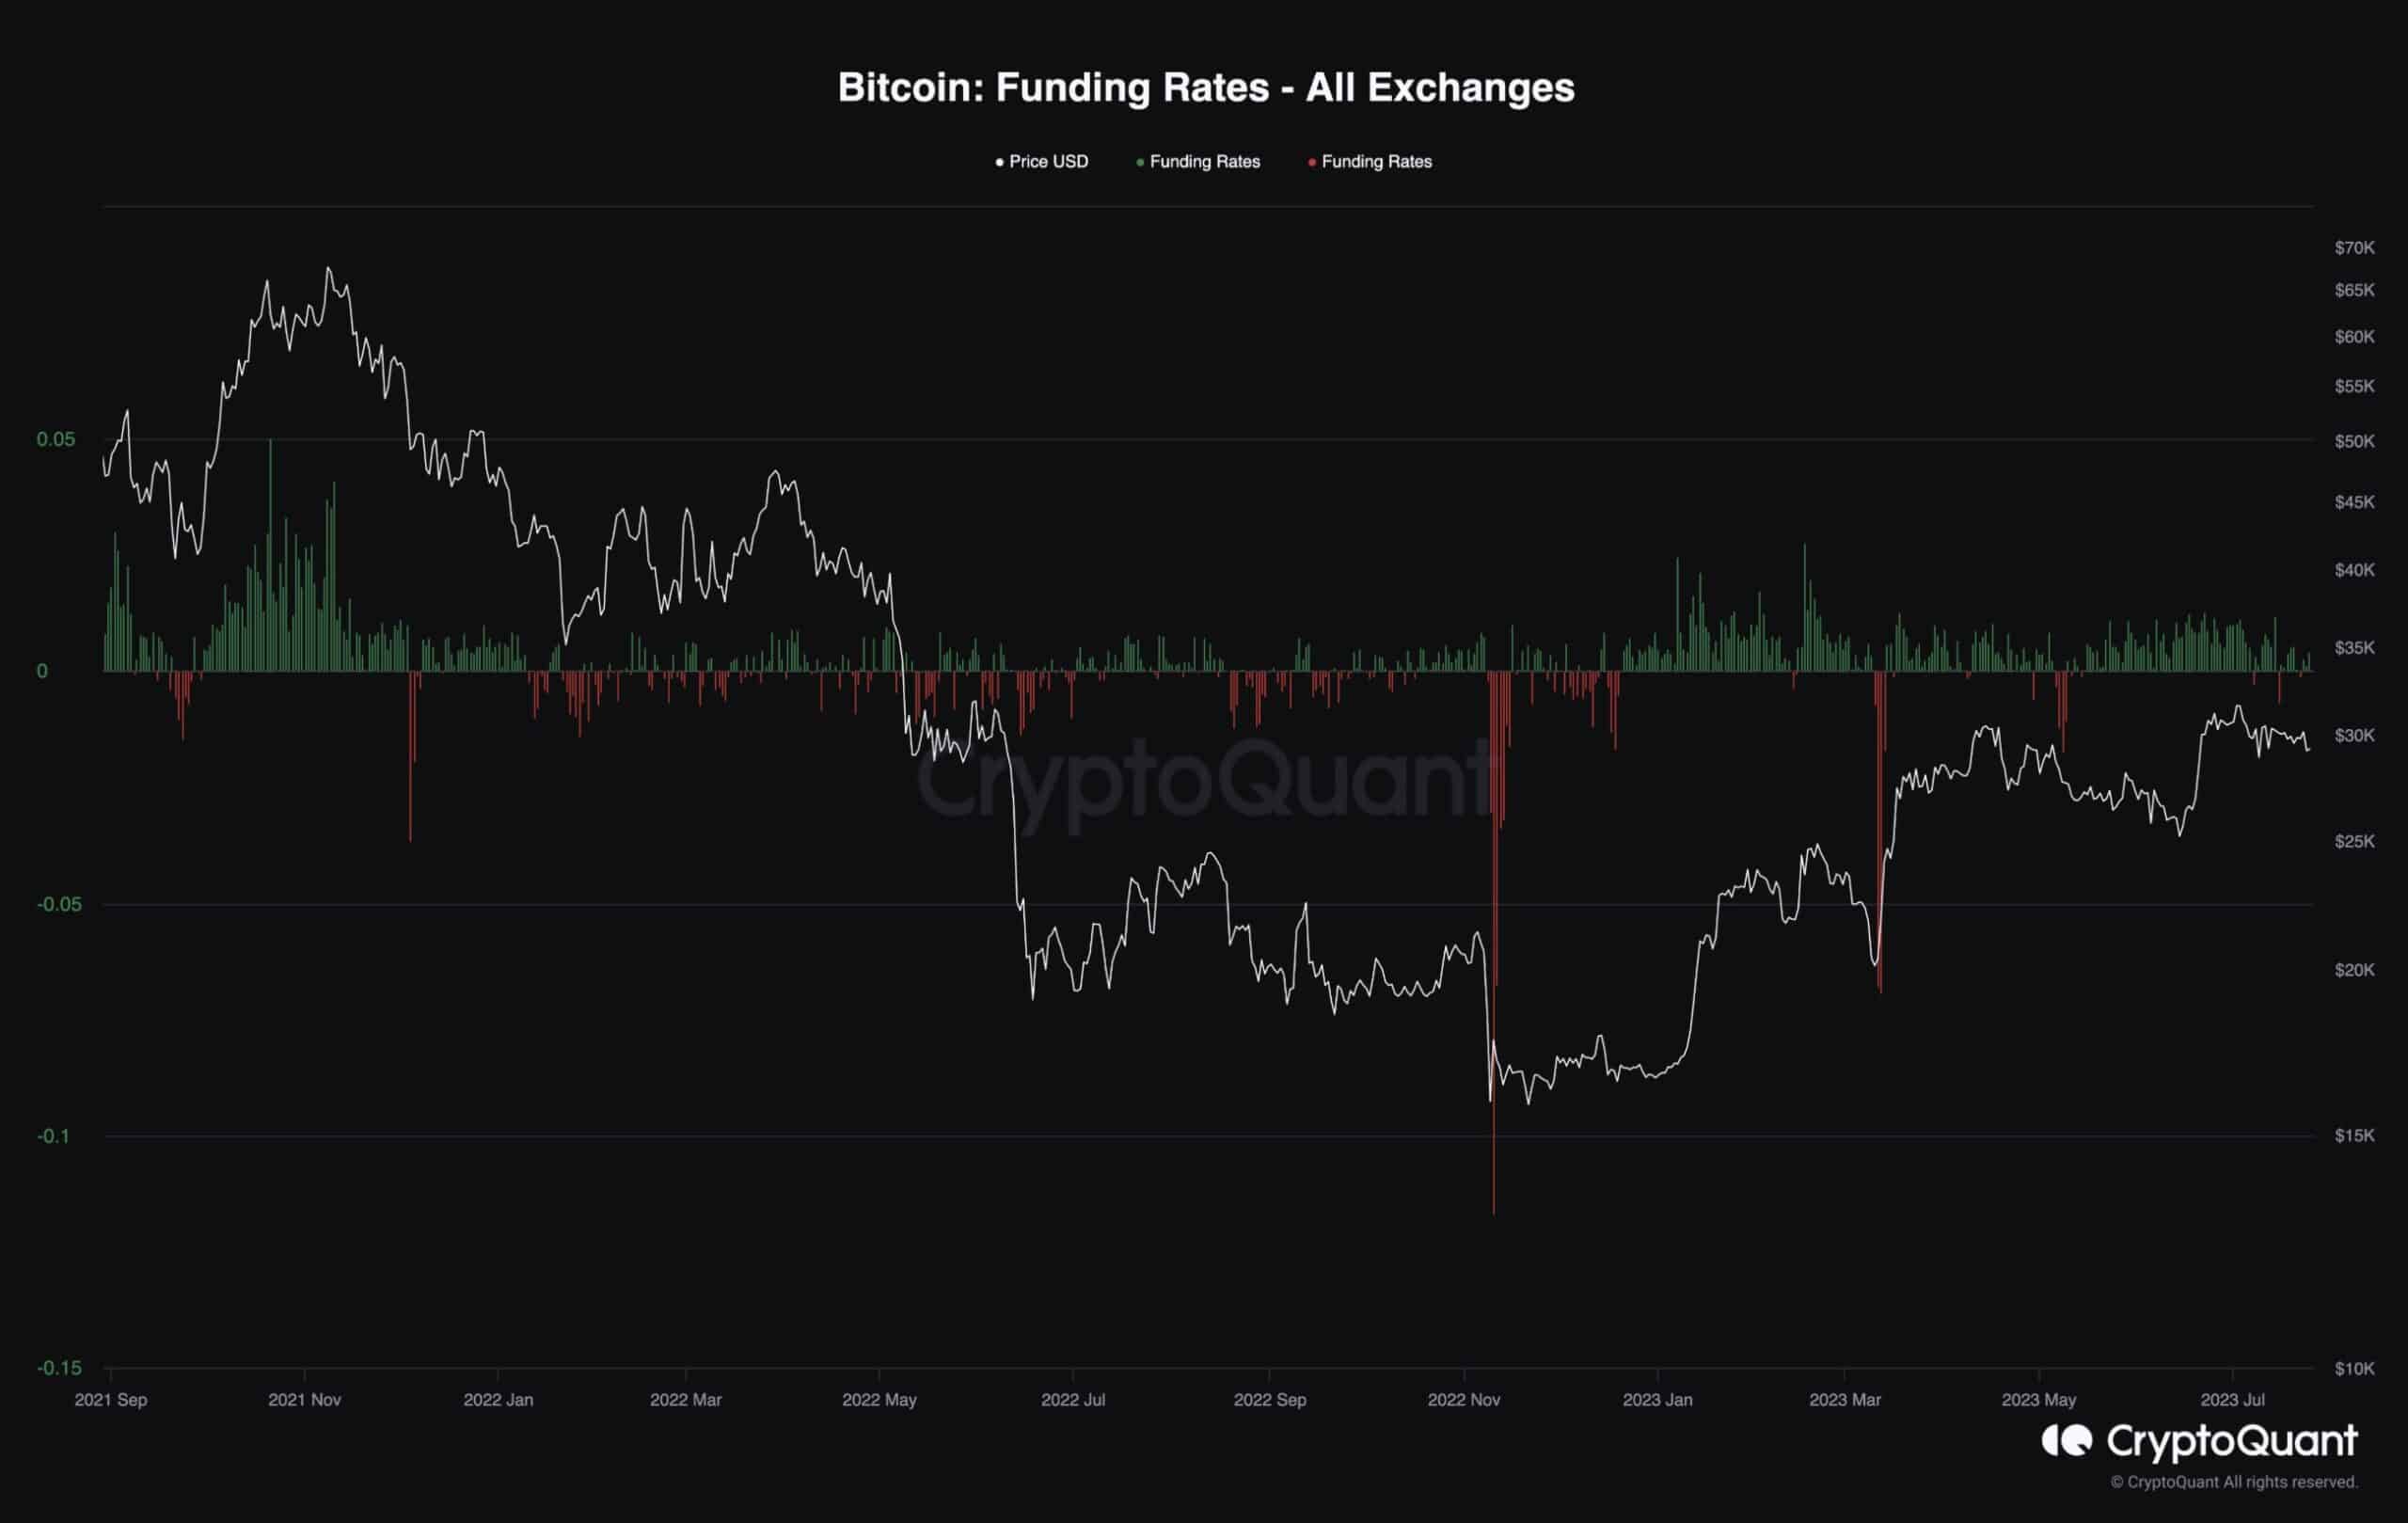
Bitcoin Funding Rates
Bitcoin’s price has gradually declined over the last few weeks, failing to rise above $30K. The funding rates indicate that this drop might be due to the futures market sentiment.
The funding rates metric determines whether long traders or short sellers are currently dominant. Positive values indicate bullish sentiment, while negative values indicate bearish sentiment.
Considering the recent funding rates values, marketing sentiment is trending relatively bearish after a few months of optimism. Therefore, one of the prominent reasons why the market has failed to keep rallying above $30K is the selling pressure from the futures market.