Ripple faced strong rejection when attempting to breach the significant resistance region at %excerpt%.55. Currently, it’s challenging to identify Ripple’s direction due to the choppy price action. The most likely scenario seems to be a consolidation phase for the mid-term. Technical Analysis By Shayan The Daily Chart Analyzing the daily chart reveals that Ripple faced significant rejection upon reaching the crucial resistance zone at %excerpt%.85. This indicates robust selling pressure and substantial supply around this price range. However, it’s important to recognize that a consolidation correction stage is necessary after impulsive price surges to validate the trend’s strength and allow the market to rest. As a result, it seems likely that the price has entered a mid-term correction
Topics:
CryptoVizArt considers the following as important: Ripple (XRP) Price, XRP Analysis, xrpbtc, xrpusd
This could be interesting, too:
Jordan Lyanchev writes Ripple’s (XRP) Surge to Triggers Over Million in Short Liquidations
Jordan Lyanchev writes Trump Confirms Work on Strategic Crypto Reserve: XRP, ADA, SOL Included
Dimitar Dzhondzhorov writes Is a Major Ripple v. SEC Lawsuit Development Expected This Week? Here’s Why
Mandy Williams writes Ripple Releases Institutional DeFi Roadmap for XRP Ledger in 2025
Ripple faced strong rejection when attempting to breach the significant resistance region at $0.55.
Currently, it’s challenging to identify Ripple’s direction due to the choppy price action. The most likely scenario seems to be a consolidation phase for the mid-term.
Technical Analysis
By Shayan
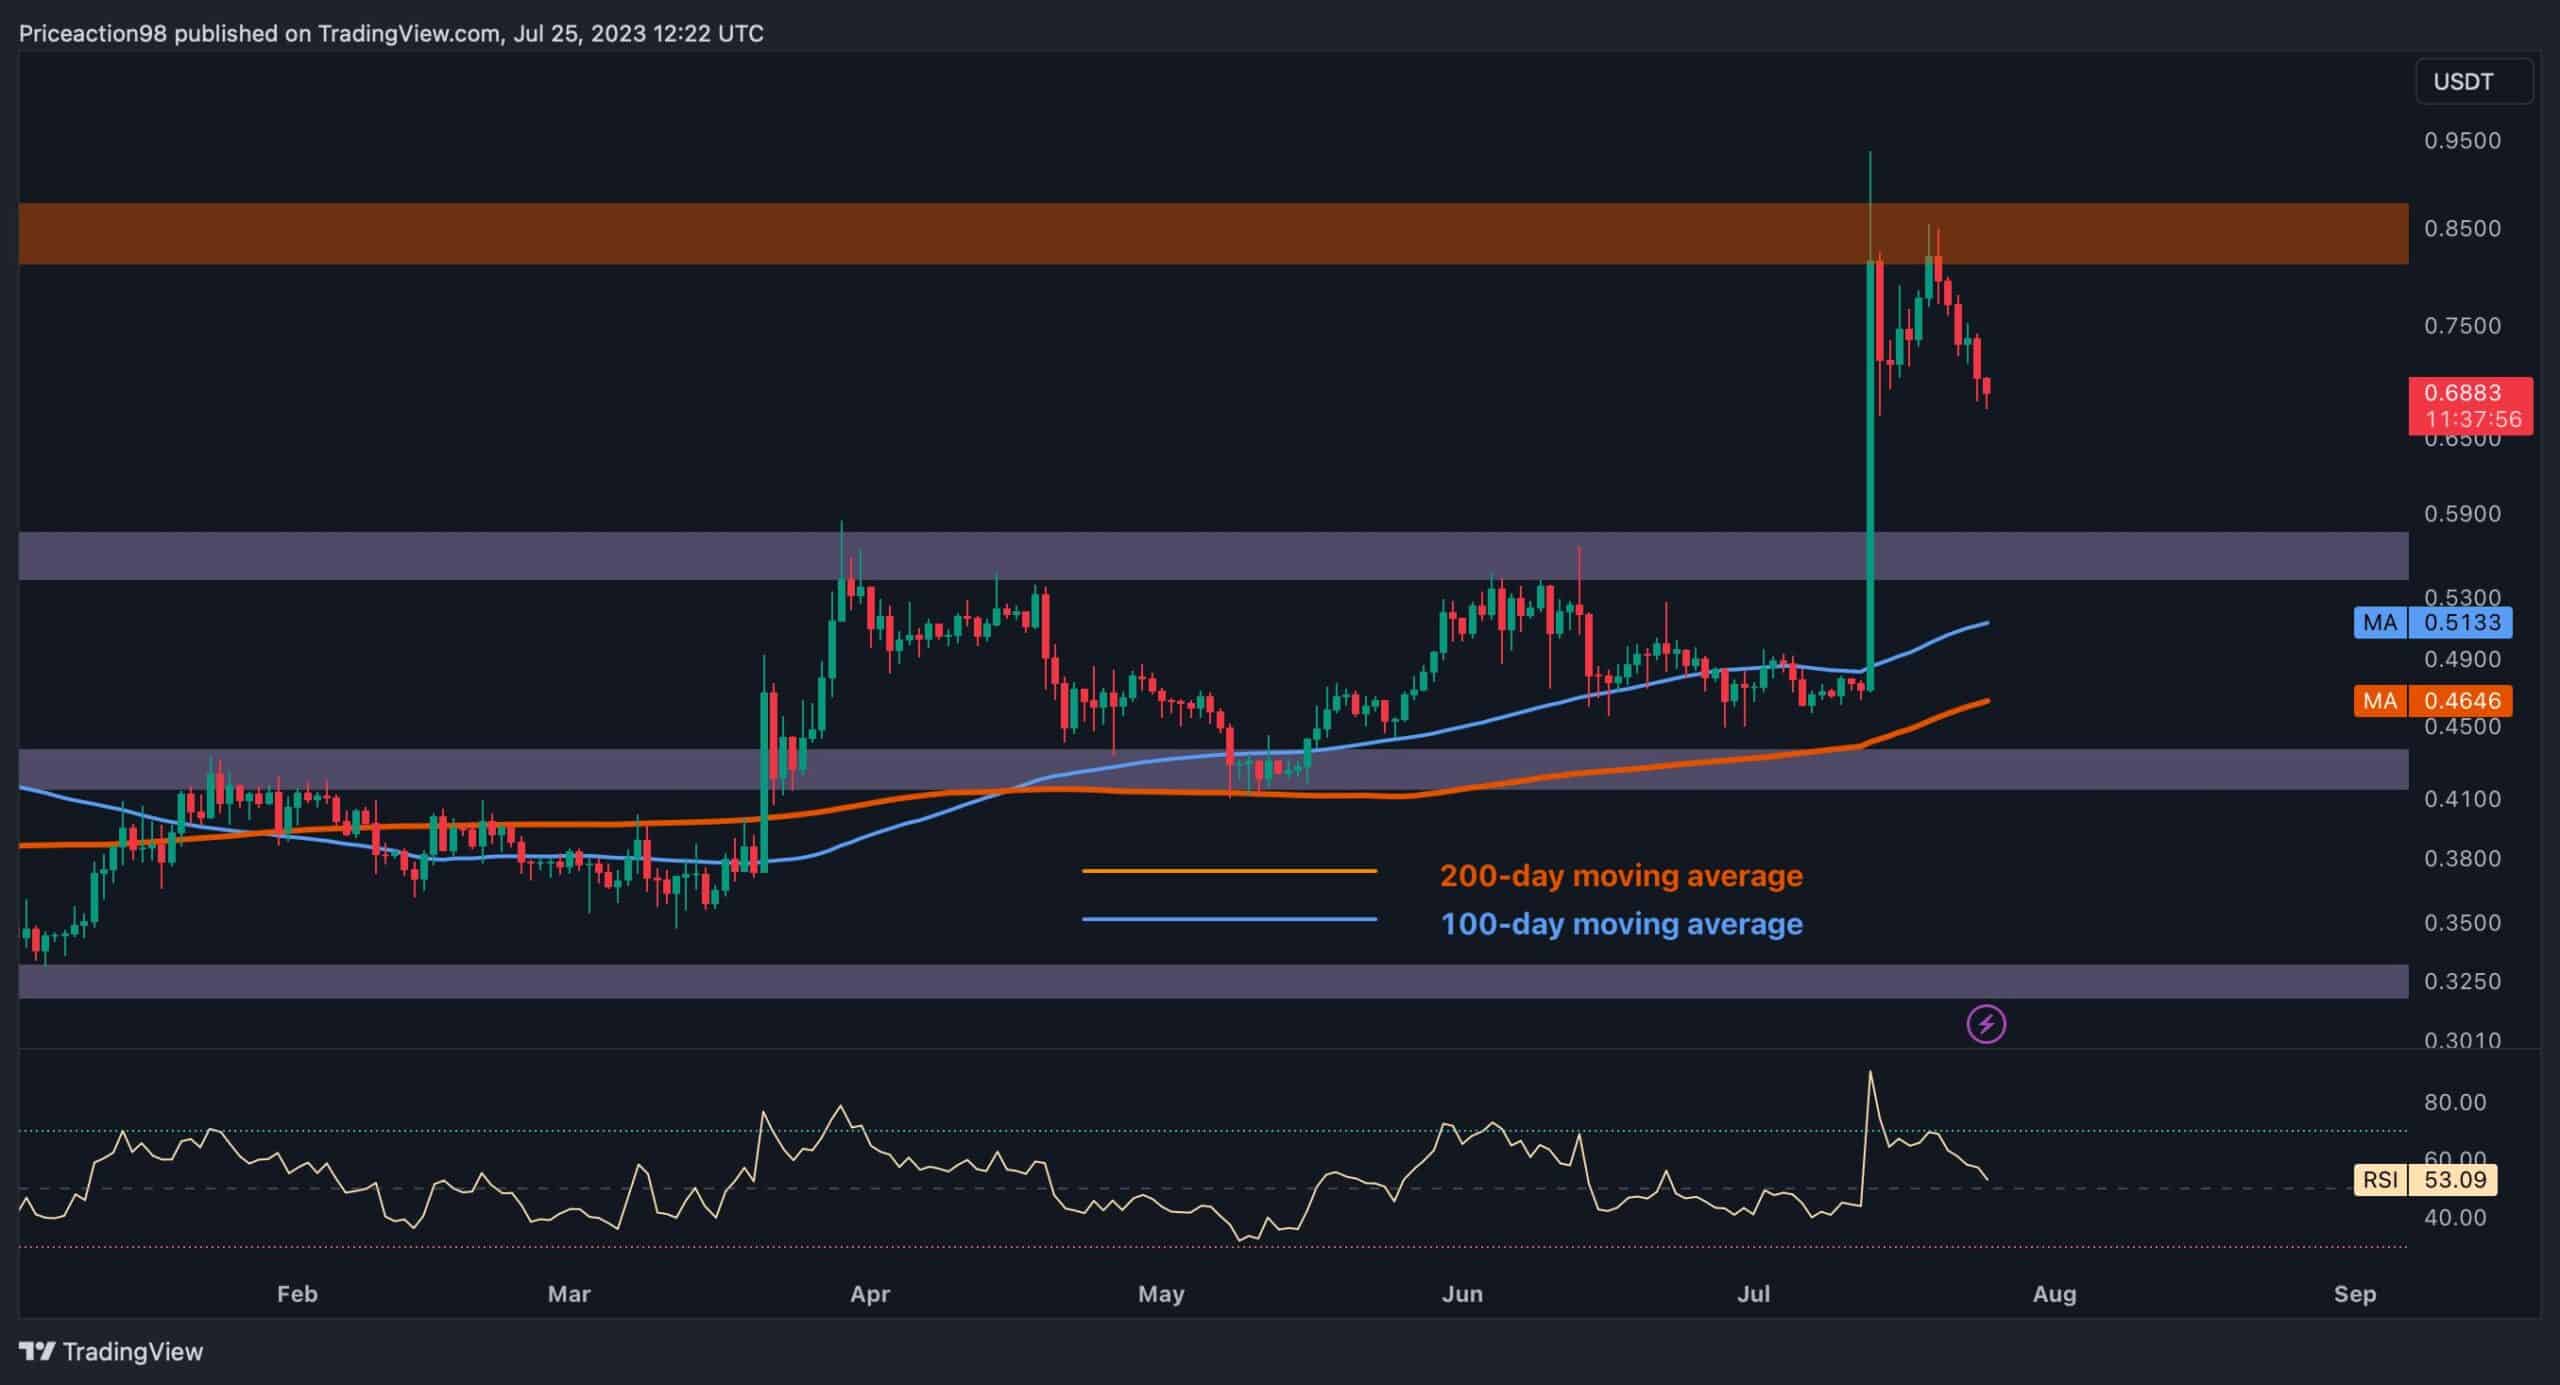
The Daily Chart
Analyzing the daily chart reveals that Ripple faced significant rejection upon reaching the crucial resistance zone at $0.85. This indicates robust selling pressure and substantial supply around this price range.
However, it’s important to recognize that a consolidation correction stage is necessary after impulsive price surges to validate the trend’s strength and allow the market to rest.
As a result, it seems likely that the price has entered a mid-term correction phase leading to higher volatility and pullback periods before the next significant movement occurs.
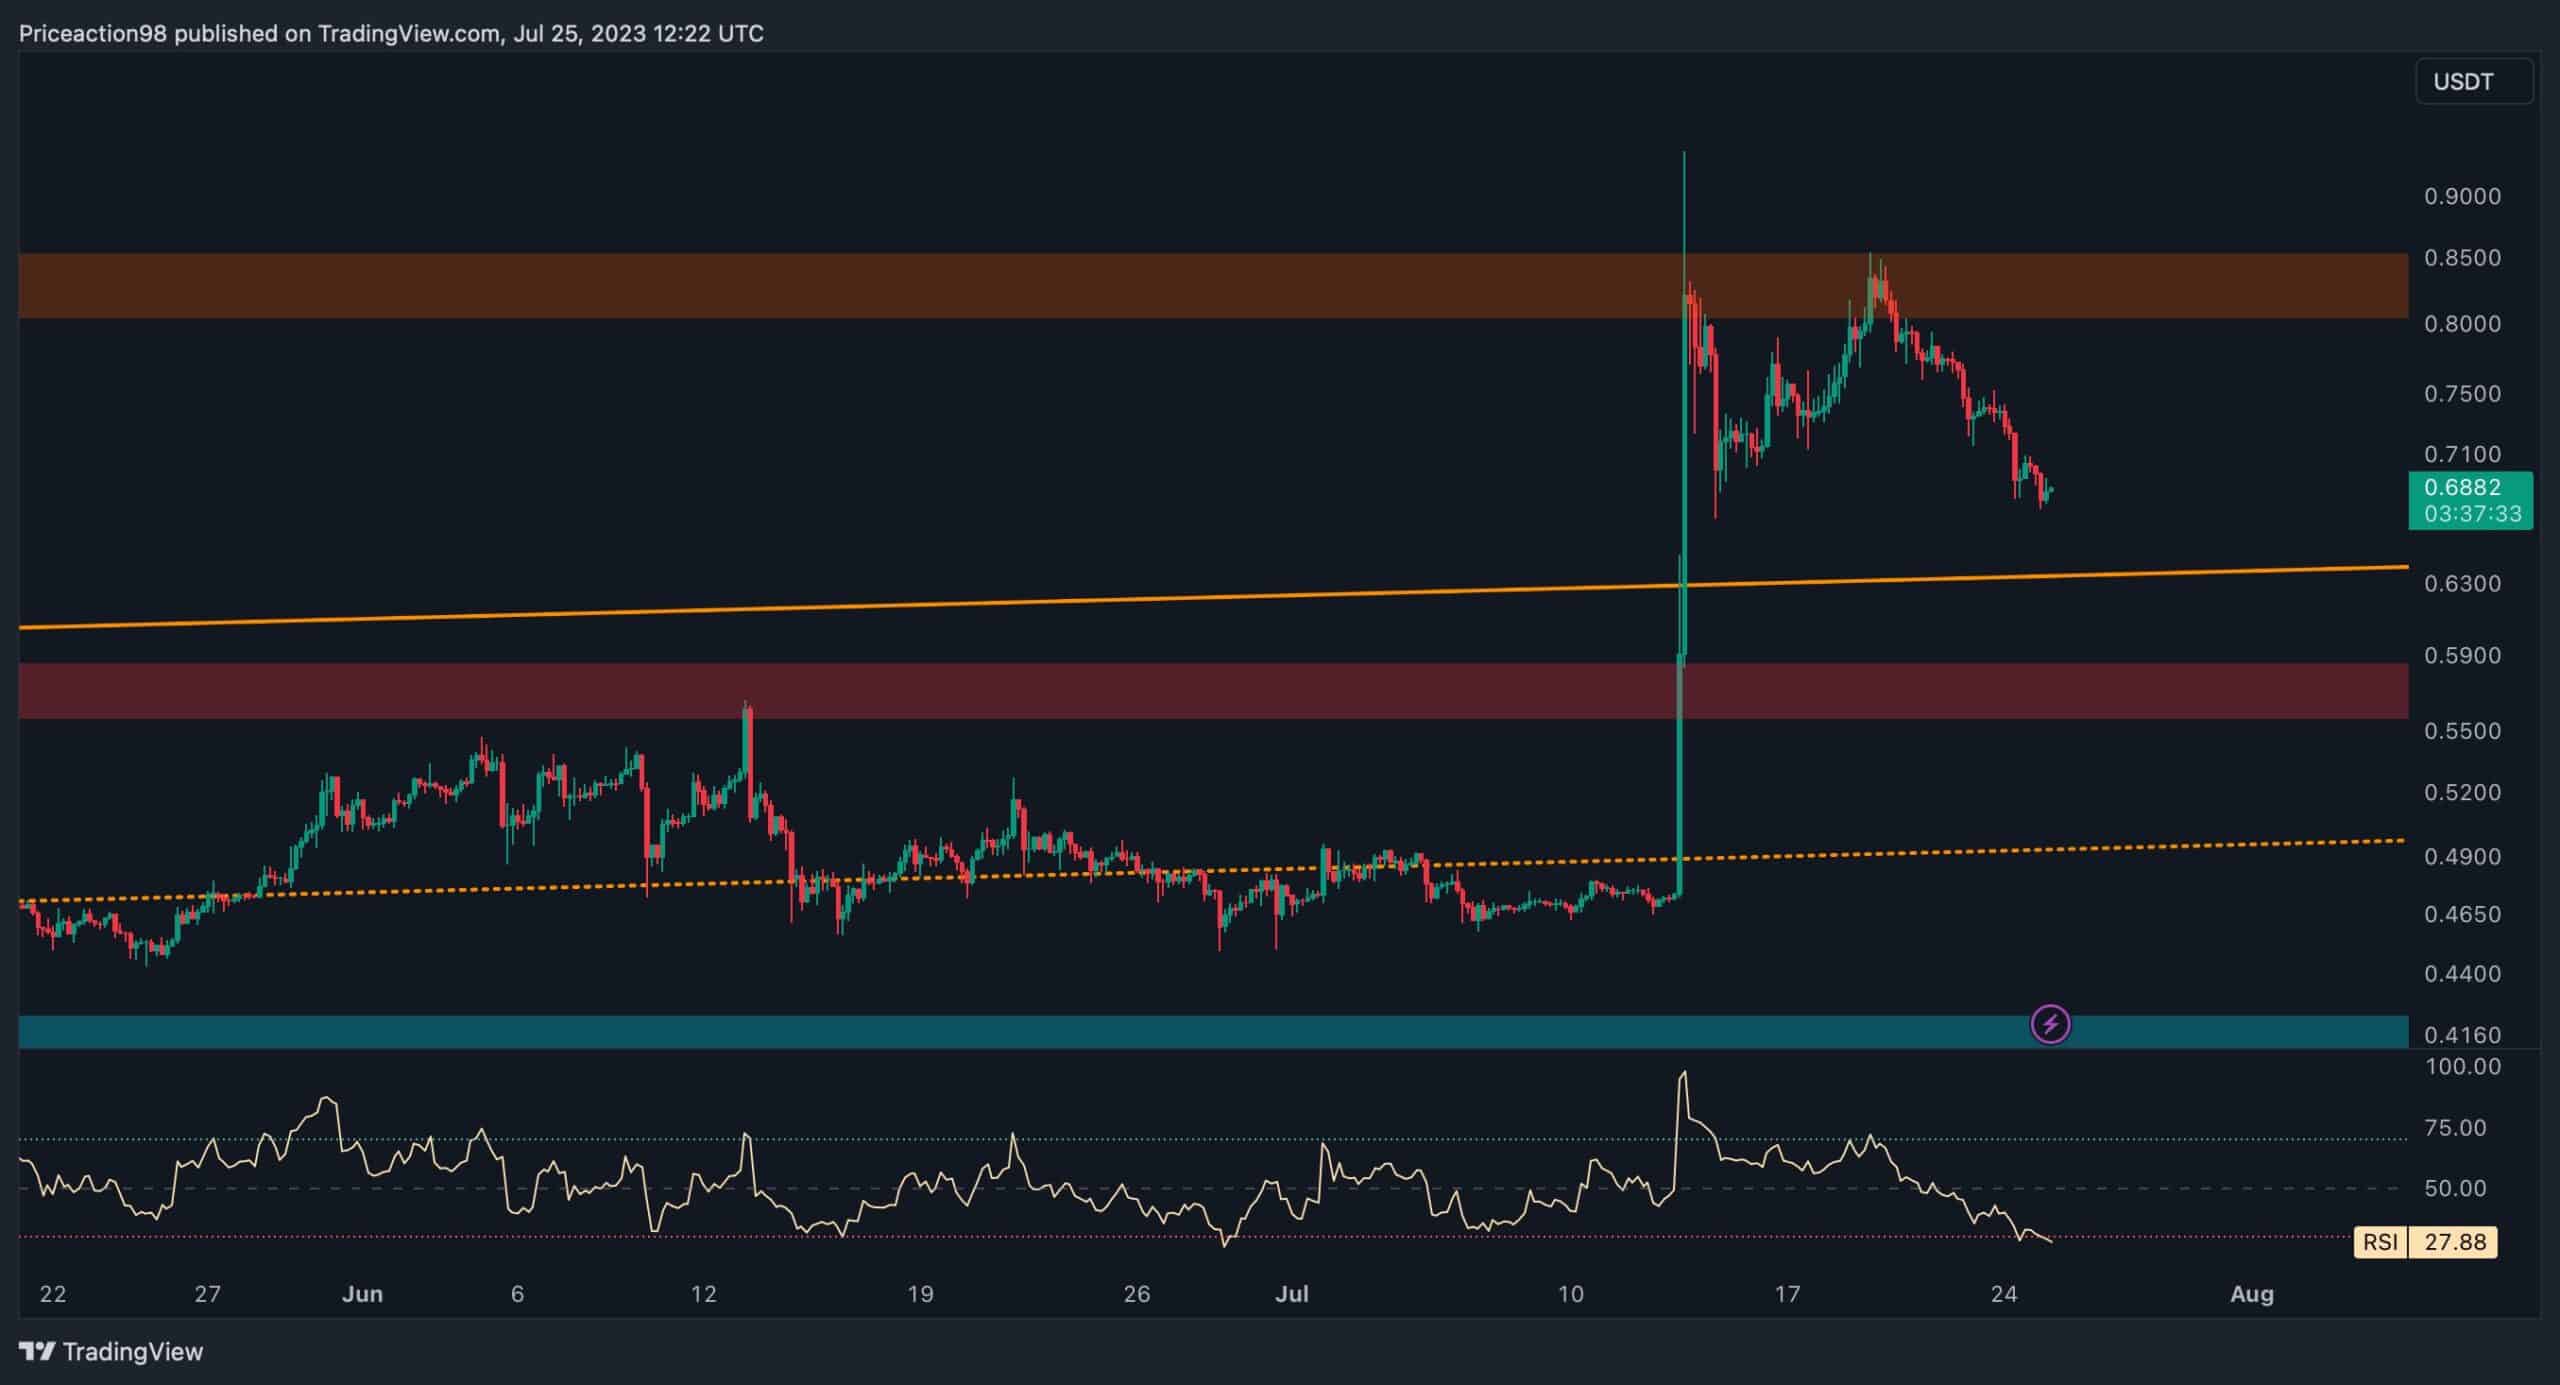
The 4-Hour Chart
In the 4-hour chart, it can be seen that the price successfully broke above the upper edge of a channel. However, after reaching the $0.85 region, it experienced a decline with consecutive red candles.
This suggests that a correction period is likely, retracing back to the upper boundary and completing a pullback. If this correction is successful, the market can expect to continue the bullish rally, propelling the price to higher levels.