Litecoin started a fresh decline from the .50 resistance zone against the US Dollar. LTC price is now trading below .50 and the 55 simple moving average (4 hours). There was a break below a key rising channel with support near .20 on the 4-hour chart of the LTC/USD pair (data feed from Coinbase). The pair could continue to move down unless there is a recovery wave above .00. Litecoin price is struggling below .50 against the US Dollar, like Bitcoin. LTC price could continue to decline if it stays below the .00 resistance zone. Litecoin Price Analysis In the past few sessions, there was a fresh decline in Bitcoin, Ethereum, Ripple, and Litecoin against the US Dollar. Earlier, LTC settled below the .85 support zone to move into a bearish
Topics:
Aayush Jindal considers the following as important: Altcoin News, LTC, News, Trading
This could be interesting, too:
Emily John writes GRVT Launches Alertatron Trading Event and Airdrop Before TGE
Bilal Hassan writes Coinbase Expands in Nigeria with Onboard Global Partnership
Guest User writes XRP Price Faces Potential Drop: Leading KOL Warns of Imminent Correction with TD Sequential Sell Signal!
Bilal Hassan writes Bitget Expands in South Africa with Callpay Integration
- Litecoin started a fresh decline from the $66.50 resistance zone against the US Dollar.
- LTC price is now trading below $62.50 and the 55 simple moving average (4 hours).
- There was a break below a key rising channel with support near $62.20 on the 4-hour chart of the LTC/USD pair (data feed from Coinbase).
- The pair could continue to move down unless there is a recovery wave above $62.00.
Litecoin price is struggling below $62.50 against the US Dollar, like Bitcoin. LTC price could continue to decline if it stays below the $62.00 resistance zone.
Litecoin Price Analysis
In the past few sessions, there was a fresh decline in Bitcoin, Ethereum, Ripple, and Litecoin against the US Dollar. Earlier, LTC settled below the $63.85 support zone to move into a bearish zone.
The price broke the $62.50 support zone and started a fresh decline. There was a break below a key rising channel with support near $62.20 on the 4-hour chart of the LTC/USD pair. It even traded below the $61.20 support. A low has formed near $59.73 and the price is now consolidating losses. It is now trading below $62.50 and the 55 simple moving average (4 hours).
Immediate resistance is near the $61.20 level. It is close to the 23.6% Fib retracement level of the downward move from the $66.33 swing high to the $59.73 low.
The next major resistance is near the $62.00 level and the 55 simple moving average (4 hours). The main resistance sits near $63.00 or the 50% Fib retracement level of the downward move from the $66.33 swing high to the $59.73 low.
A clear move above the $63 level could pump the price toward the $66.40 level. The next major resistance could be $70. On the downside, immediate support is near the $59.50 level.
The next key support is near the $56.50.00 level. If there is a downside break below the $56.50.00 support, the price could accelerate lower toward the $50 level in the near term.
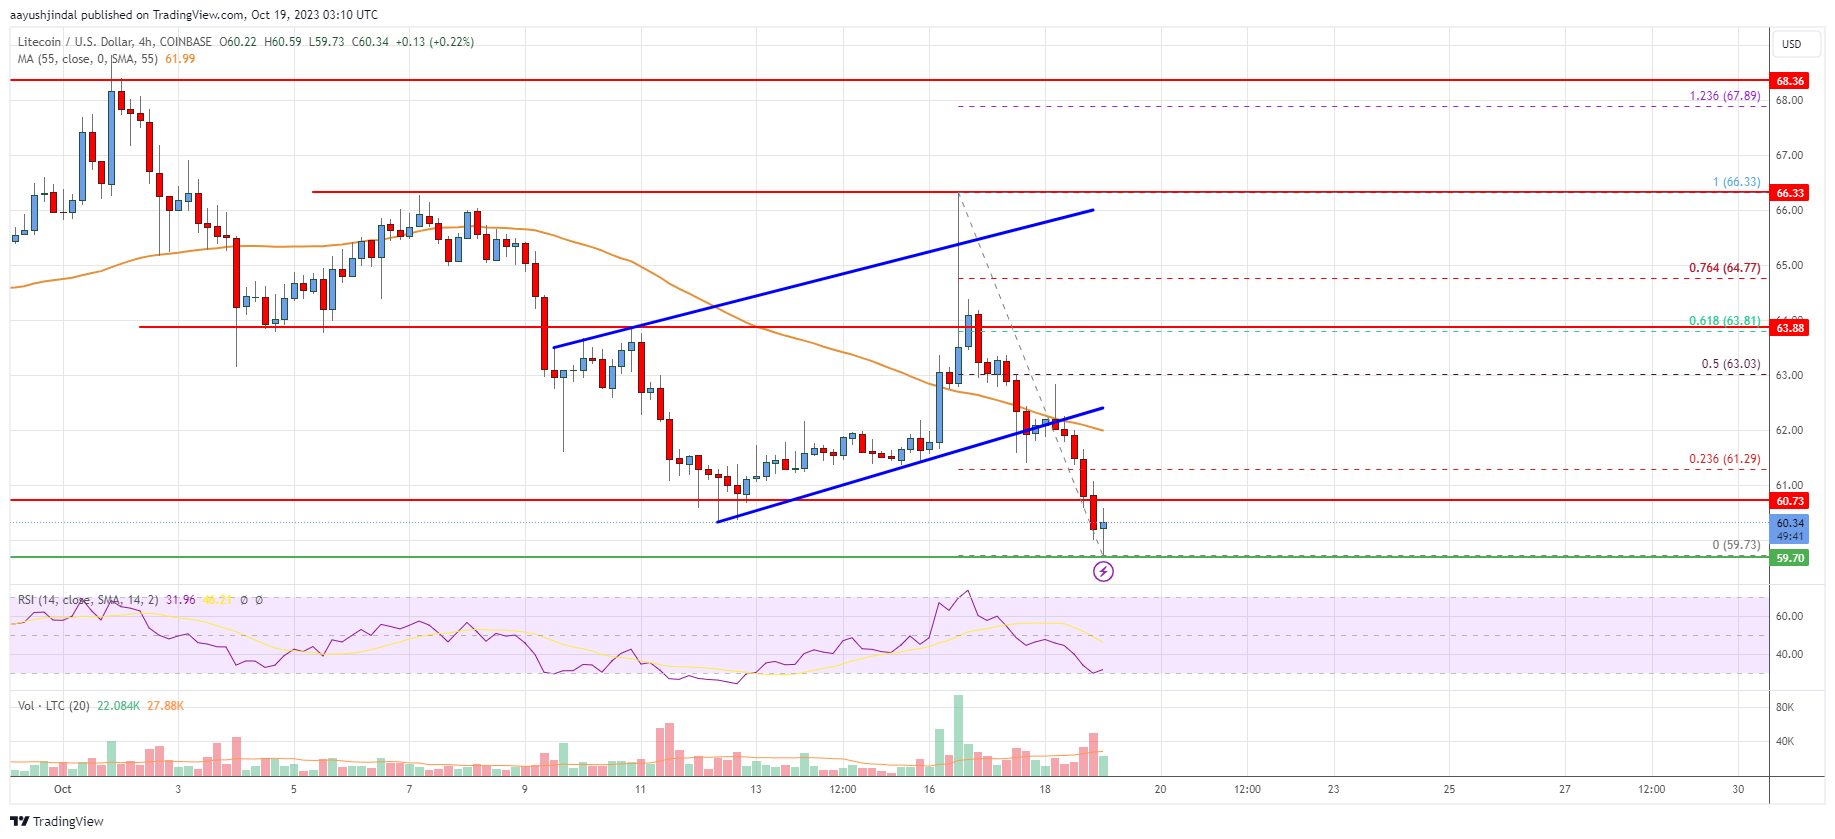
Looking at the chart, Litecoin price is clearly trading below $62.50 and the 55 simple moving average (4 hours). Overall, the price could continue to move down if it stays below the $62 resistance zone.
Technical indicators
4 hours MACD – The MACD for LTC/USD is now gaining pace in the bearish zone.
4 hours RSI (Relative Strength Index) – The RSI for LTC/USD is now below the 50 level.
Key Support Levels – $59.50 and $56.50.
Key Resistance Levels – $62.00 and $63.00.