Ripple price started a downside correction from the %excerpt%.5250 zone against the US dollar. The price is now trading below %excerpt%.510 and the 55 simple moving average (4 hours). There was a break below a key bullish trend line with support at %excerpt%.5095 on the 4-hour chart of the XRP/USD pair (data source from Kraken). The pair could start a fresh increase unless there is a close below %excerpt%.4850. Ripple price is consolidating near %excerpt%.500 against the US Dollar, unlike Bitcoin. XRP price must stay above the %excerpt%.485 support to remain in a bullish zone. Ripple Price Analysis This past week, Ripple price saw a decent increase above the %excerpt%.4850 resistance against the US Dollar. The XRP/USD pair climbed above the %excerpt%.500 resistance to move into a positive zone. The bulls even pumped
Topics:
Aayush Jindal considers the following as important: Altcoin News, News, Trading, XRP
This could be interesting, too:
Emily John writes Ripple Unveils Institutional Roadmap Driving XRP Ledger Growth
Emily John writes GRVT Launches Alertatron Trading Event and Airdrop Before TGE
Bilal Hassan writes Coinbase Expands in Nigeria with Onboard Global Partnership
Emily John writes XRP Eyes Breakout – Will the Final Wave Spark a Rally?
- Ripple price started a downside correction from the $0.5250 zone against the US dollar.
- The price is now trading below $0.510 and the 55 simple moving average (4 hours).
- There was a break below a key bullish trend line with support at $0.5095 on the 4-hour chart of the XRP/USD pair (data source from Kraken).
- The pair could start a fresh increase unless there is a close below $0.4850.
Ripple price is consolidating near $0.500 against the US Dollar, unlike Bitcoin. XRP price must stay above the $0.485 support to remain in a bullish zone.
Ripple Price Analysis
This past week, Ripple price saw a decent increase above the $0.4850 resistance against the US Dollar. The XRP/USD pair climbed above the $0.500 resistance to move into a positive zone.
The bulls even pumped the price above the $0.515 resistance. A high was formed near $0.5254 and the price recently corrected lower. There was a move below the $0.515 and $0.510 levels. The bears pushed the price below the 23.6% Fib retracement level of the upward move from the $0.4590 swing low to the $0.5254 high.
Besides, there was a break below a key bullish trend line with support at $0.5095 on the 4-hour chart of the XRP/USD pair. The price is now trading below $0.510 and the 55 simple moving average (4 hours).
It is trading above the 50% Fib retracement level of the upward move from the $0.4590 swing low to the $0.5254 high. On the upside, the price is facing resistance near $0.510.
The next major resistance is near the $0.5150 level. A close above the $0.5150 resistance zone might start a strong increase. In the stated case, the price could even surpass the $0.5250 resistance. Any more gains might send the price toward the $0.550 resistance.
Initial support on the downside is near the $0.492 level. The next major support is near the $0.485 level. Any more losses could lead the price toward the $0.465 level, below which the price might even test $0.450.
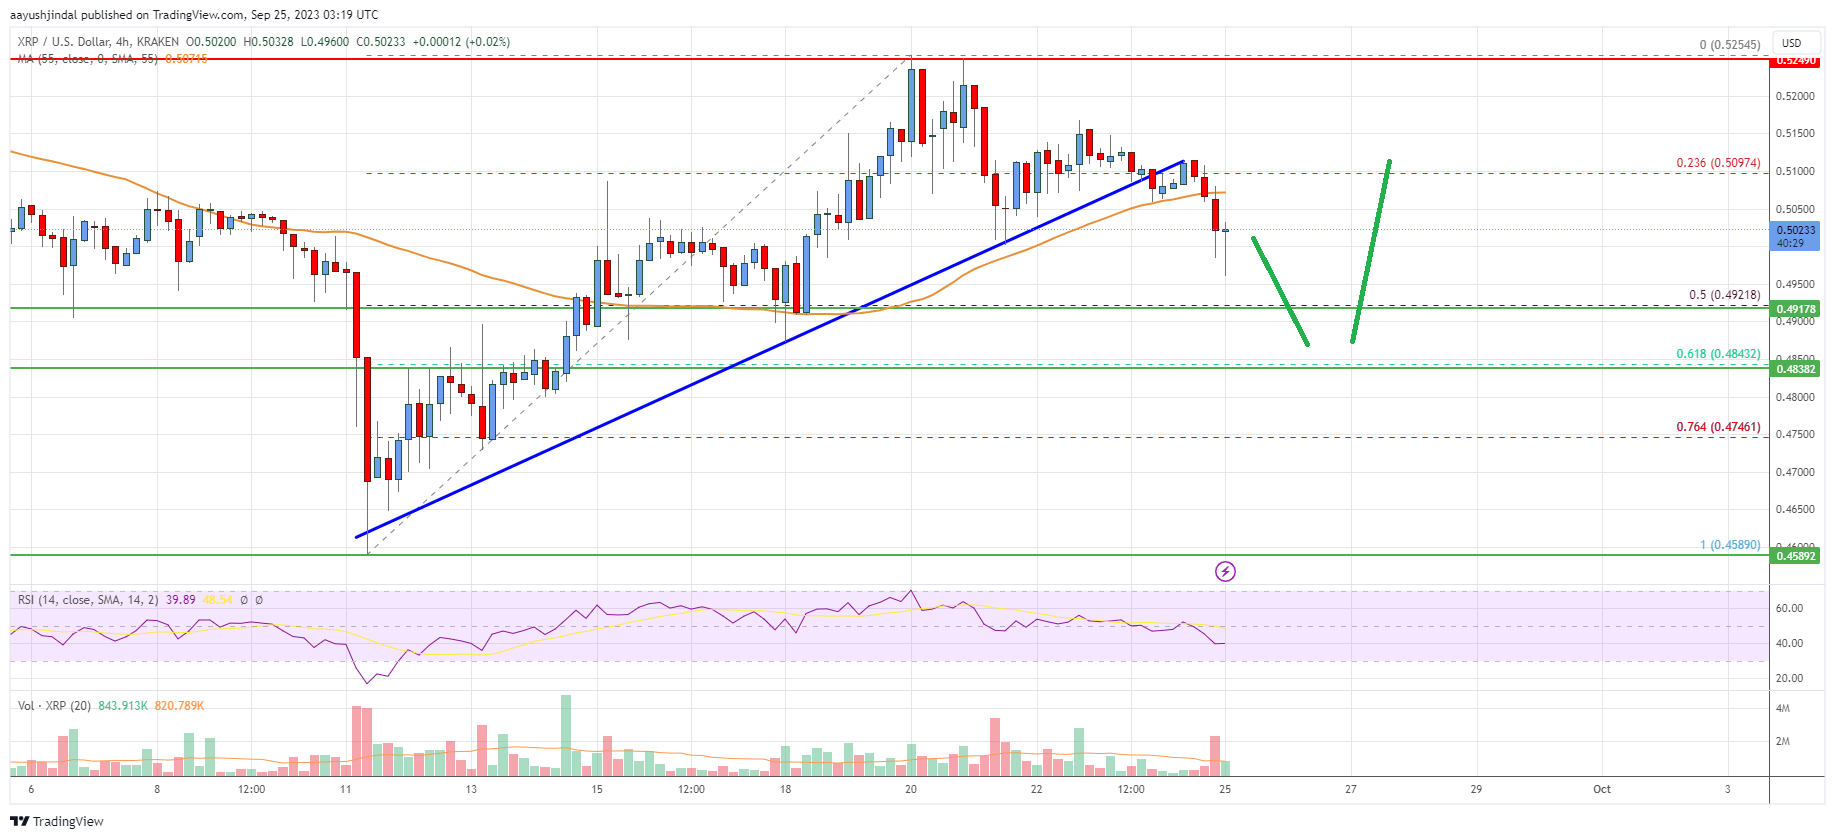
Looking at the chart, Ripple’s price is now trading below the $0.510 zone and the 55 simple moving average (4 hours). Overall, the price could start a fresh increase unless there is a close below $0.4850.
Technical indicators
4 hours MACD – The MACD for XRP/USD is now losing momentum in the bearish zone.
4 hours RSI (Relative Strength Index) – The RSI for XRP/USD is below the 50 level.
Key Support Levels – $0.4920, $0.4850, and $0.4650.
Key Resistance Levels – $0.5150 and $0.5250.