Solana price started a downside correction from the .20 zone against the US Dollar. The price is now trading below .00 and the 55 simple moving average (4 hours). There was a break below a key bullish trend line with support near .50 on the 4-hour chart of the SOL/USD pair (data feed from Coinbase). The pair must stay above the .00 and .50 support levels to start another increase. Solana price is trading above against the US Dollar, like Bitcoin. SOL is correcting lower, but it might find bids near the .00 zone. Solana (SOL) Price Analysis SOL price attempted more upsides above the .00 resistance zone. The price climbed above the .00 zone, but the bears were active near the .00 zone. A high was formed near .18 before there was
Topics:
Aayush Jindal considers the following as important: Altcoin News, News, sol, solana, Trading
This could be interesting, too:
Emily John writes GRVT Launches Alertatron Trading Event and Airdrop Before TGE
Bilal Hassan writes Coinbase Expands in Nigeria with Onboard Global Partnership
Dimitar Dzhondzhorov writes Sonic Introduces Its Mobius Mainnet to Serve as a Seamless Extension of Solana
Guest User writes XRP Price Faces Potential Drop: Leading KOL Warns of Imminent Correction with TD Sequential Sell Signal!
- Solana price started a downside correction from the $68.20 zone against the US Dollar.
- The price is now trading below $60.00 and the 55 simple moving average (4 hours).
- There was a break below a key bullish trend line with support near $57.50 on the 4-hour chart of the SOL/USD pair (data feed from Coinbase).
- The pair must stay above the $51.00 and $49.50 support levels to start another increase.
Solana price is trading above $50 against the US Dollar, like Bitcoin. SOL is correcting lower, but it might find bids near the $50.00 zone.
Solana (SOL) Price Analysis
SOL price attempted more upsides above the $60.00 resistance zone. The price climbed above the $65.00 zone, but the bears were active near the $68.00 zone.
A high was formed near $68.18 before there was a downside correction. The price declined below the $62.00 support zone. There was a break below a key bullish trend line with support near $57.50 on the 4-hour chart of the SOL/USD pair.
The bears were able to push the price below the 50% Fib retracement level of the upward wave from the $38.02 swing low to the $68.18 high. It is now trading below $60.00 and the 55 simple moving average (4 hours).
On the downside, initial support is near the $51.50 level. The next major support is near the $50.00 and $49.50 levels. It is close to the 61.8% Fib retracement level of the upward wave from the $38.02 swing low to the $68.18 high.
A downside break below the $49.50 support level might spark a sharp decline. In the stated case, the price may perhaps decline toward the $45.20 level. Any more losses might call for a test of $40.00.
On the upside, immediate resistance is near the $55.50 level. The next major resistance is near the $58.00 zone. Any more gains might send SOL price toward the $62.50 resistance zone, above which the price could accelerate higher. The next major resistance sits near the $68.00 level.
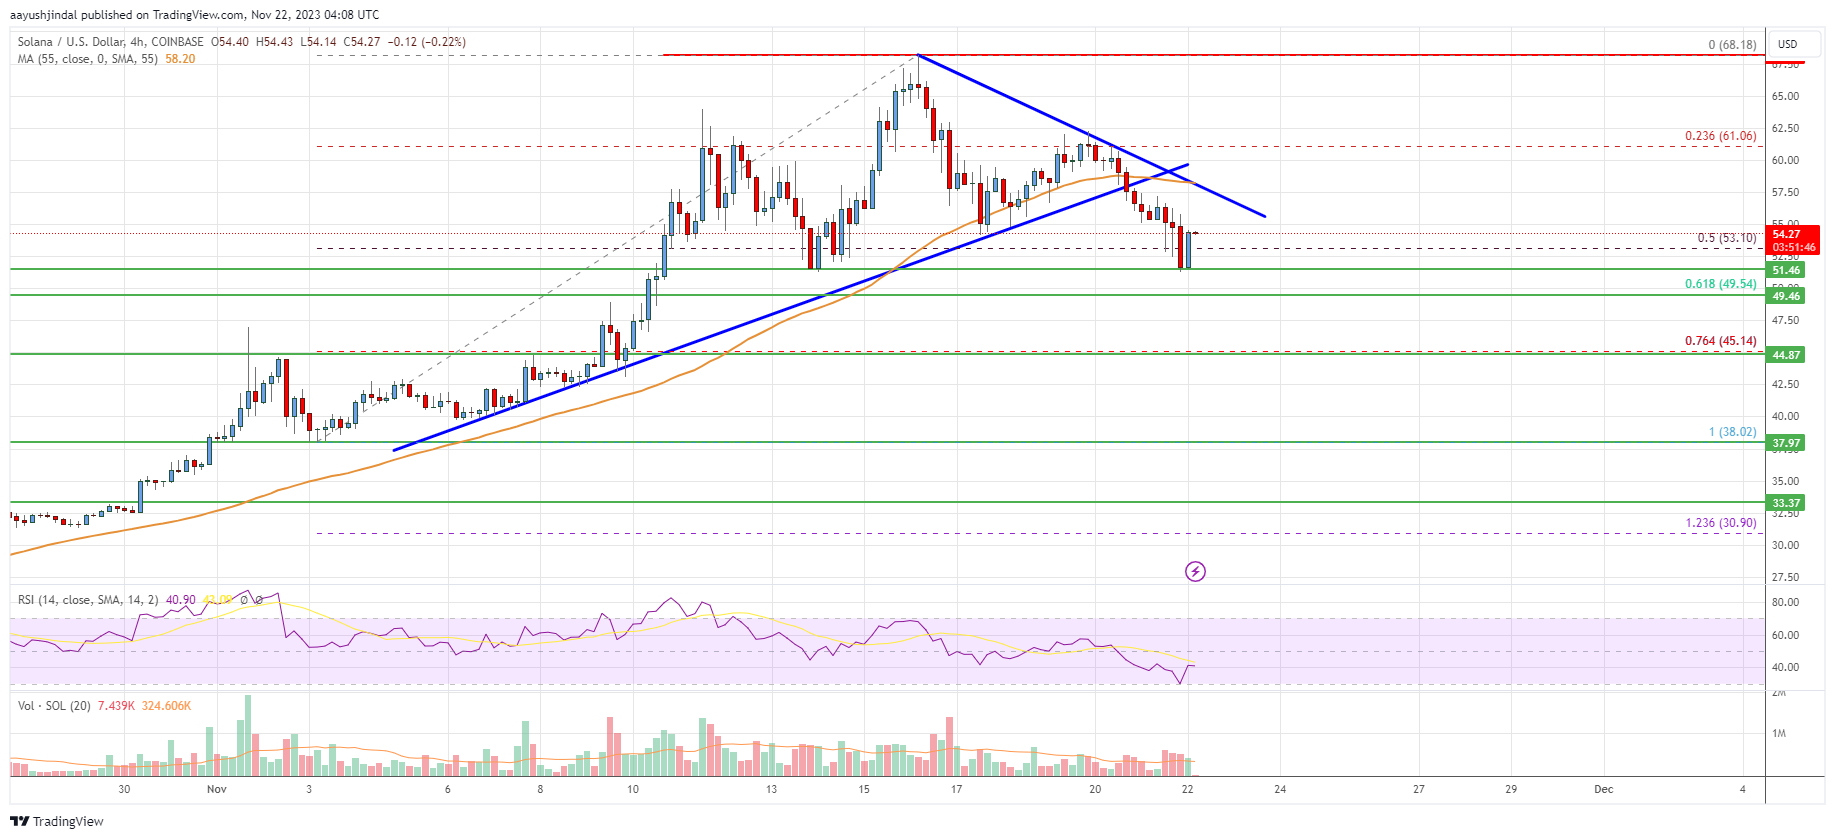
Looking at the chart, Solana price is clearly trading below $60 and the 55 simple moving average (4 hours). Overall, the price must stay above the $51.00 and $49.50 support levels to start another increase.
Technical Indicators
4 hours MACD – The MACD is now gaining momentum in the bearish zone.
4 hours RSI (Relative Strength Index) – The RSI is now below the 50 level.
Key Support Levels – $51.00 and $49.50.
Key Resistance Levels – $55.50, $58.00, and $62.50.