Stellar lumen price is attempting a fresh increase from the %excerpt%.1100 zone against the US Dollar. XLM price is now trading above %excerpt%.1125 and the 55 simple moving average (4 hours). There is a key bullish trend line forming with support near %excerpt%.1140 on the 4-hour chart (data feed via Kraken). The pair could start a decent increase if there is a clear move above the %excerpt%.1165 resistance zone. Stellar lumen price is trading above %excerpt%.1150 against the US Dollar, like Bitcoin. XLM price must clear %excerpt%.1165 to gain bullish momentum. Stellar Lumen Price Analysis (XLM to USD) After a steady increase, Stellar lumen price saw a rejection pattern near the %excerpt%.1200 zone against the US Dollar. The XLM/USD pair traded below the %excerpt%.1165 support and tested the %excerpt%.1100 zone. A low is
Topics:
Aayush Jindal considers the following as important: Altcoin News, News, Stellar Lumens, Trading, xlm
This could be interesting, too:
Emily John writes GRVT Launches Alertatron Trading Event and Airdrop Before TGE
Bilal Hassan writes Coinbase Expands in Nigeria with Onboard Global Partnership
Guest User writes XRP Price Faces Potential Drop: Leading KOL Warns of Imminent Correction with TD Sequential Sell Signal!
Bilal Hassan writes Bitget Expands in South Africa with Callpay Integration
- Stellar lumen price is attempting a fresh increase from the $0.1100 zone against the US Dollar.
- XLM price is now trading above $0.1125 and the 55 simple moving average (4 hours).
- There is a key bullish trend line forming with support near $0.1140 on the 4-hour chart (data feed via Kraken).
- The pair could start a decent increase if there is a clear move above the $0.1165 resistance zone.
Stellar lumen price is trading above $0.1150 against the US Dollar, like Bitcoin. XLM price must clear $0.1165 to gain bullish momentum.
Stellar Lumen Price Analysis (XLM to USD)
After a steady increase, Stellar lumen price saw a rejection pattern near the $0.1200 zone against the US Dollar. The XLM/USD pair traded below the $0.1165 support and tested the $0.1100 zone.
A low is formed near $0.1101 and the price is now attempting a recovery wave. There was a break above the $0.1132 resistance zone. The price climbed above the 50% Fib retracement level of the downward move from the $0.1204 swing high to the $0.1101 low.
XLM is now trading above $0.1150 and the 55 simple moving average (4 hours). There is also a key bullish trend line forming with support near $0.1140 on the 4-hour chart.
On the upside, the price is facing resistance near the $0.1165 zone or the 61.8% Fib retracement level of the downward move from the $0.1204 swing high to the $0.1101 low. The next major resistance is near the $0.1200 level.
A clear move above the $0.1200 level might send the price toward the $0.1250 level. Any more gains could lead the price toward the $0.1300 level or even $0.1320.
Initial support on the downside is near the $0.1140 level. The main support is near the $0.1125 zone. Any more losses could lead the price toward the $0.1100 level in the near term, below which the price might even retest $0.1050.
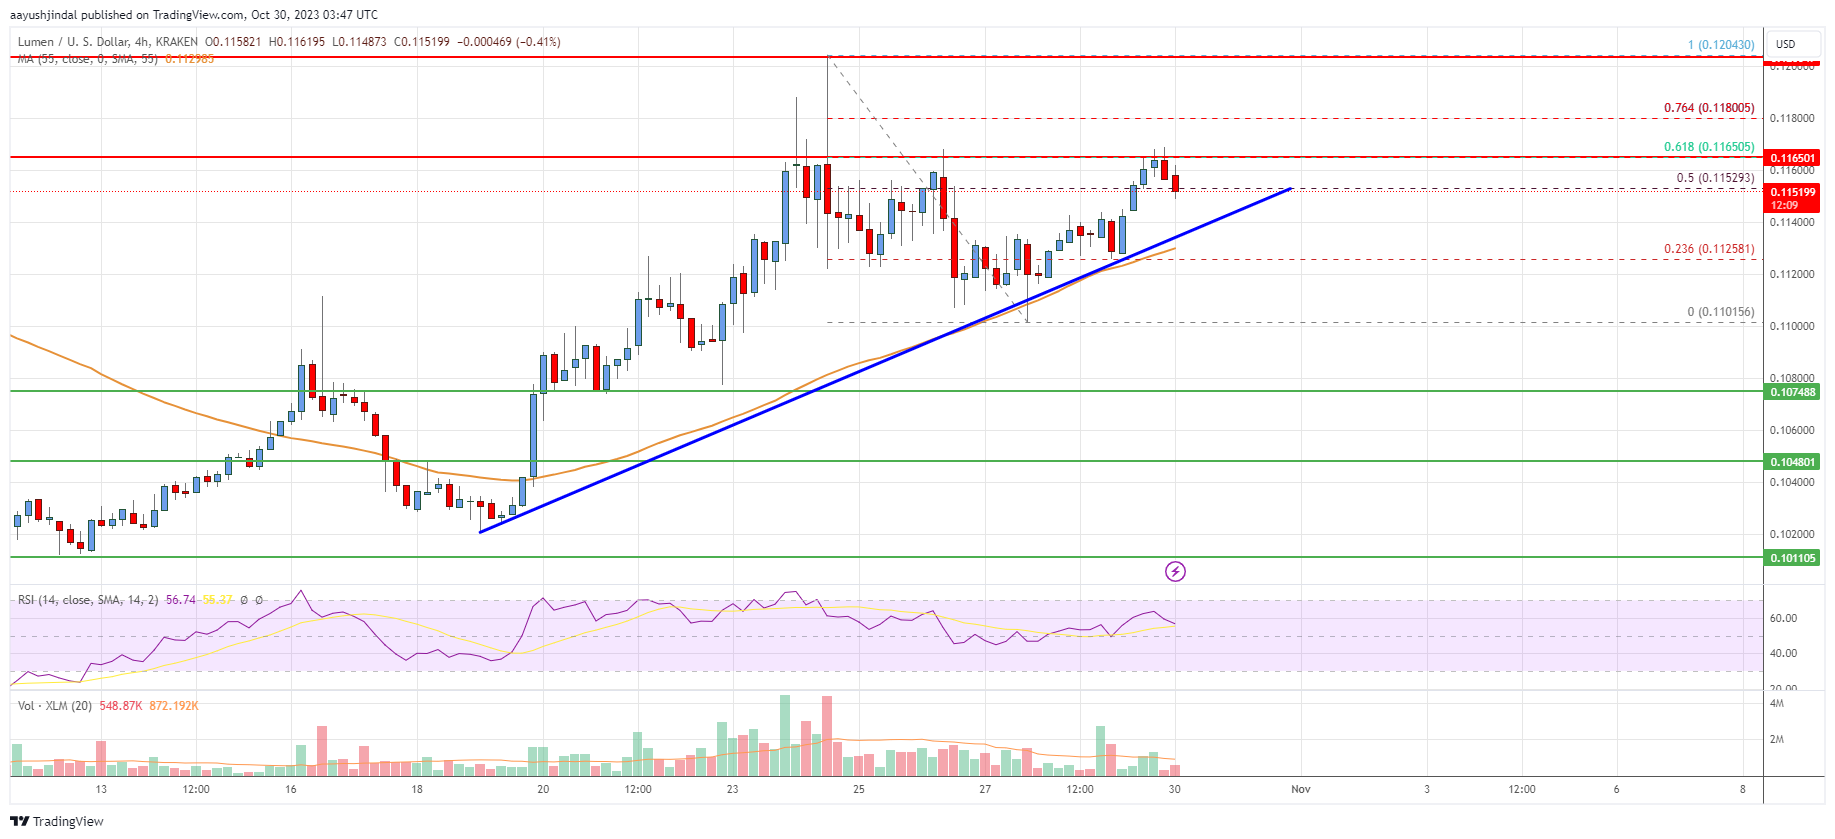
The chart indicates that XLM price is now trading above $0.1150 and the 55 simple moving average (4 hours). Overall, the price could start a major increase if there is a clear move above the $0.1165 resistance zone.
Technical Indicators
4 hours MACD – The MACD for XLM/USD is gaining momentum in the bullish zone.
4 hours RSI – The RSI for XLM/USD is now above the 50 level.
Key Support Levels – $0.1140 and $0.1132.
Key Resistance Levels – $0.1165, $0.1200, and $0.1250.