XRP price started a fresh decline below the %excerpt%.620 zone against the US dollar. The price is now trading below %excerpt%.600 and the 55 simple moving average (4 hours). There was a break below a key rising channel with support at %excerpt%.6125 on the 4-hour chart of the XRP/USD pair (data source from Bittrex). The pair could extend losses if it breaks the %excerpt%.588 support zone. XRP price is struggling below %excerpt%.620 against the US Dollar, unlike Bitcoin. The price could decline further if it settles below the %excerpt%.588 support in the near term. XRP Price Analysis In the past few days, Ripple’s XRP price started a fresh decline from well above %excerpt%.650 against the US Dollar. The XRP/USD pair gained bearish momentum below the %excerpt%.620 level. The bears were able to push the price below
Topics:
Aayush Jindal considers the following as important: Altcoin News, News, Trading, XRP
This could be interesting, too:
Emily John writes Ripple Unveils Institutional Roadmap Driving XRP Ledger Growth
Emily John writes GRVT Launches Alertatron Trading Event and Airdrop Before TGE
Bilal Hassan writes Coinbase Expands in Nigeria with Onboard Global Partnership
Emily John writes XRP Eyes Breakout – Will the Final Wave Spark a Rally?
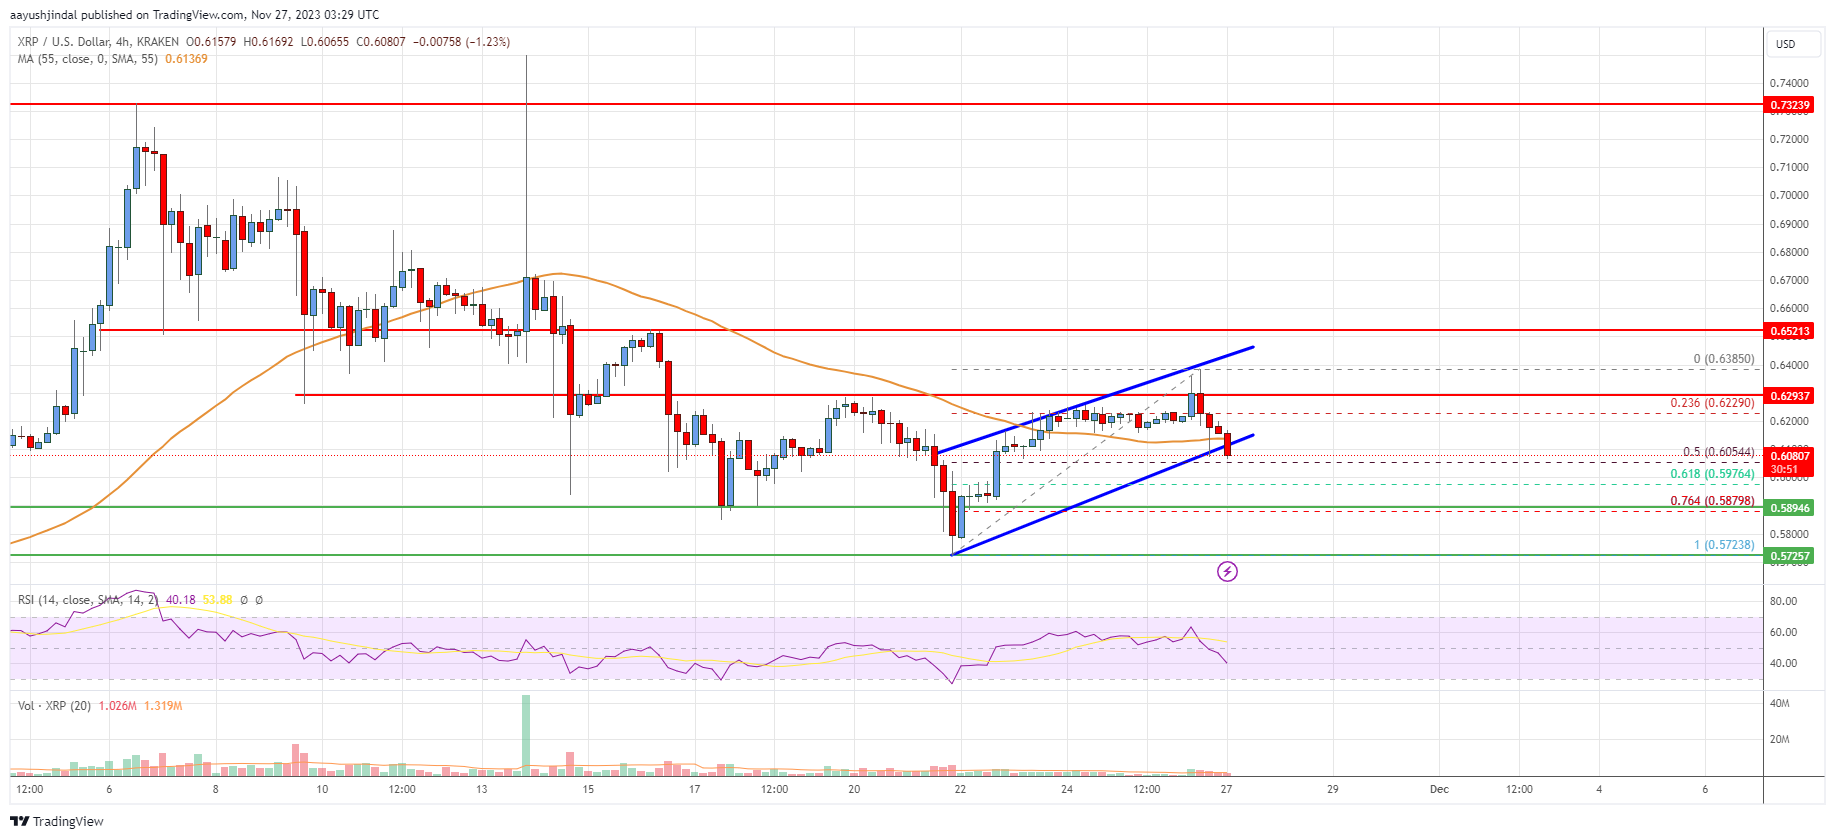
- XRP price started a fresh decline below the $0.620 zone against the US dollar.
- The price is now trading below $0.600 and the 55 simple moving average (4 hours).
- There was a break below a key rising channel with support at $0.6125 on the 4-hour chart of the XRP/USD pair (data source from Bittrex).
- The pair could extend losses if it breaks the $0.588 support zone.
XRP price is struggling below $0.620 against the US Dollar, unlike Bitcoin. The price could decline further if it settles below the $0.588 support in the near term.
XRP Price Analysis
In the past few days, Ripple’s XRP price started a fresh decline from well above $0.650 against the US Dollar. The XRP/USD pair gained bearish momentum below the $0.620 level.
The bears were able to push the price below the $0.600 support. It even traded below the 55 simple moving average (4 hours) and spiked below the $0.588 support. A low was formed near $0.5723 before there was an upside correction.
However, the price struggled near $0.6385 and is now moving lower. There was a break below a key rising channel with support at $0.6125 on the 4-hour chart of the XRP/USD pair.
XRP is now trading below $0.600 and the 55 simple moving average (4 hours). Initial support on the downside is near $0.605. It is close to the 50% Fib retracement level of the upward move from the $0.5732 swing low to the $0.6385 high.
The next major support is near the $0.588 level or the 76.4% Fib retracement level of the upward move from the $0.5732 swing low to the $0.6385 high. Any more losses could lead the price toward the $0.550 level, below which the price might even test $0.520.
On the upside, the price is facing resistance near $0.620. The next major resistance is near the $0.635 level. A clear move above $0.635 might start a fresh increase. In the stated case, the price could even surpass the $0.650 resistance. Any more gains might send the price toward the $0.785 resistance.
Looking at the chart, XRP price is now trading below the $0.620 zone and the 55 simple moving average (4 hours). Overall, the price could extend losses if it breaks the $0.588 support zone.
Technical indicators
4 hours MACD – The MACD for XRP/USD is now gaining momentum in the bearish zone.
4 hours RSI (Relative Strength Index) – The RSI for XRP/USD is below the 50 level.
Key Support Levels – $0.605, $0.588, and $0.550.
Key Resistance Levels – $0.620 and $0.635.