Ripple’s price has been gradually declining, forming lower highs and lows against both USDT and BTC. Despite this, investors can still be optimistic, as a potential rebound from the nearby support level is possible. Technical Analysis By Edris The USDT Paired Chart The price has been going through a bearish trend on the daily timeframe against USDT. The 200-day moving average, located around the %excerpt%.5 mark, is currently acting as resistance, preventing the price from rising toward the %excerpt%.55 resistance zone. If the 200-day moving average holds, it is likely that the market will drop to the %excerpt%.43 support level in the short term. The RSI indicator also shows values below 50%, indicating that the momentum is in favor of the sellers, and a retest of the mentioned %excerpt%.43 level is
Topics:
CryptoVizArt considers the following as important: Ripple (XRP) Price, XRP Analysis, xrpbtc, xrpusd
This could be interesting, too:
Jordan Lyanchev writes Ripple’s (XRP) Surge to Triggers Over Million in Short Liquidations
Jordan Lyanchev writes Trump Confirms Work on Strategic Crypto Reserve: XRP, ADA, SOL Included
Dimitar Dzhondzhorov writes Is a Major Ripple v. SEC Lawsuit Development Expected This Week? Here’s Why
Mandy Williams writes Ripple Releases Institutional DeFi Roadmap for XRP Ledger in 2025
Ripple’s price has been gradually declining, forming lower highs and lows against both USDT and BTC.
Despite this, investors can still be optimistic, as a potential rebound from the nearby support level is possible.
Technical Analysis
By Edris
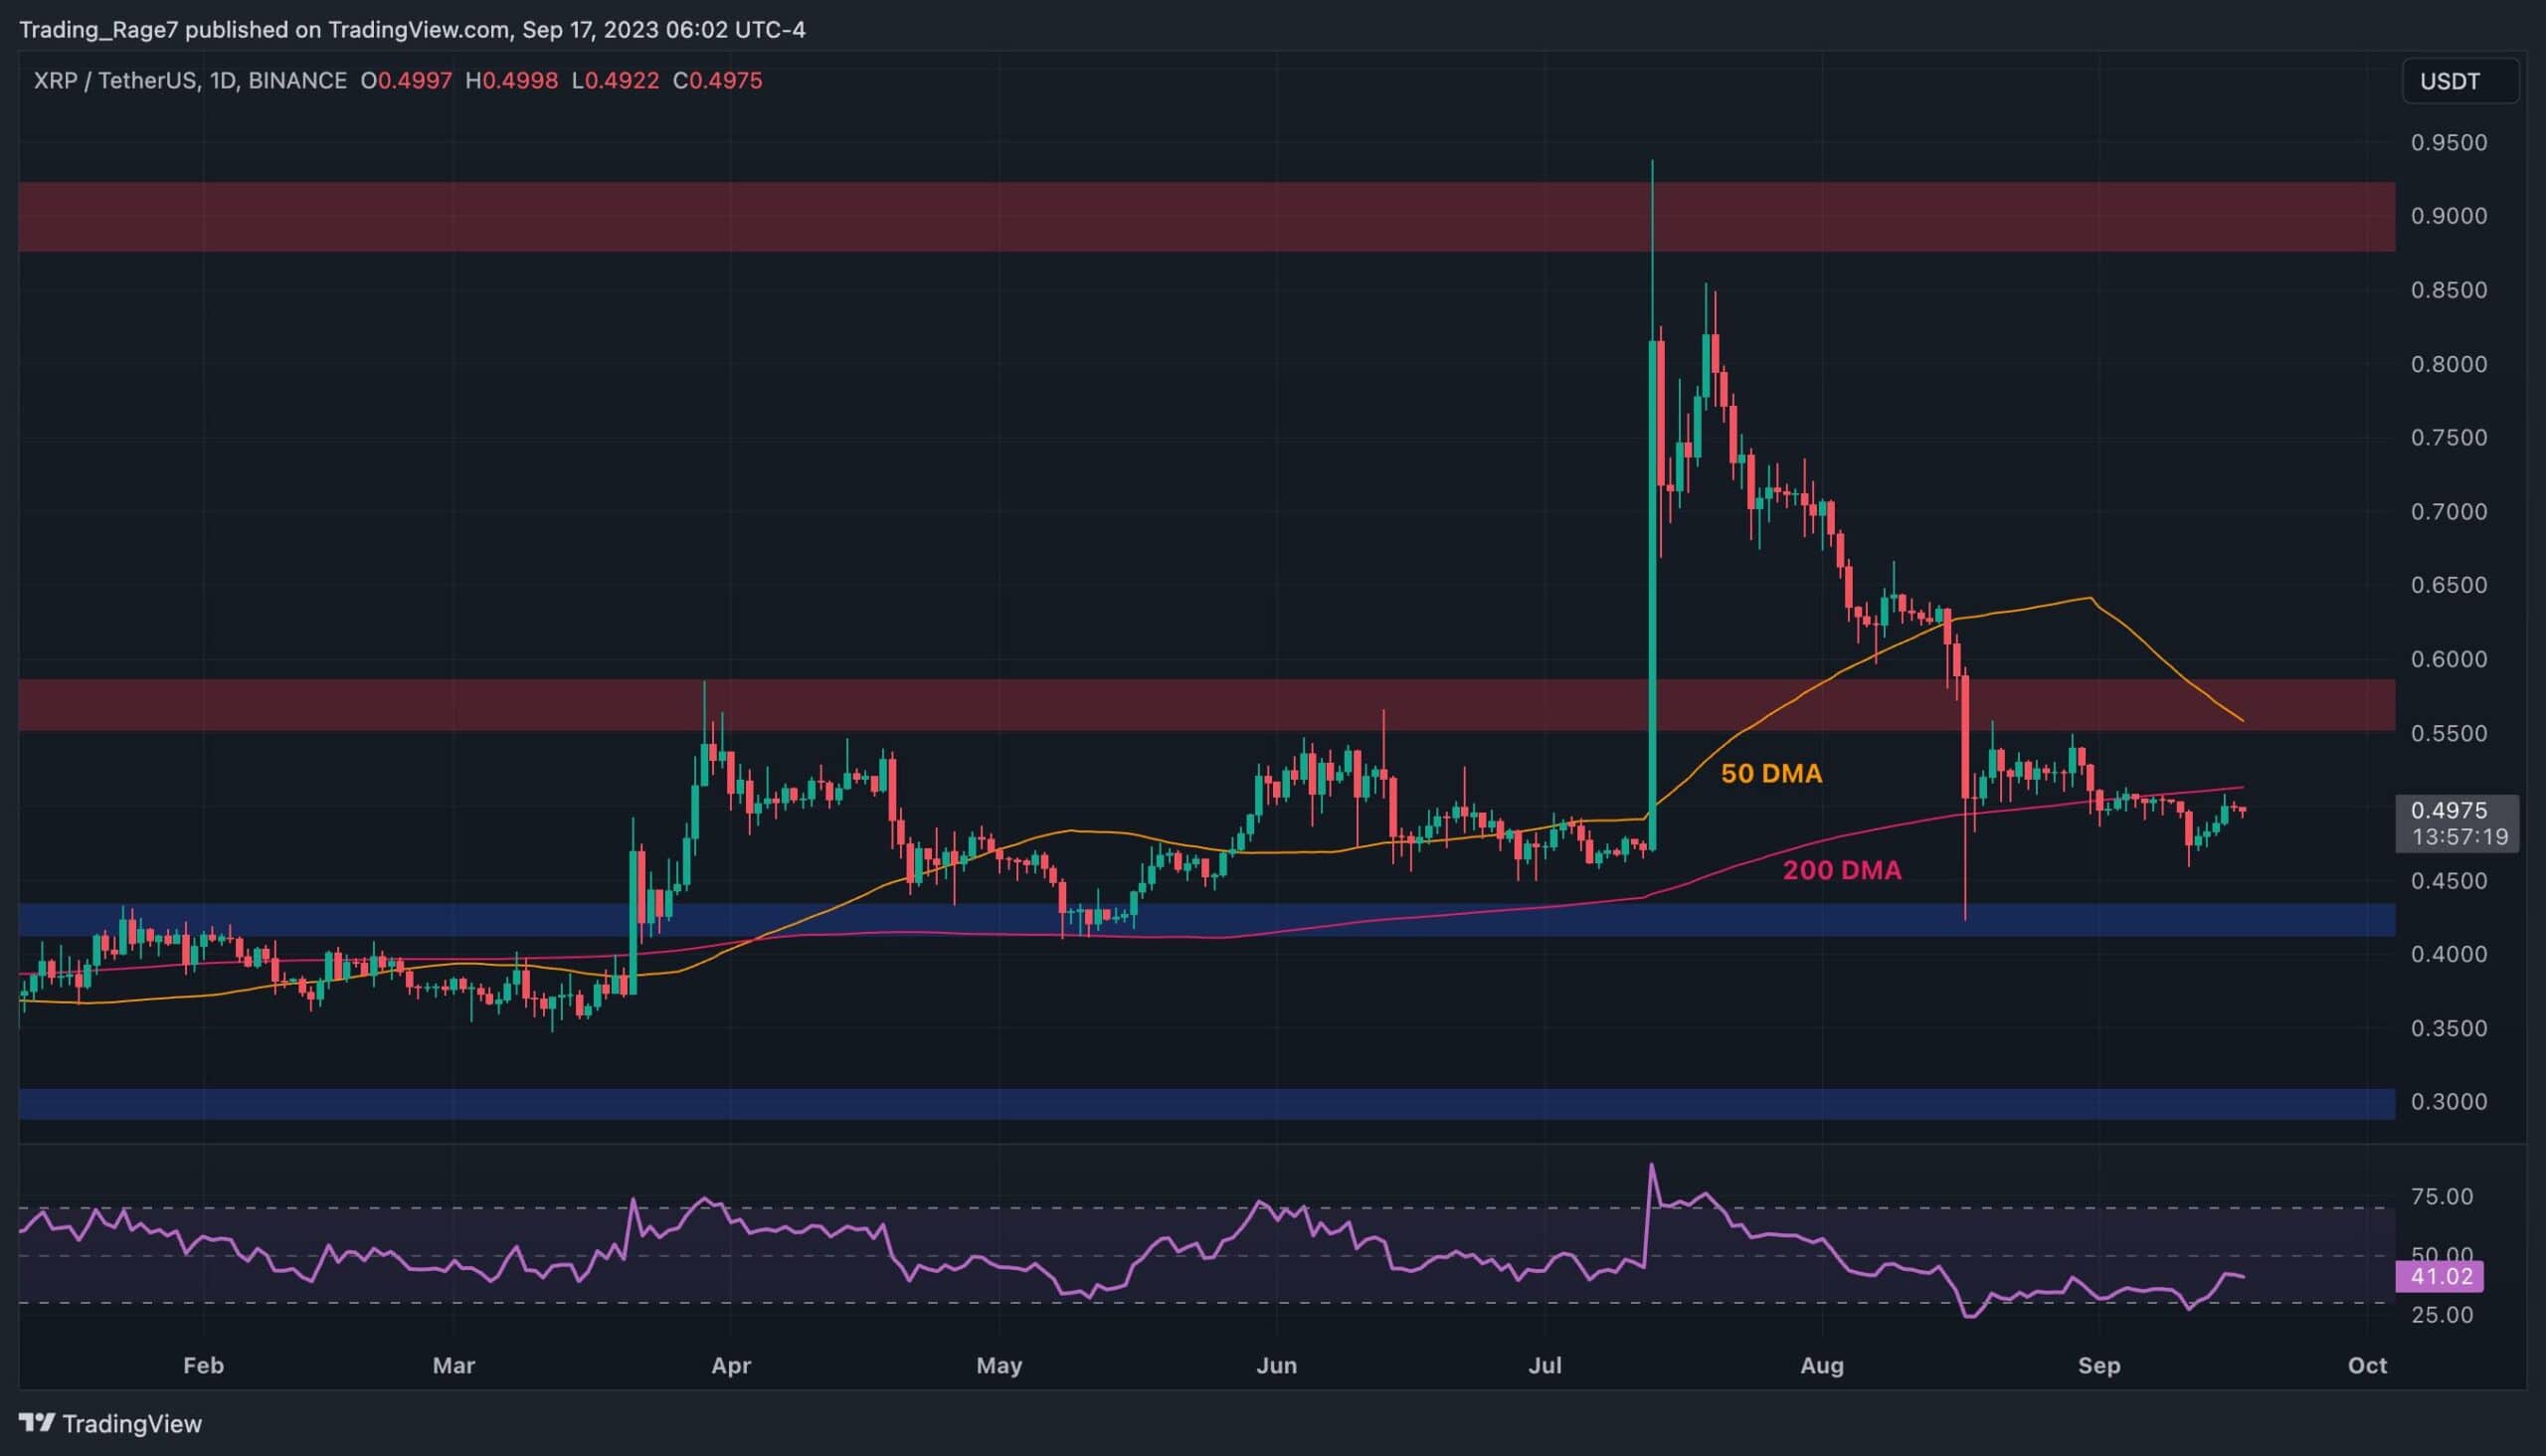
The USDT Paired Chart
The price has been going through a bearish trend on the daily timeframe against USDT. The 200-day moving average, located around the $0.5 mark, is currently acting as resistance, preventing the price from rising toward the $0.55 resistance zone.
If the 200-day moving average holds, it is likely that the market will drop to the $0.43 support level in the short term. The RSI indicator also shows values below 50%, indicating that the momentum is in favor of the sellers, and a retest of the mentioned $0.43 level is probable.
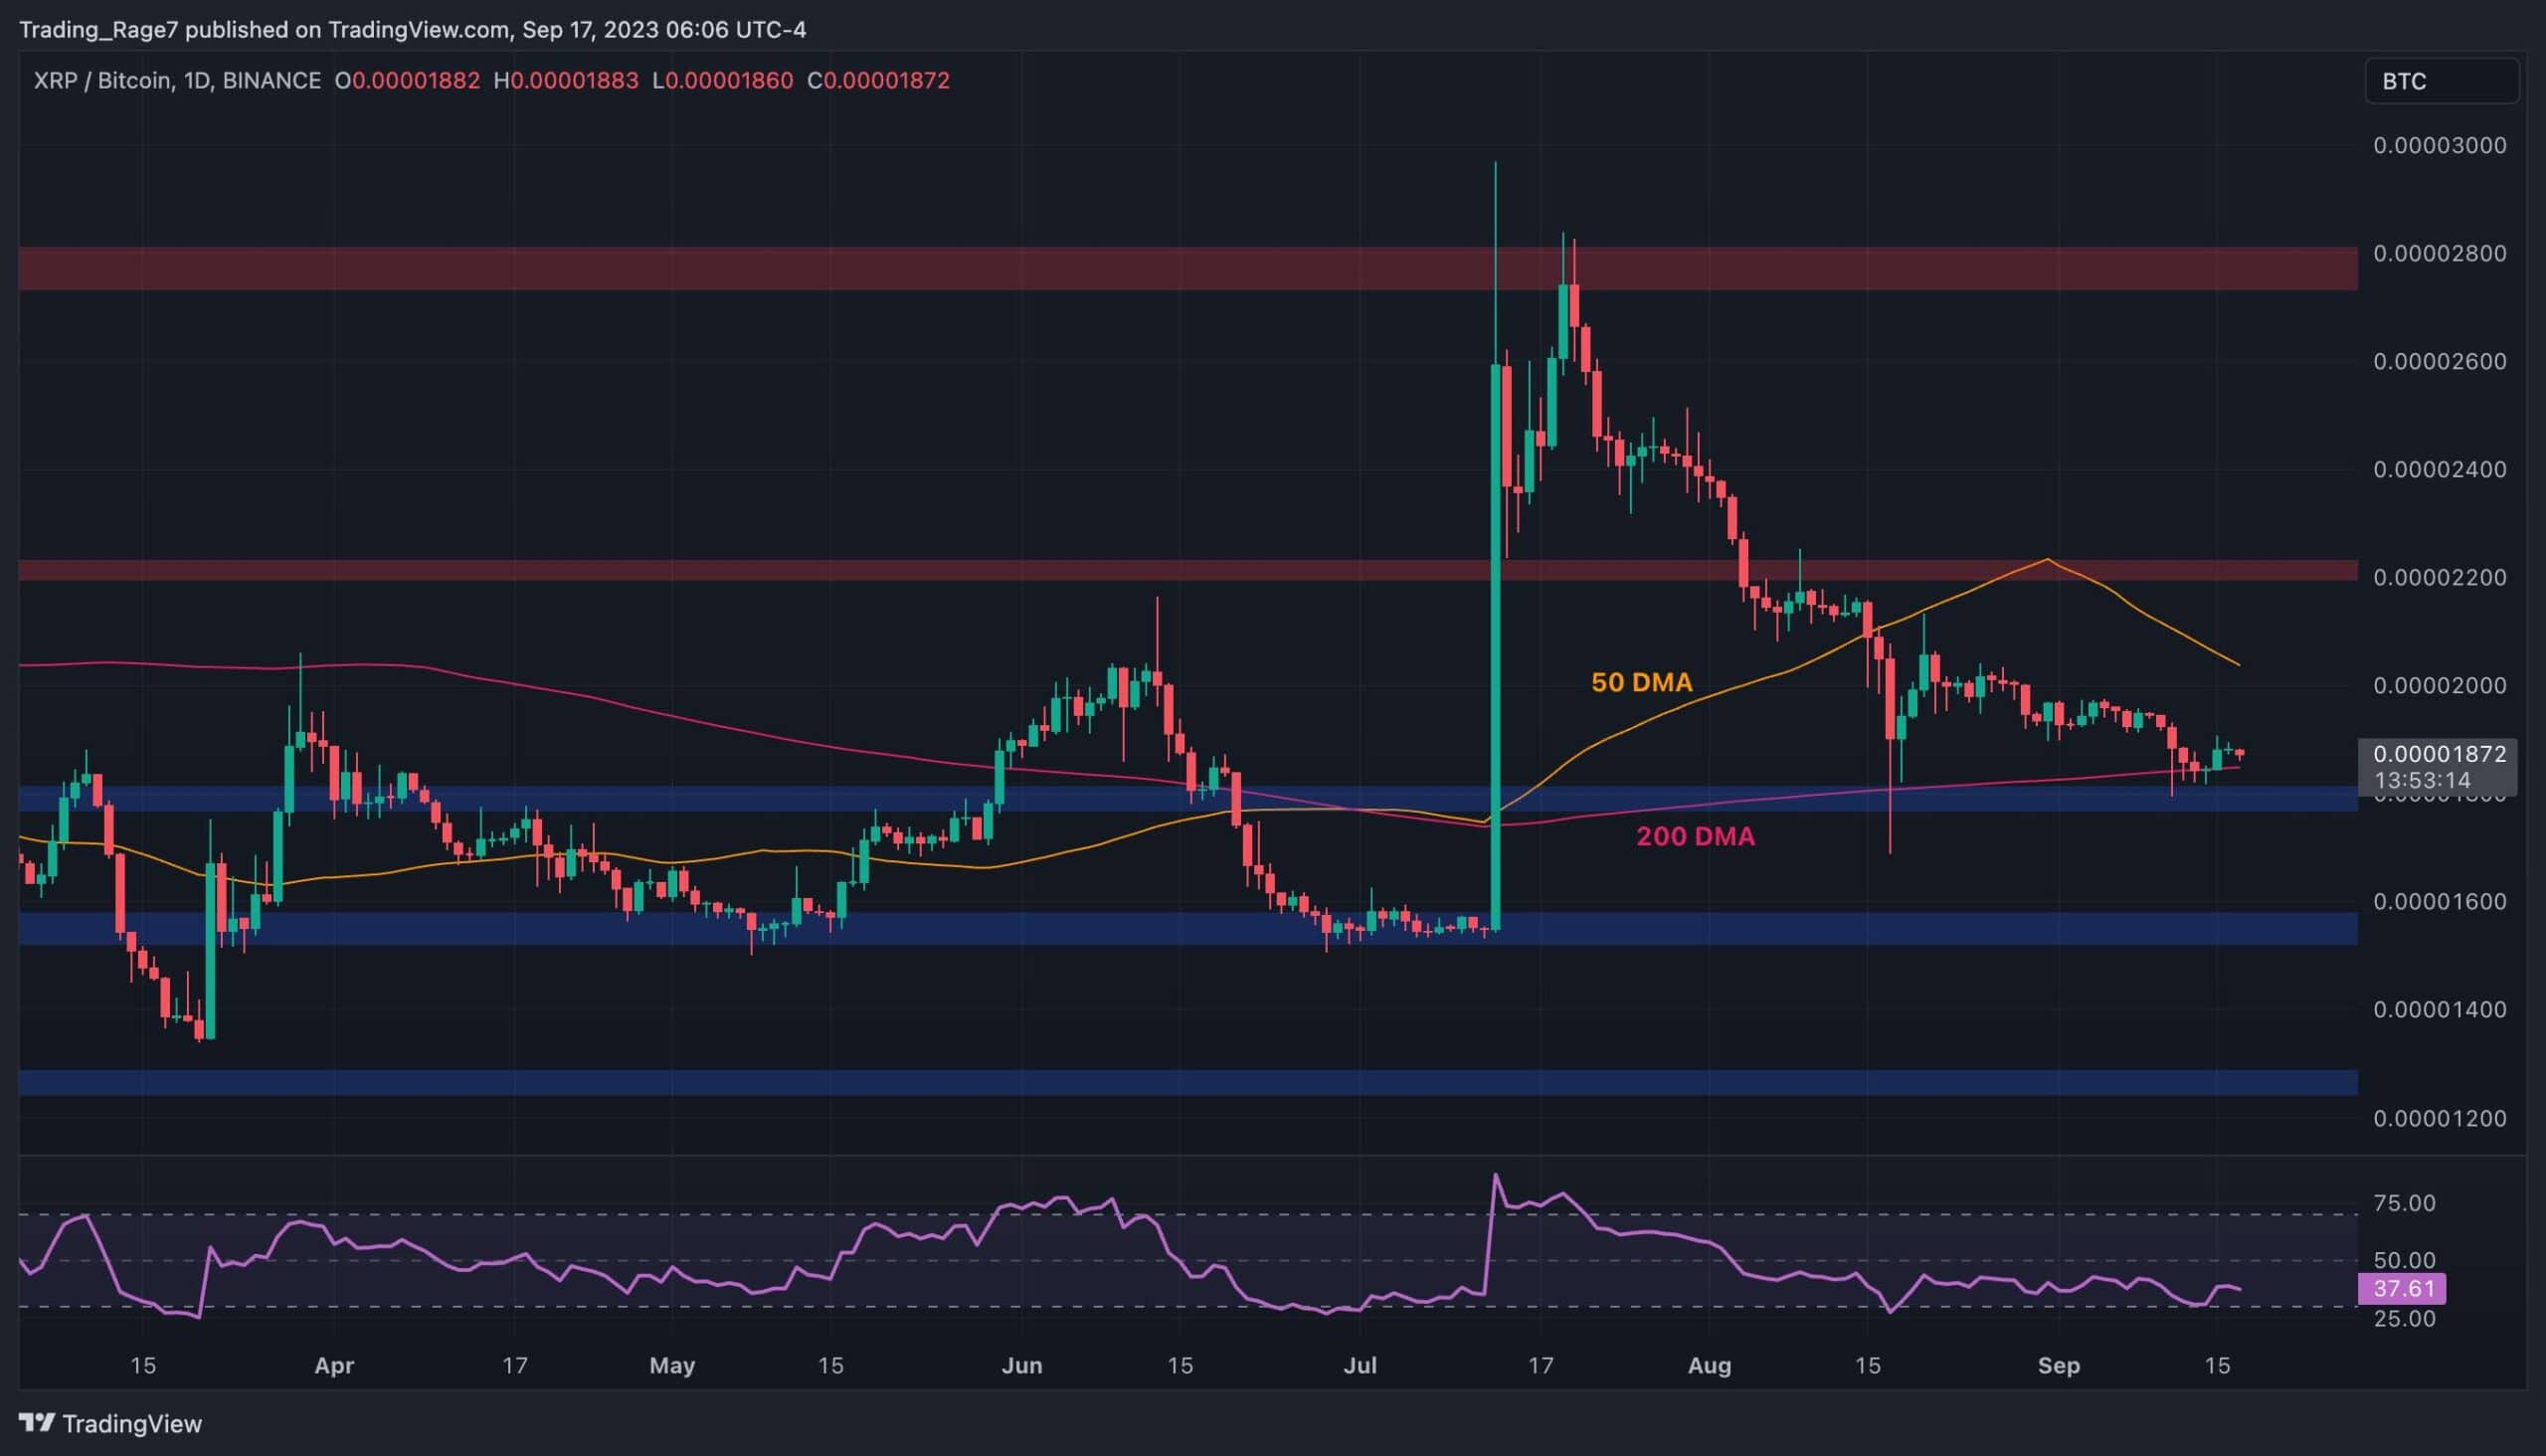
The BTC Paired Chart
Against BTC, the price action is looking more interesting, as XRP has reached a significant support level at the 1800 SAT area. The 200-day moving average, located near the same zone, is also providing crucial support. If this level breaks down, the situation could become unfavorable for XRP, and a subsequent crash would be likely.
On the other hand, if there is a short-term rebound, the price would first need to surpass the 50-day moving average, which is currently around the 2000 SAT mark, before aiming for higher targets.