After facing rejection for several weeks and experiencing a series of bearish developments, the price of Ethereum reached a critical point near a pivotal support area. This includes the 61.8% Fibonacci retracement level. Fortunately, the price returned from this crucial zone, providing hope amidst the prevailing bearish sentiment. This rebound also indicates the possibility of a temporary consolidation phase. By Shayan Ethereum’s price has been in a prolonged downtrend, breaking multiple support levels, including the crucial 100 and 200-day moving averages. As a result, Ethereum reached a multi-month low at ,531. However, at this point, Ethereum’s price encountered a critical support zone, spanning the range between the 50% and 61.8% Fibonacci retracement levels.
Topics:
CryptoVizArt considers the following as important: ETH Analysis, ETHBTC, Ethereum (ETH) Price, ethusd
This could be interesting, too:
Mandy Williams writes Ethereum Derivatives Metrics Signal Modest Downside Tail Risk Ahead: Nansen
Jordan Lyanchev writes Weekly Bitcoin, Ethereum ETF Recap: Light at the End of the Tunnel for BTC
CryptoVizArt writes Will Weak Momentum Drive ETH to .5K? (Ethereum Price Analysis)
Jordan Lyanchev writes Bybit Hack Fallout: Arthur Hayes, Samson Mow Push for Ethereum Rollback
After facing rejection for several weeks and experiencing a series of bearish developments, the price of Ethereum reached a critical point near a pivotal support area. This includes the 61.8% Fibonacci retracement level.
Fortunately, the price returned from this crucial zone, providing hope amidst the prevailing bearish sentiment. This rebound also indicates the possibility of a temporary consolidation phase.
By Shayan
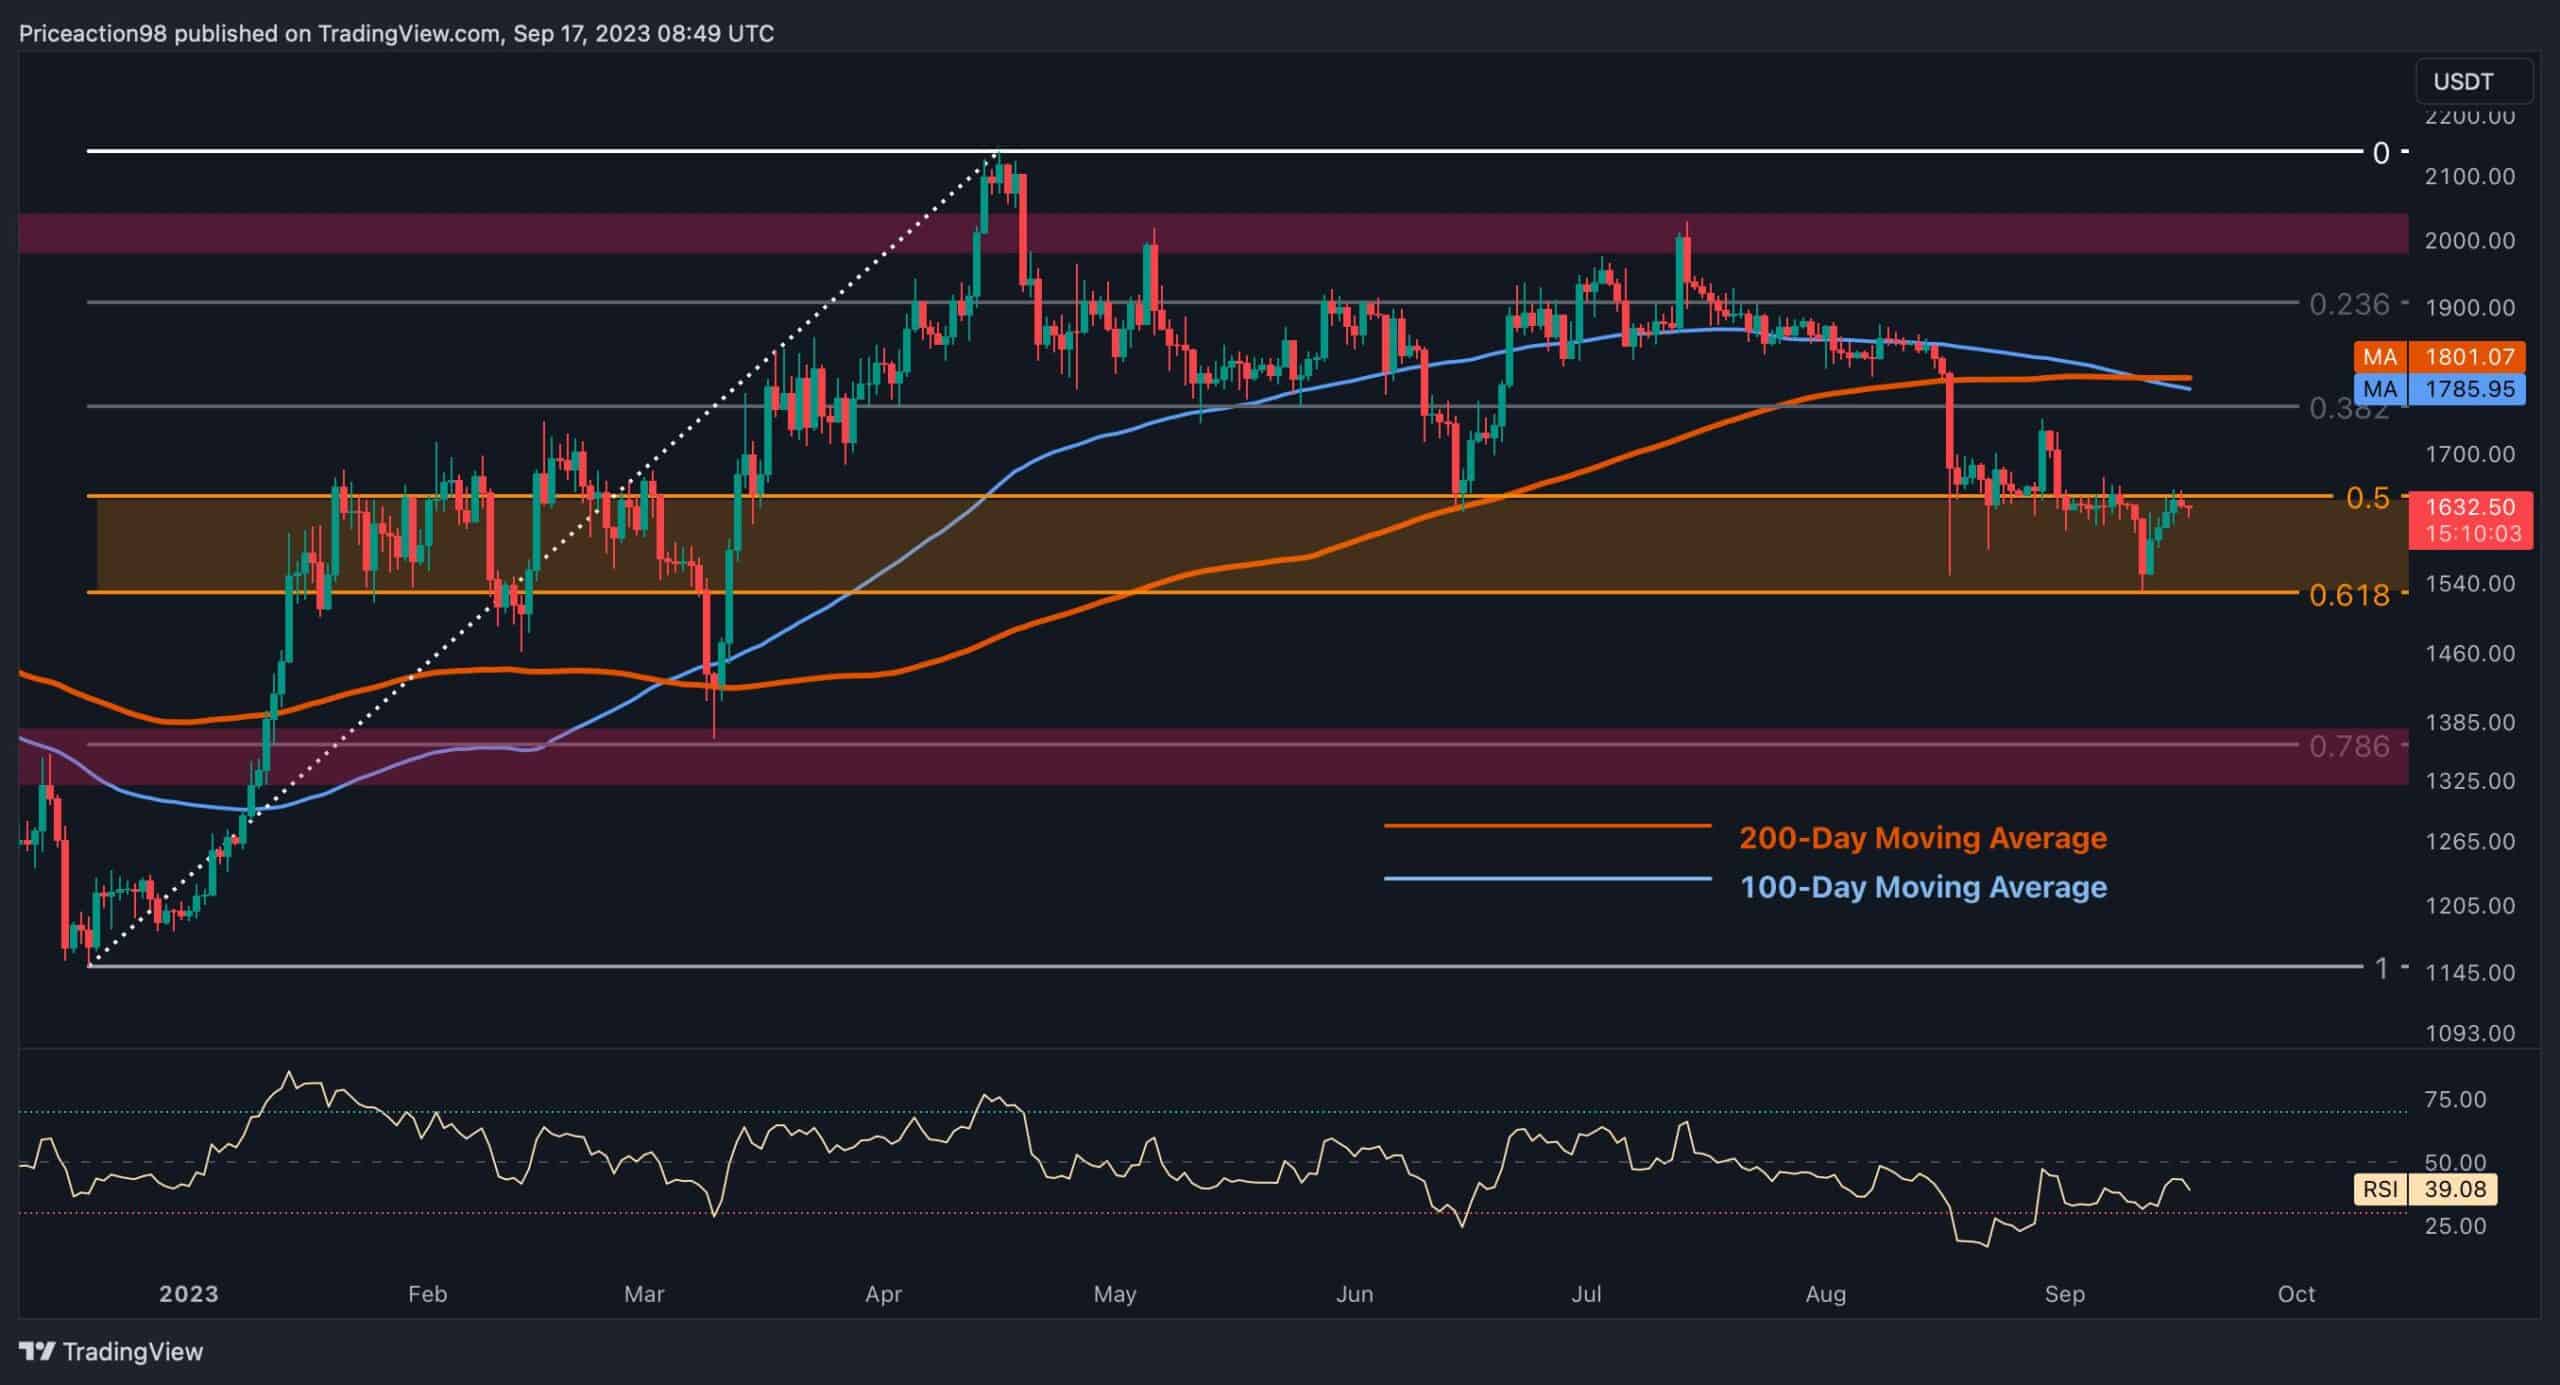
Ethereum’s price has been in a prolonged downtrend, breaking multiple support levels, including the crucial 100 and 200-day moving averages. As a result, Ethereum reached a multi-month low at $1,531. However, at this point, Ethereum’s price encountered a critical support zone, spanning the range between the 50% and 61.8% Fibonacci retracement levels.
Despite this, market participants see this range as the final defense for Ethereum bulls. If the price drops below this threshold, it could increase the likelihood of a significant downward plunge.
In addition to these bearish signals, the 100-day moving average crossed below the 200-day moving average, forming a death cross event, which is a strong bearish signal. However, despite these bearish indicators, there is still hope that the price could find support and enter a consolidation phase, moving around the 200-day and 100-day moving averages.
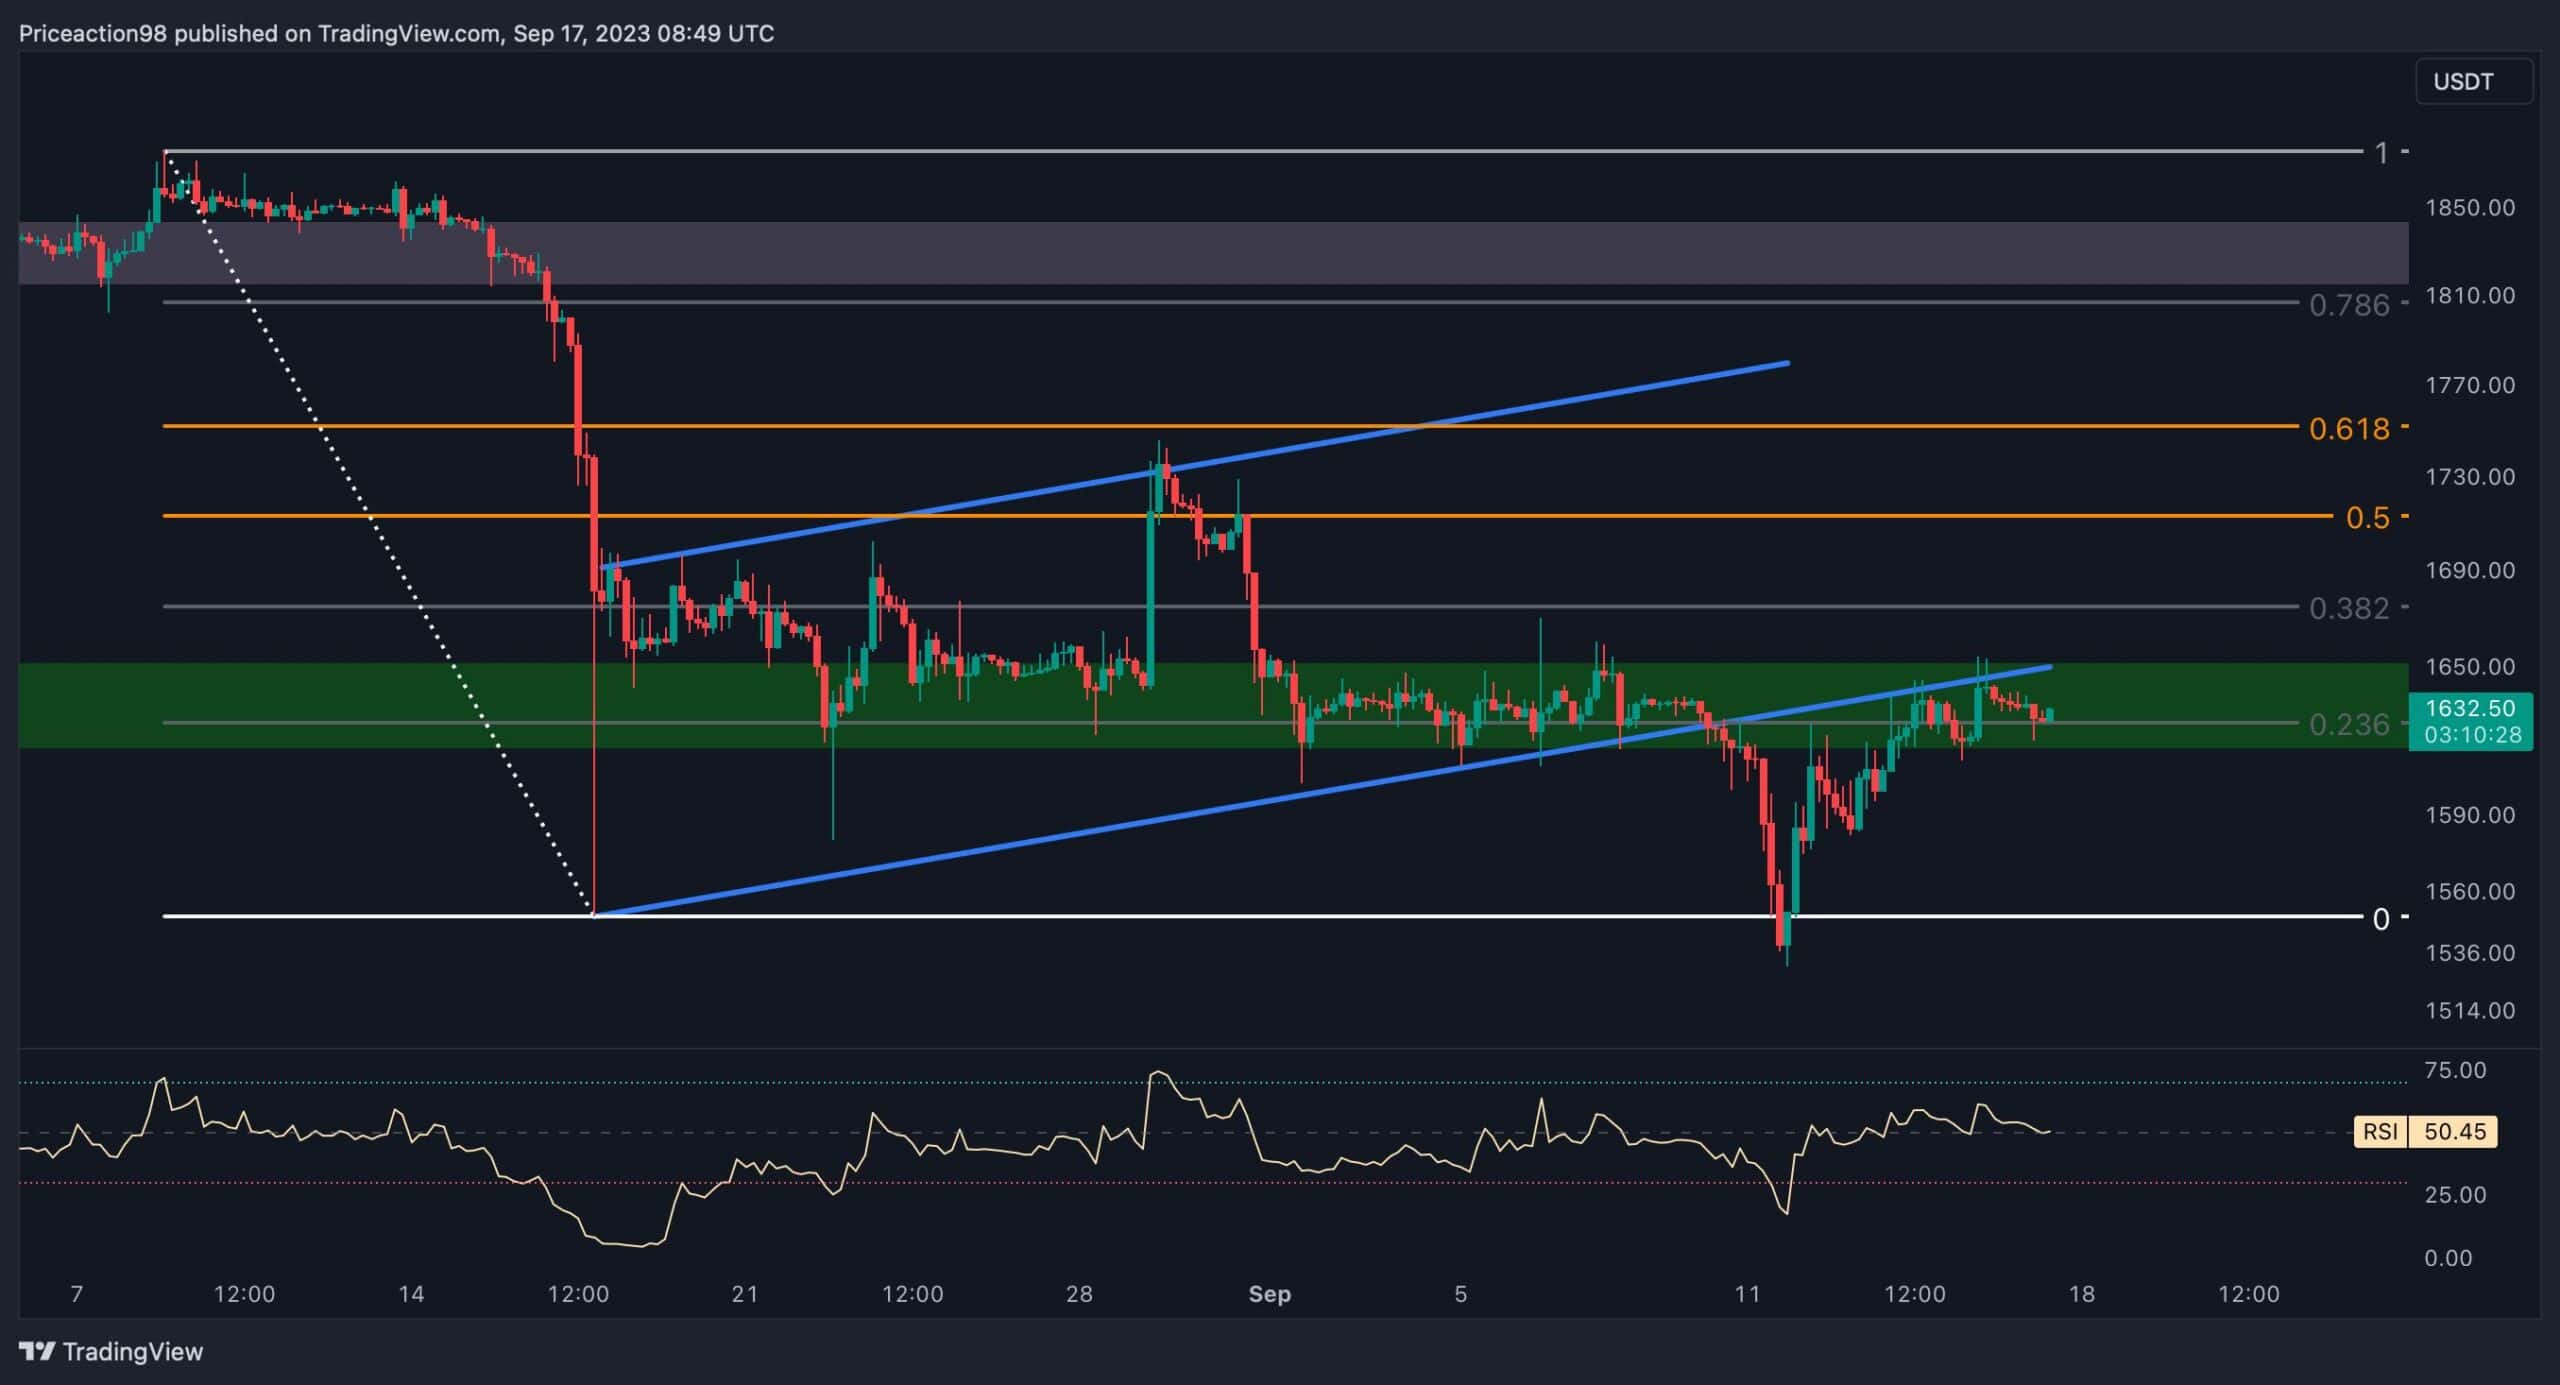
Shifting our focus to the 4-hour timeframe, we can see that Ethereum’s price underwent a consolidation phase between the $1.6K-$1.8K price range. During this period, a bearish flag pattern formed, and eventually, the price broke below the lower trendline of the flag, triggering a significant downward movement.
However, as Ethereum approached the critical support level at $1.5K, buying pressure intensified, leading to a rebound. This resulted in a retracement towards the lower threshold of the broken flag, potentially forming a pullback. If this pullback occurs successfully, it could indicate the start of another downward phase, aiming to break below the $1.5K mark.
On the other hand, if the price fails to complete the pullback and instead breaks above the trendline, market participants may anticipate a surge toward the $1.7K resistance level. Therefore, it is crucial to closely monitor these price fluctuations, as the upcoming price action around these significant support and resistance levels will likely determine Ethereum’s mid-term trajectory.
By Shayan
The provided chart displays the Taker Buy Sell Ratio metric, complemented by a 30-day simple moving average, alongside Ethereum’s price. This metric helps assess whether buyers or sellers are aggressively executing their orders. Positive values typically indicate bullish sentiment, while negative values are bearish indicators.
However, Ethereum’s price has been on a downtrend recently, repeatedly facing rejection around the $2,000 resistance level. The metric has consistently remained negative for the past few months, reflecting a prevailing bearish sentiment in the ETH futures market.
Nevertheless, there has been a notable shift in this metric as it suddenly surged, bringing its value closer to the neutral 0 line. This surge suggests a potential change in sentiment among market participants, indicating a shift towards a more bullish stance.
If this metric continues its upward trajectory and enters positive territory, it could signal the beginning of a new phase characterized by bullish price action. In such a scenario, Ethereum’s price may experience an upsurge, potentially targeting higher resistance levels.
