Technical Analysis By TradingRage Ripple’s price has been trending down over the past couple of weeks as it failed to sustain its bullish momentum. At the moment, the market is in a critical area against both the USDT and BTC. The USDT Paired Chart On the USDT paired chart, the price has been on the decline recently and is currently testing the %excerpt%.6 support level. In case this level breaks down, the 200-day moving average located around the %excerpt%.55 mark would be the next support element to potentially push the price to the upside. A drop below this key moving average would likely lead to disastrous results, as the market trend would be considered bearish once again. Source: TradingViewThe BTC Paired Chart Against BTC, things are quite similar. The price has failed to hold
Topics:
CryptoVizArt considers the following as important: Ripple (XRP) Price, XRP Analysis, xrpbtc, xrpusd
This could be interesting, too:
Jordan Lyanchev writes Ripple’s (XRP) Surge to Triggers Over Million in Short Liquidations
Jordan Lyanchev writes Trump Confirms Work on Strategic Crypto Reserve: XRP, ADA, SOL Included
Dimitar Dzhondzhorov writes Is a Major Ripple v. SEC Lawsuit Development Expected This Week? Here’s Why
Mandy Williams writes Ripple Releases Institutional DeFi Roadmap for XRP Ledger in 2025
Technical Analysis
By TradingRage
Ripple’s price has been trending down over the past couple of weeks as it failed to sustain its bullish momentum. At the moment, the market is in a critical area against both the USDT and BTC.
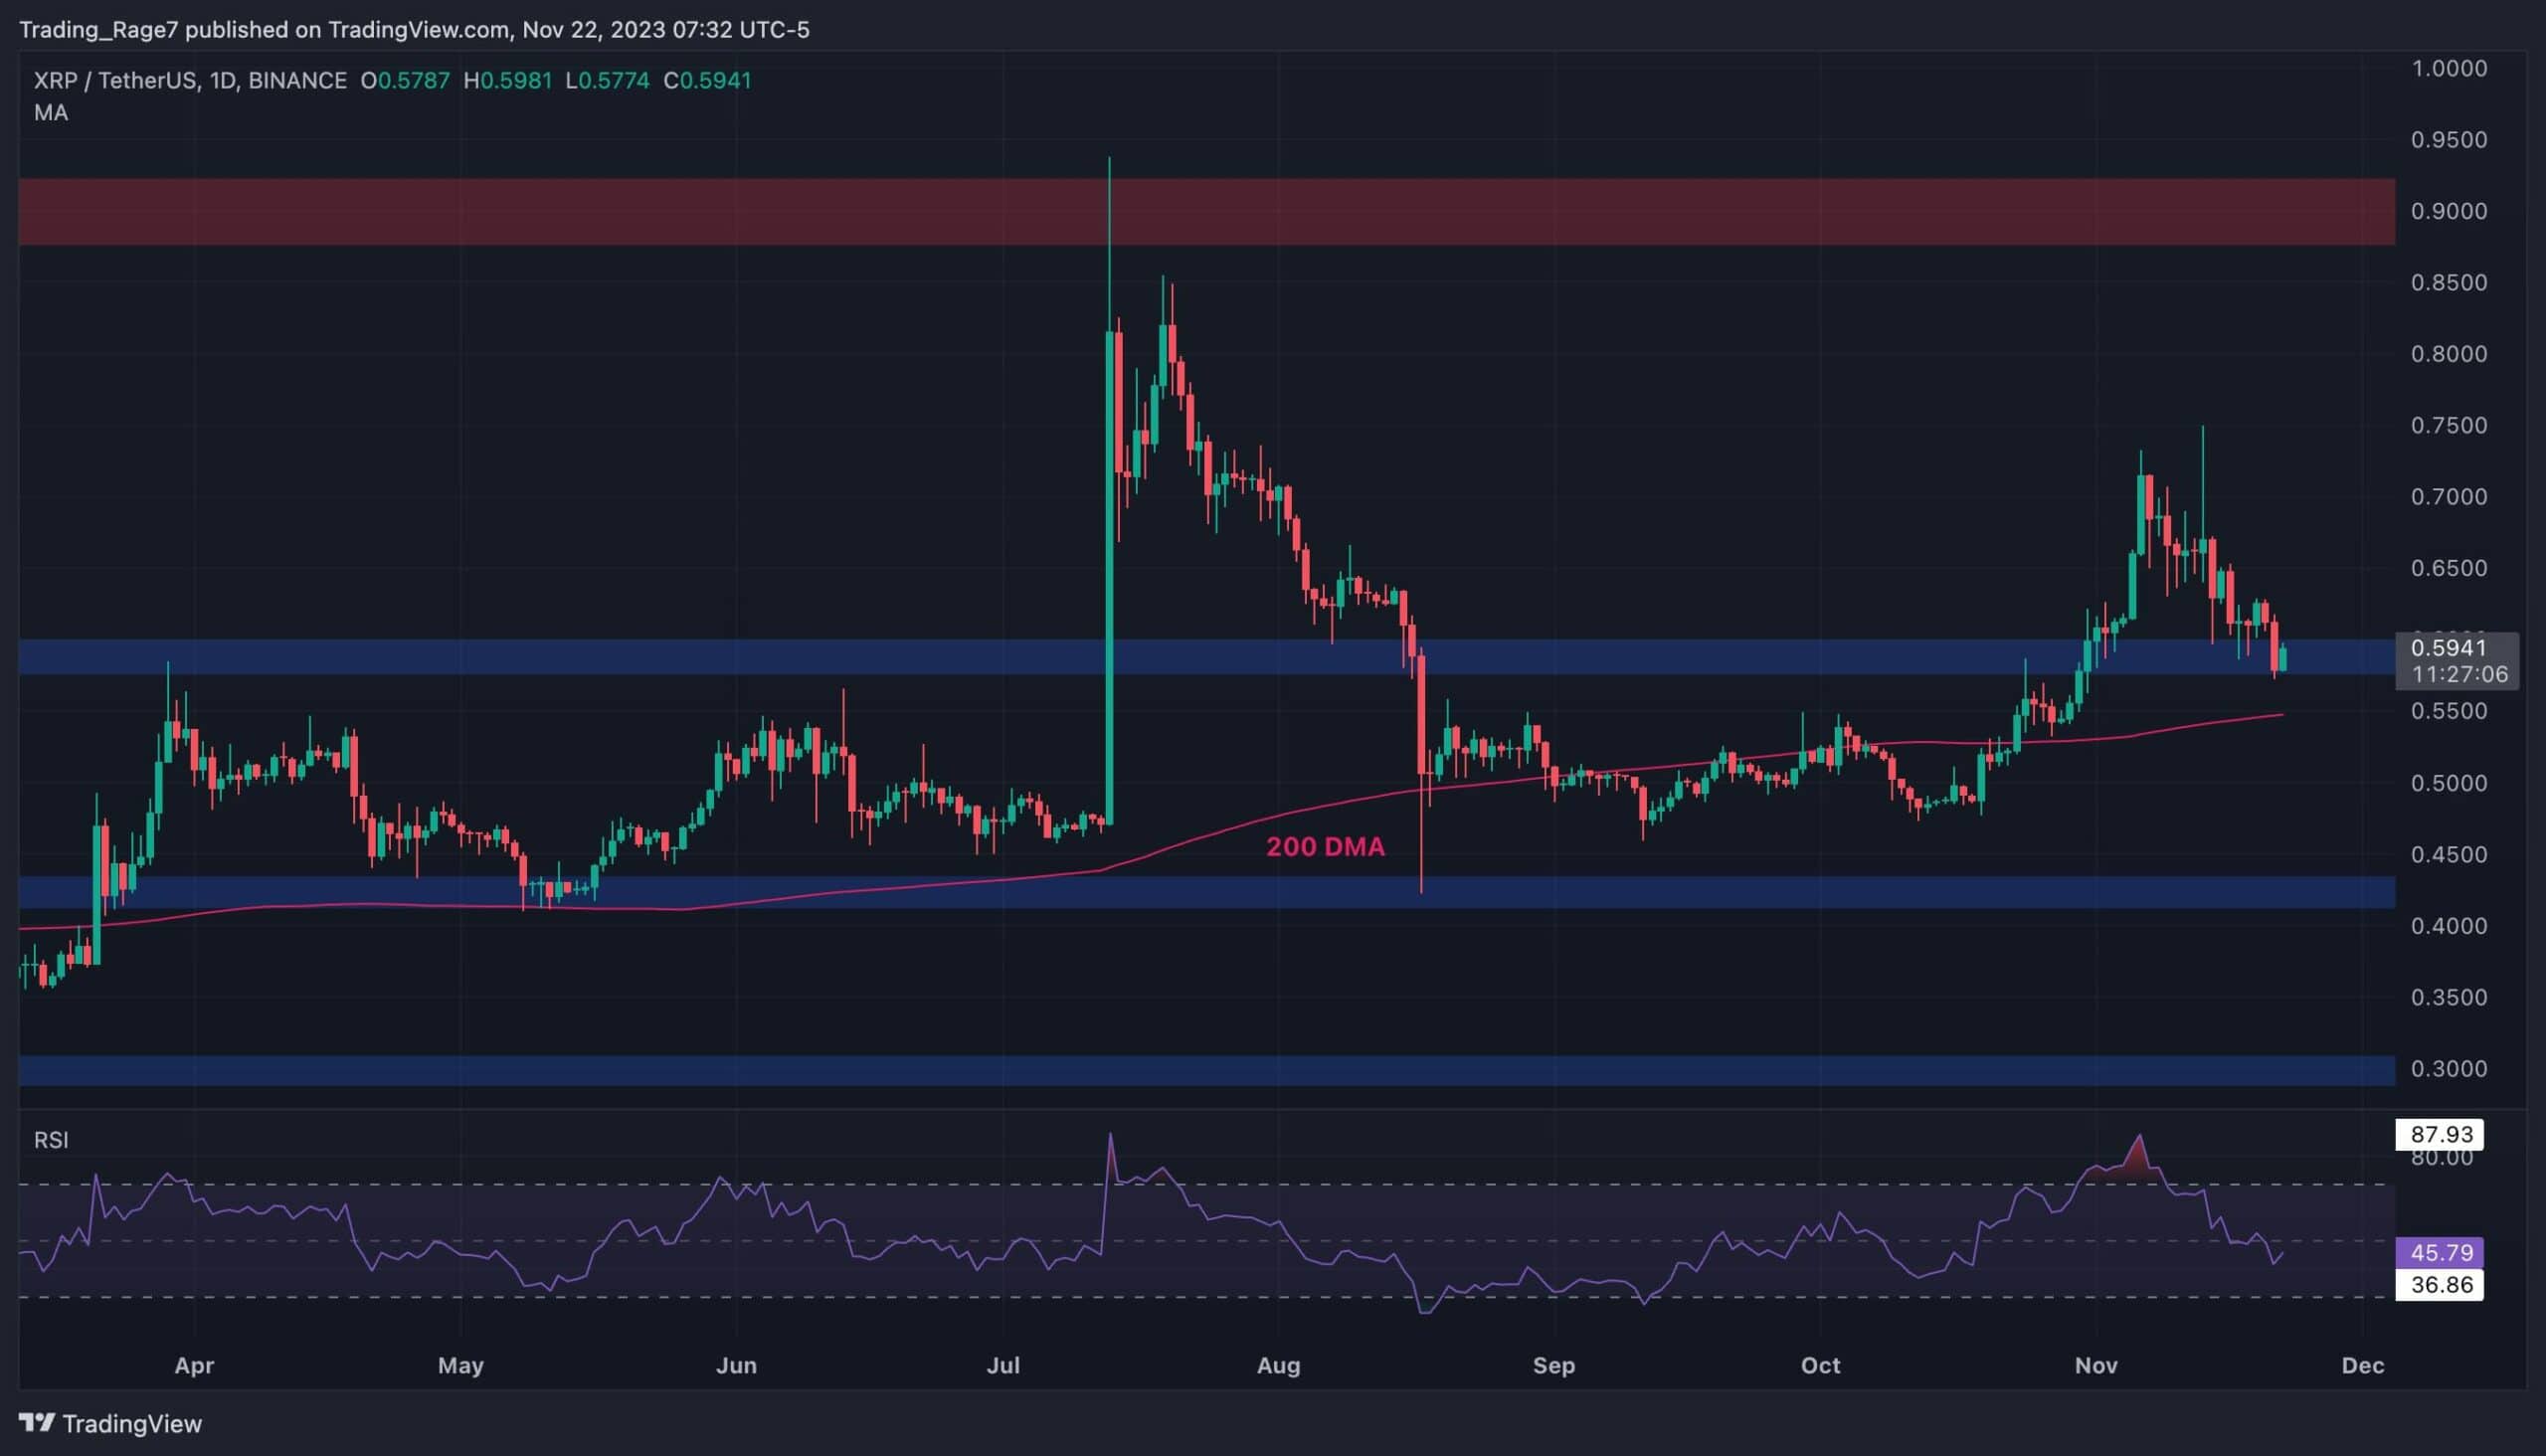
The USDT Paired Chart
On the USDT paired chart, the price has been on the decline recently and is currently testing the $0.6 support level. In case this level breaks down, the 200-day moving average located around the $0.55 mark would be the next support element to potentially push the price to the upside.
A drop below this key moving average would likely lead to disastrous results, as the market trend would be considered bearish once again.
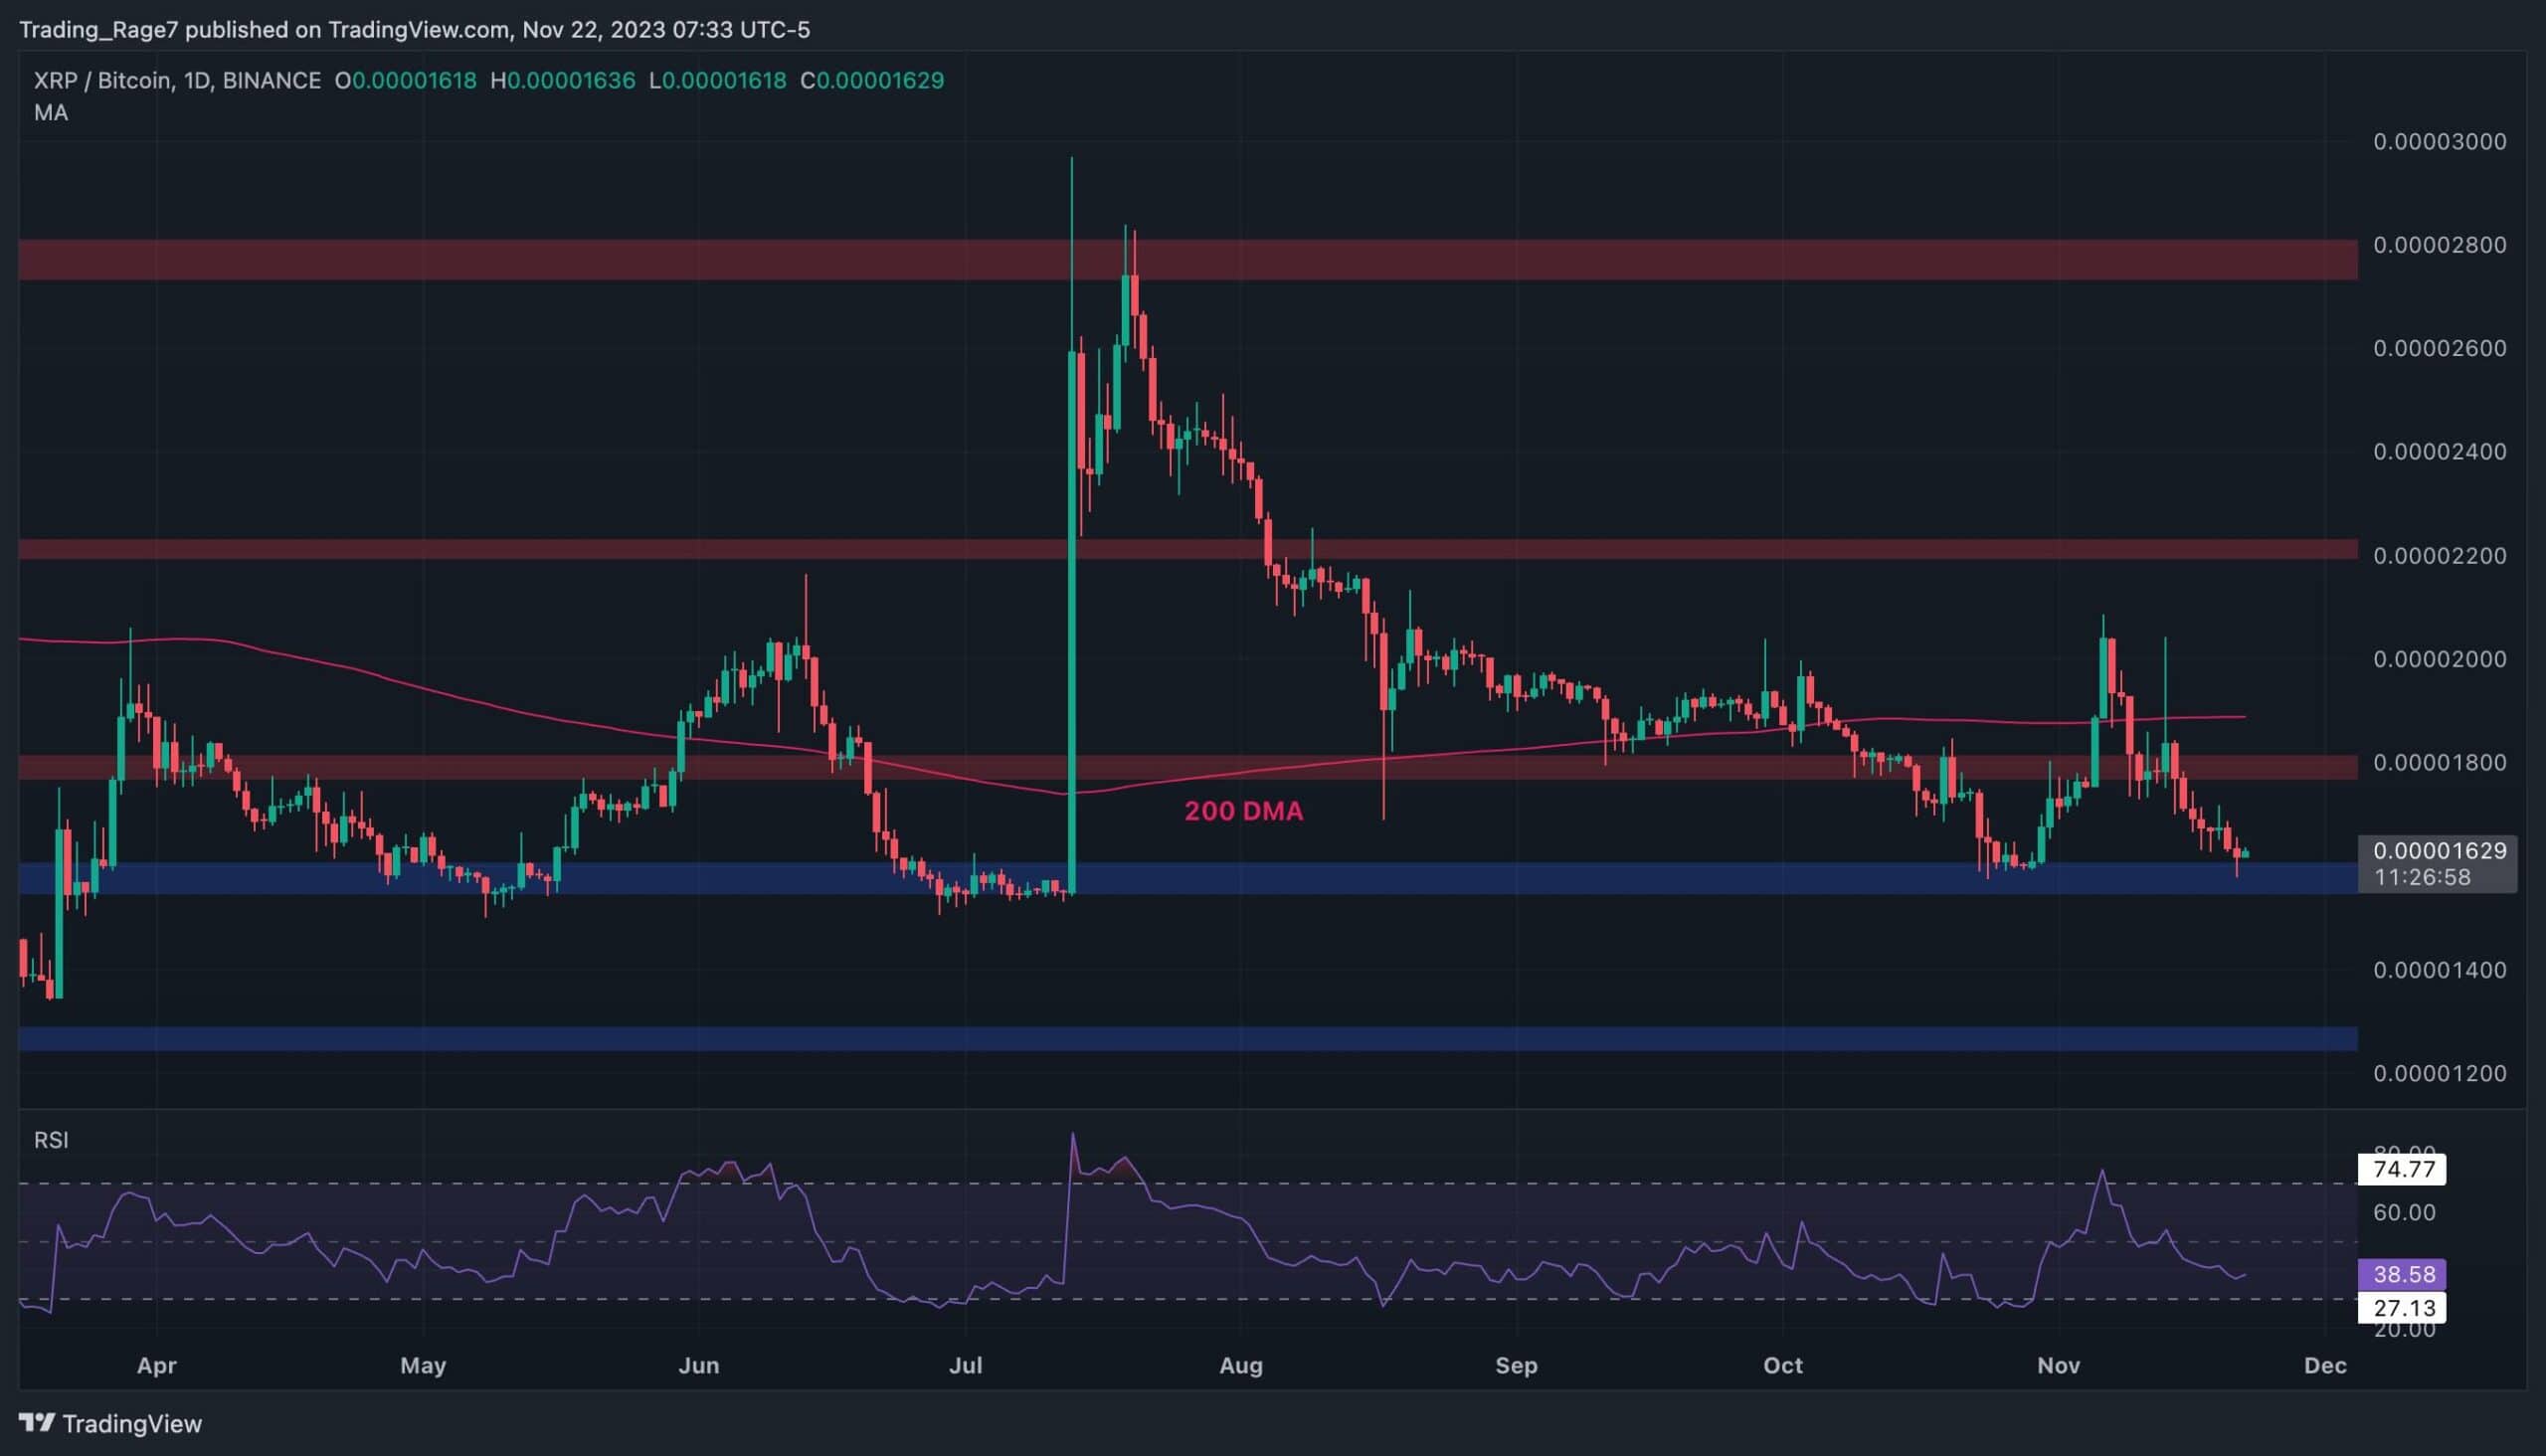
The BTC Paired Chart
Against BTC, things are quite similar. The price has failed to hold above the 200-day moving average, trending near the 1900 SAT mark, and has been plunging since.
However, the 1600 SAT support level is currently holding the price and preventing it from dropping lower toward the 1250 SAT area, which may be considered as the buyers’ last resort.
The Relative Strength Index is also showing values below 50%, which indicates clear bearish momentum. Therefore, a breakdown of the 1600 SAT support zone might be bound to occur soon.