Ripple’s price has been consolidating in a tight range against the USD. However, against BTC, it has yet to manifest a significant move. Technical Analysis By: Edris XRP/USDT Daily Chart The price failed to break above the %excerpt%.43 resistance level and has been trapped in a tight range between the 50-day and 200-day moving average lines, located around the %excerpt%.38 and %excerpt%.4 levels, respectively. A breakout to the upside would likely lead to another test of the %excerpt%.43 level, with the probability for a bullish breakout being seemingly higher this time, as the level should be weakened by so many retests over the last few months. In this case, a rally toward the %excerpt%.6 area would be probable. On the other hand, a breakdown of the 50-day moving average would result in a potential drop
Topics:
CryptoVizArt considers the following as important: Ripple (XRP) Price, XRP Analysis, xrpbtc, xrpusd
This could be interesting, too:
Jordan Lyanchev writes Ripple’s (XRP) Surge to Triggers Over Million in Short Liquidations
Jordan Lyanchev writes Trump Confirms Work on Strategic Crypto Reserve: XRP, ADA, SOL Included
Dimitar Dzhondzhorov writes Is a Major Ripple v. SEC Lawsuit Development Expected This Week? Here’s Why
Mandy Williams writes Ripple Releases Institutional DeFi Roadmap for XRP Ledger in 2025
Ripple’s price has been consolidating in a tight range against the USD. However, against BTC, it has yet to manifest a significant move.
Technical Analysis
By: Edris
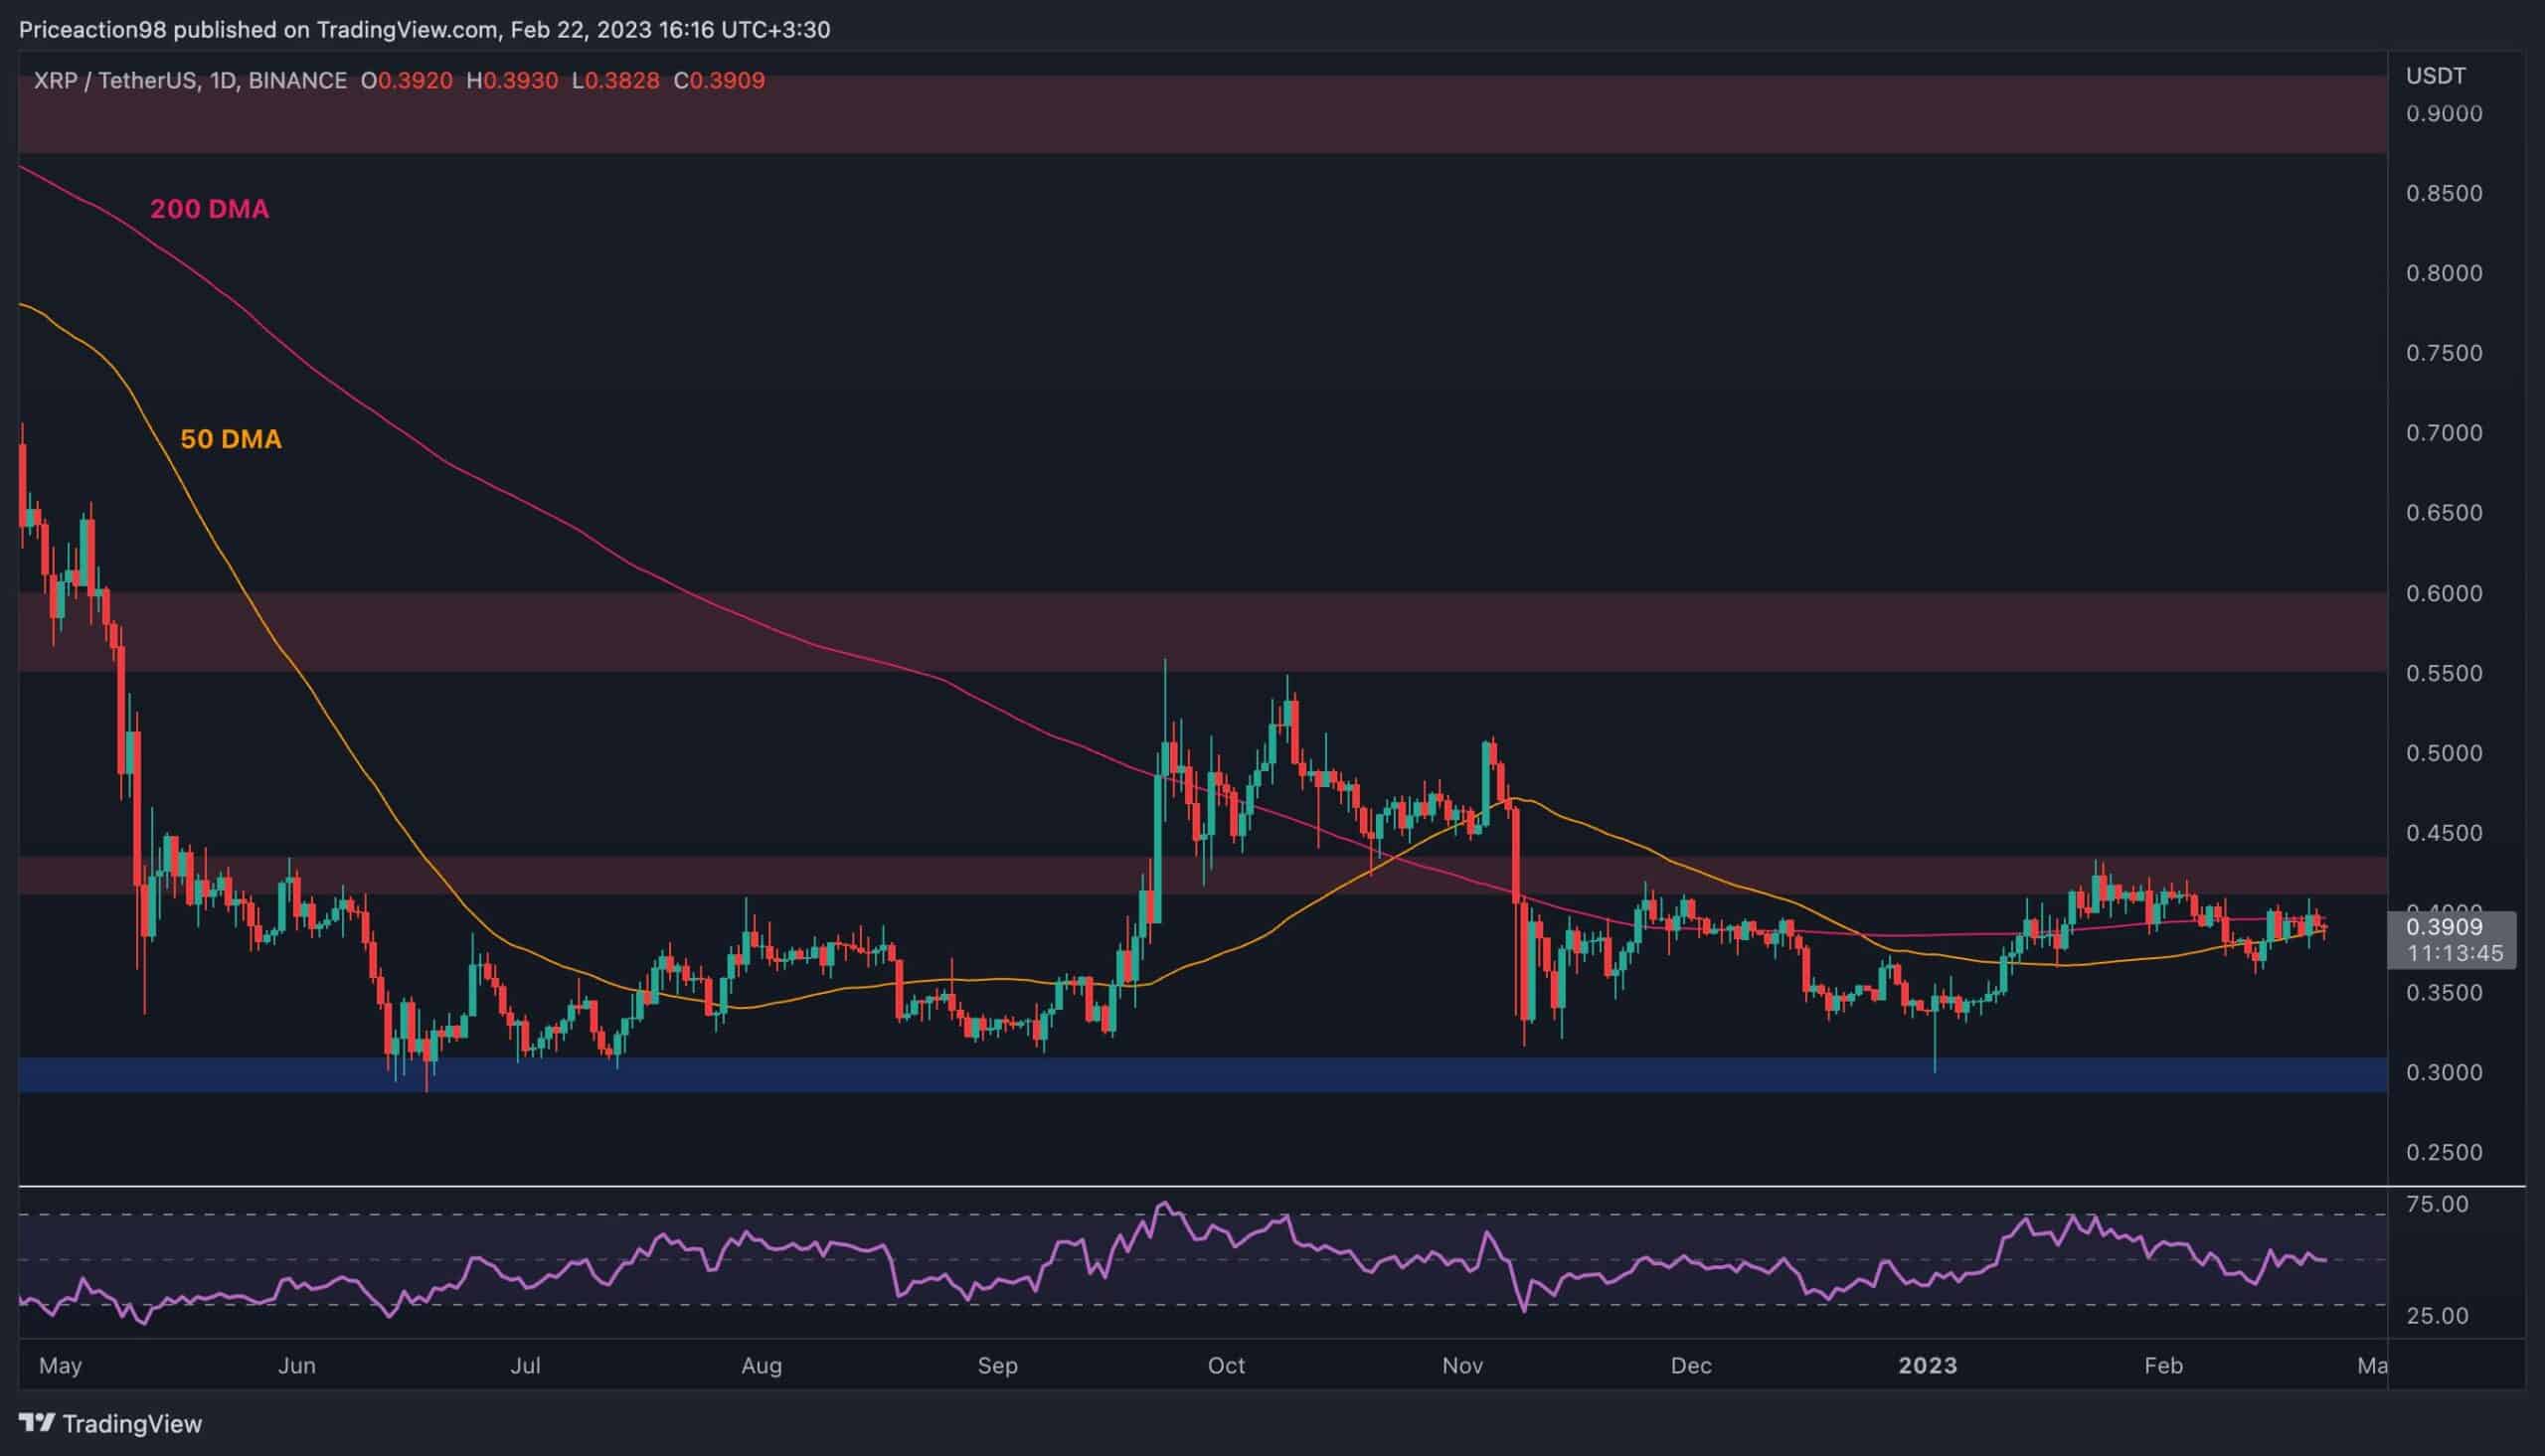
XRP/USDT Daily Chart
The price failed to break above the $0.43 resistance level and has been trapped in a tight range between the 50-day and 200-day moving average lines, located around the $0.38 and $0.4 levels, respectively.
A breakout to the upside would likely lead to another test of the $0.43 level, with the probability for a bullish breakout being seemingly higher this time, as the level should be weakened by so many retests over the last few months.
In this case, a rally toward the $0.6 area would be probable. On the other hand, a breakdown of the 50-day moving average would result in a potential drop toward the key $0.3 support level in the coming weeks.
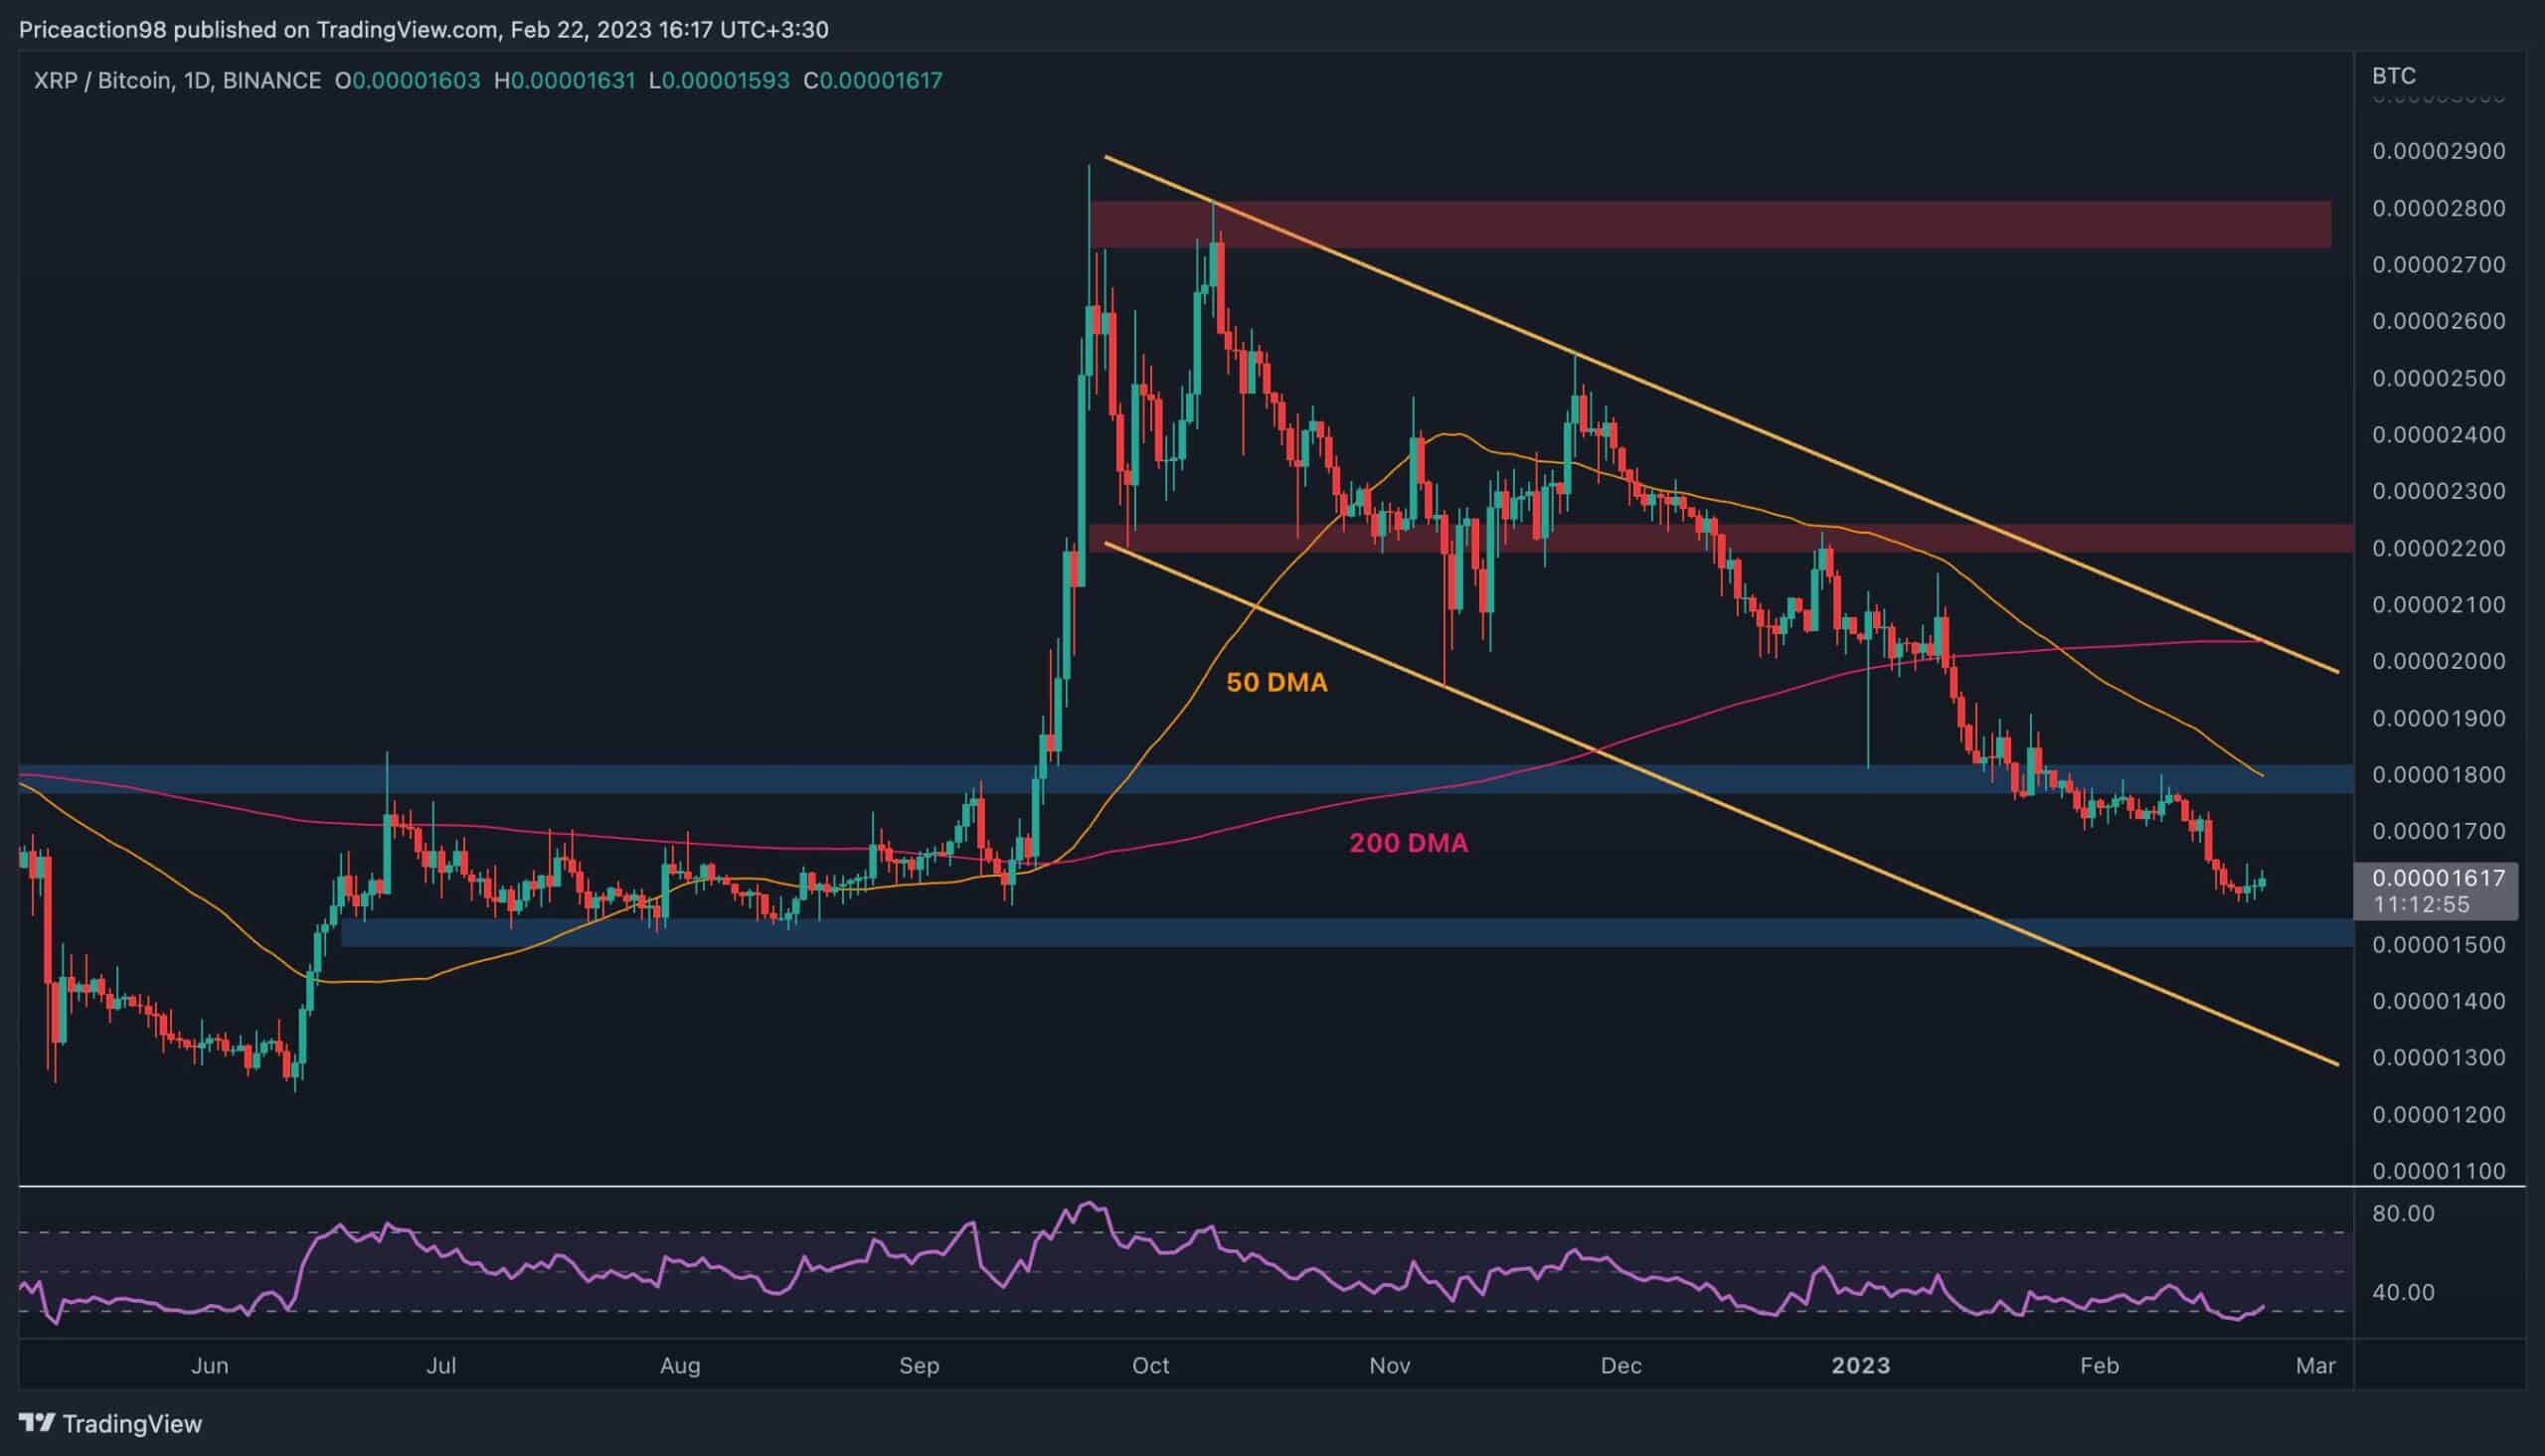
XRP/BTC Daily Chart
Looking at the Bitcoin chart, the market structure is clearly bearish on the daily timeframe, with the significant 0.000018 level getting broken to the downside several weeks ago.
The price has been trending down since then, but the RSI indicator is pointing to a potential bullish pullback in the short term, with the indicator dropping below and recovering above the oversold zone.
In case of a bullish move, the broken 0.000018 level and the 50-day moving average located around the same area would be the likely targets. Yet, the price could still drop deeper and test the key 0.000015 level, which would be the bulls’ last resort to prevent a further crash to the downside.