Ethereum’s price is struggling to break above a key resistance level following a substantial rally over the last couple of months. However, there are multiple support levels that could hold the price in case of a reversal. Technical Analysis By: Edris The Daily Chart On the daily timeframe, the price has failed to break above the 00 level and the higher boundary of the large symmetrical triangle pattern. The cryptocurrency appears to be facing rejection to the downside at the moment, with the 50-day and 200-day moving average lines available as potential support levels around 50 and 00. Furthermore, in case the market pulls back even deeper, the 00 support zone would be a key area to watch. Source: TradingViewThe 4-Hour Chart Looking at the 4-hour chart, recent
Topics:
CryptoVizArt considers the following as important: ETH Analysis, ETHBTC, Ethereum (ETH) Price, ethusd
This could be interesting, too:
Mandy Williams writes Ethereum Derivatives Metrics Signal Modest Downside Tail Risk Ahead: Nansen
Jordan Lyanchev writes Weekly Bitcoin, Ethereum ETF Recap: Light at the End of the Tunnel for BTC
CryptoVizArt writes Will Weak Momentum Drive ETH to .5K? (Ethereum Price Analysis)
Jordan Lyanchev writes Bybit Hack Fallout: Arthur Hayes, Samson Mow Push for Ethereum Rollback
Ethereum’s price is struggling to break above a key resistance level following a substantial rally over the last couple of months. However, there are multiple support levels that could hold the price in case of a reversal.
Technical Analysis
By: Edris
The Daily Chart
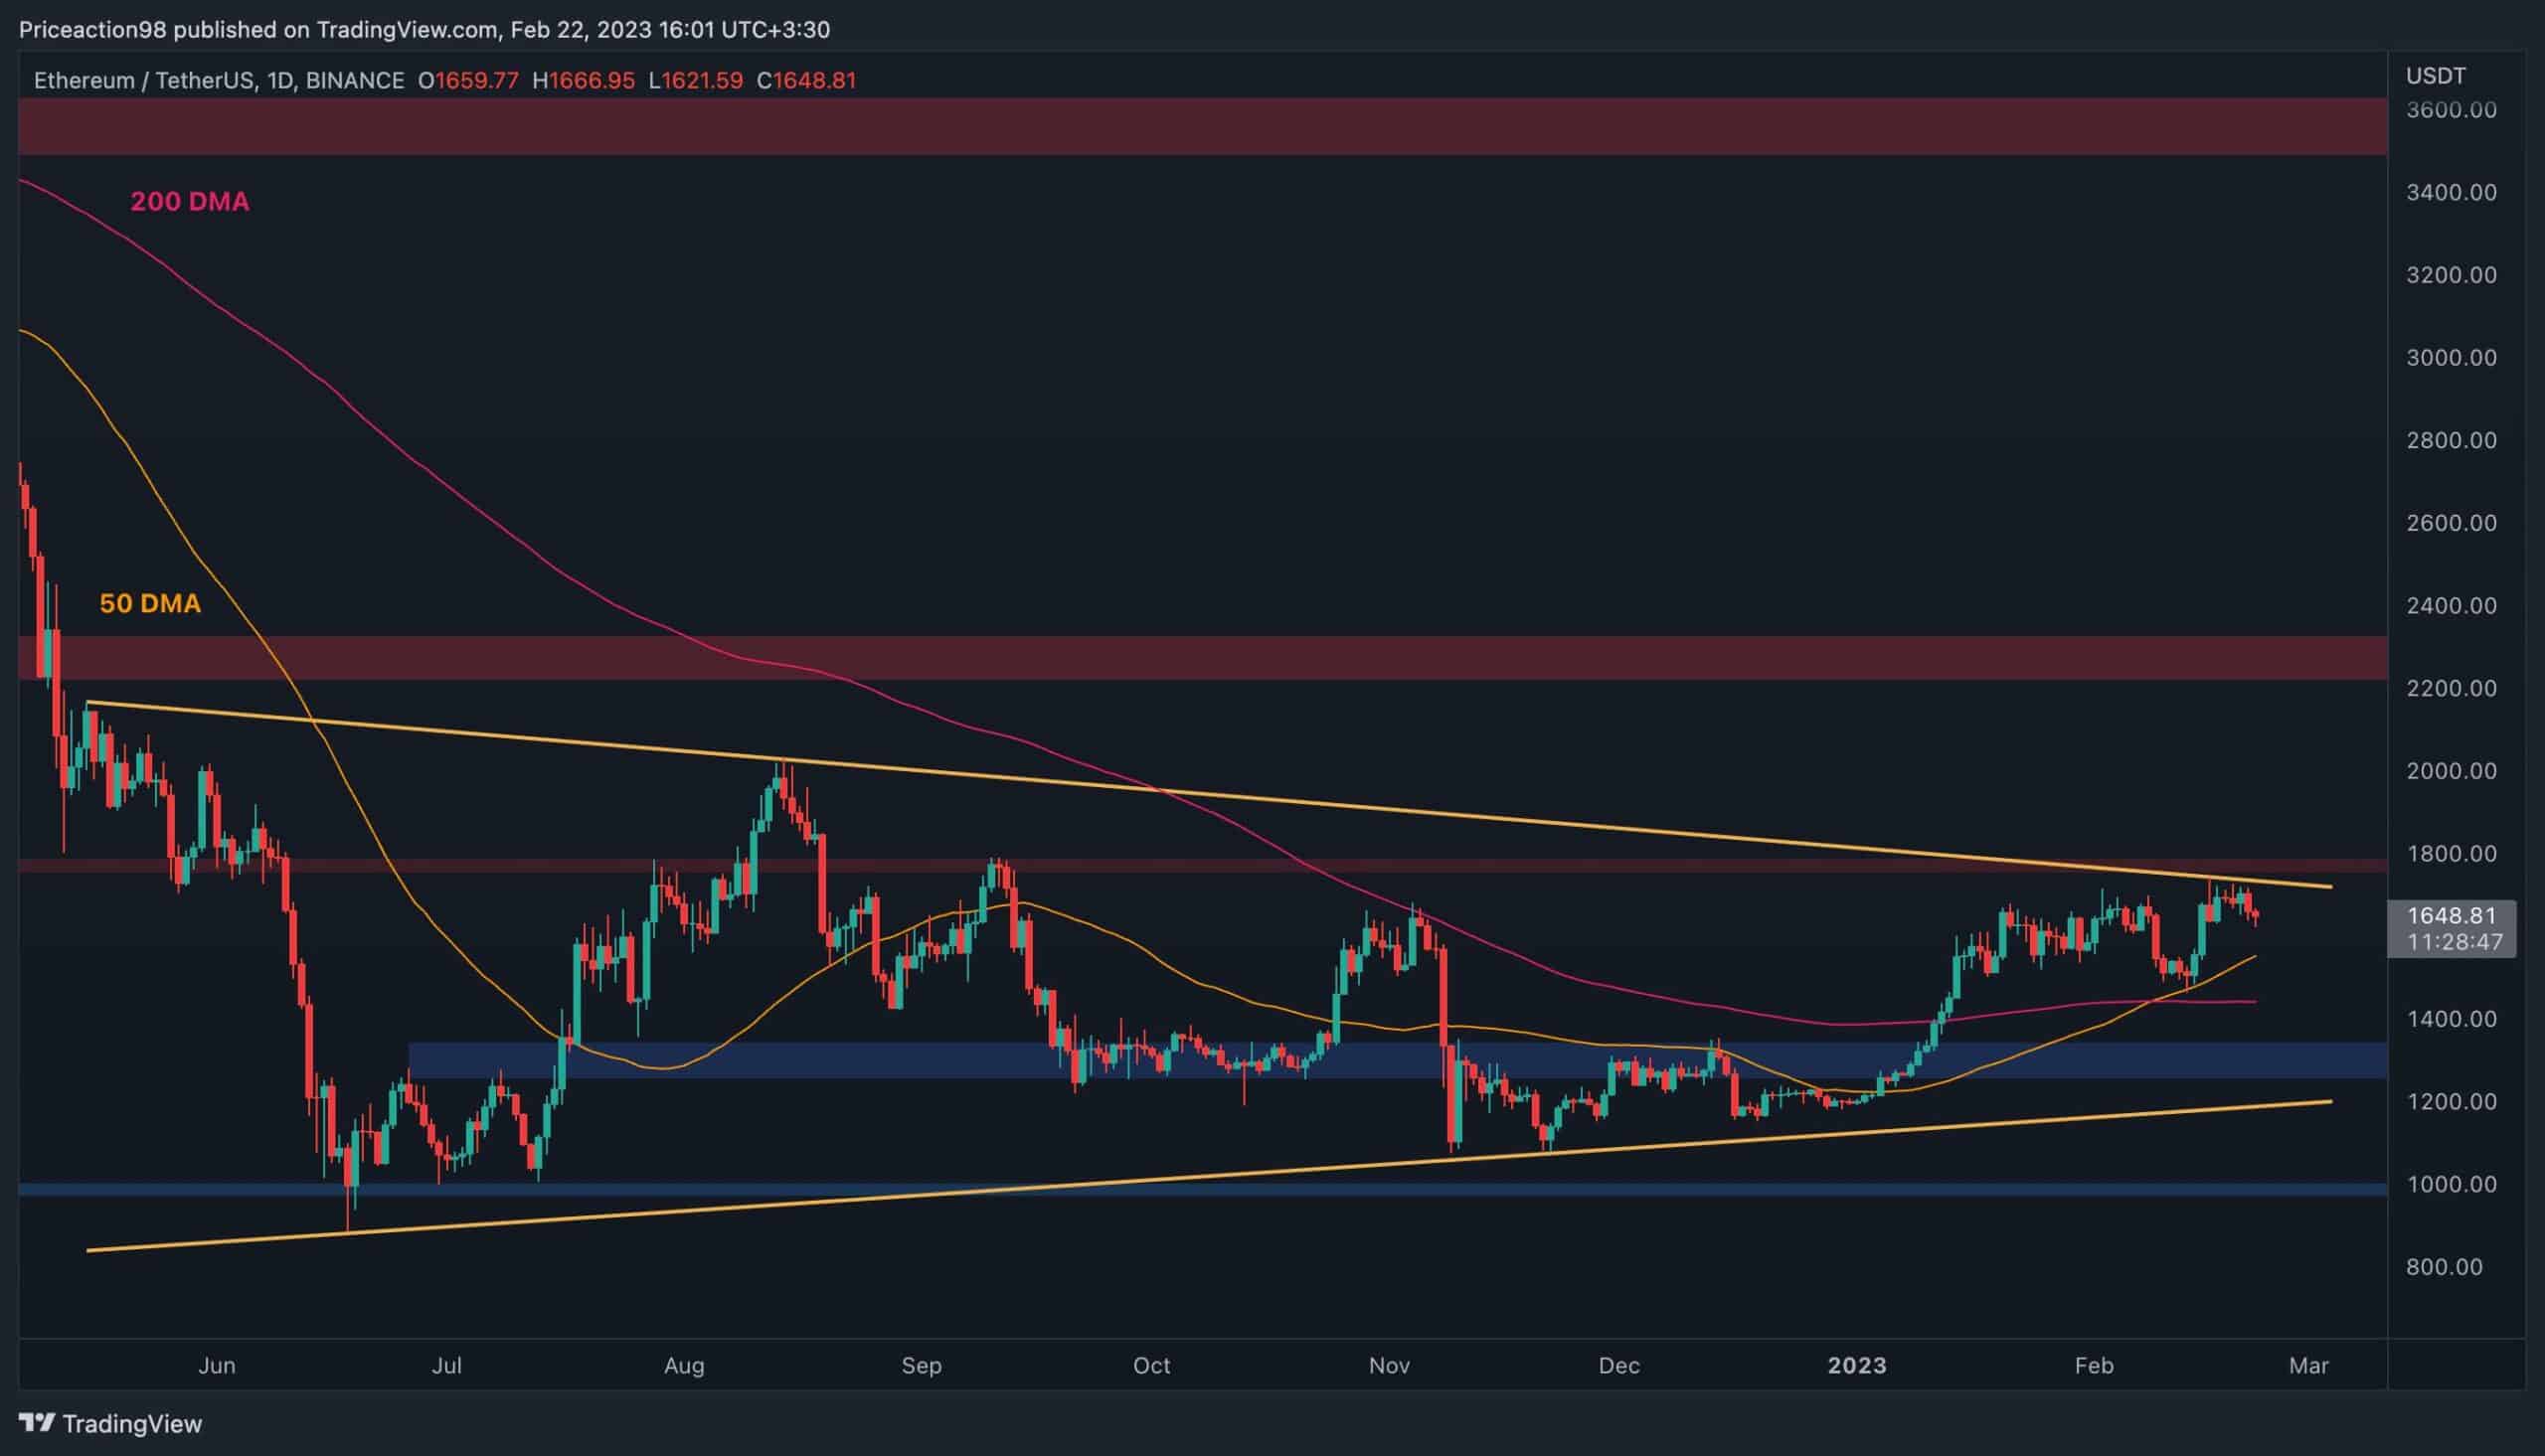
On the daily timeframe, the price has failed to break above the $1800 level and the higher boundary of the large symmetrical triangle pattern.
The cryptocurrency appears to be facing rejection to the downside at the moment, with the 50-day and 200-day moving average lines available as potential support levels around $1550 and $1400. Furthermore, in case the market pulls back even deeper, the $1300 support zone would be a key area to watch.
The 4-Hour Chart
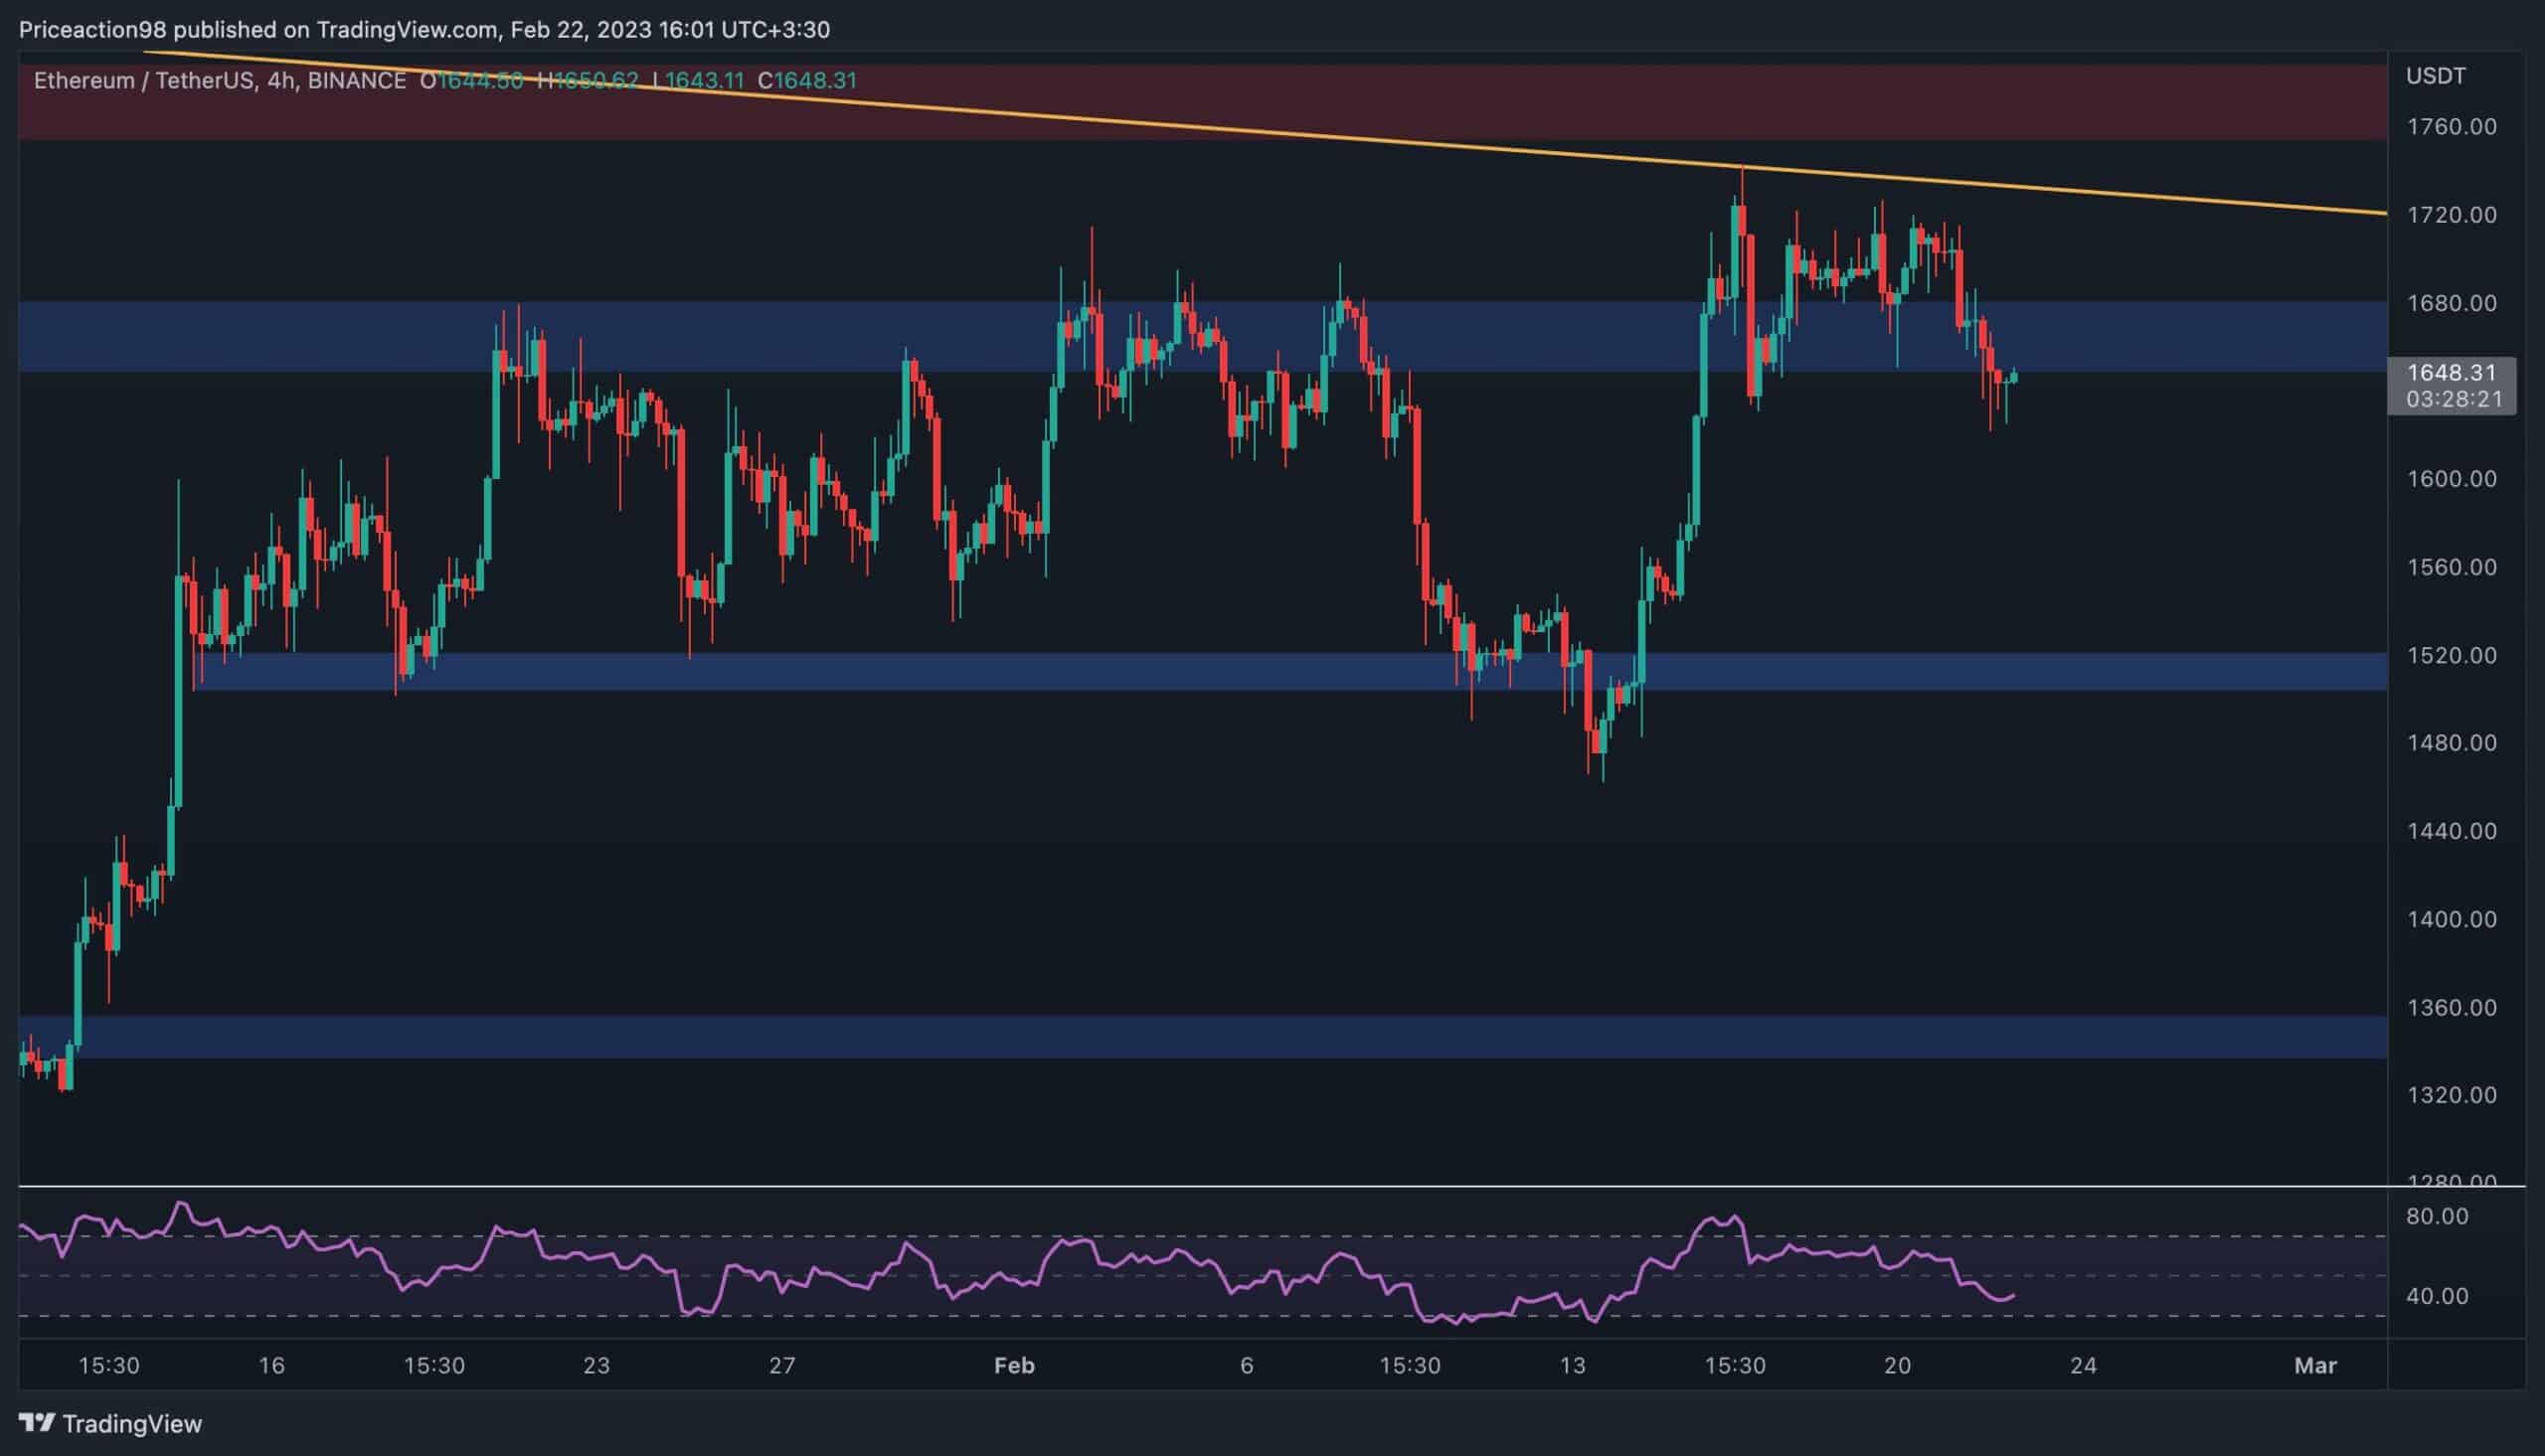
Looking at the 4-hour chart, recent price action becomes more clear. ETH is currently breaking below the $1650 support area, which could lead to a deeper decline toward the $1500 level in the short term if a valid breakout occurs.
The RSI indicator has also dropped below the 50% threshold, which points to the current seller’s domination and bearish momentum. Yet, the price could still move higher if the $1650 level holds. This could potentially lead to a break above the higher boundary of the triangle and a retest of the $1800 resistance area in the coming days.
Sentiment Analysis
By Shayan
Since 2018, the futures market has been essential in affecting Ethereum’s price. Therefore, examining its sentiment would be helpful in gaining insight into short-term price movements.
The Taker Buy Sell Ratio metric(with a 30-day SMA added) can be used to define the market’s perspective. Utilizing this feature, we can identify whether buying or selling pressure is significant, with values above one indicating bullish and below 1 showing bearish sentiment.
Simultaneously with the recent bullish trend of Ethereum, the metric was spiking, indicating a bullish sentiment in the market. However, the price entered a consolidation stage, causing a significant decline in the metric below one. As a result, it dropped to a new multi-month low, implying a dominant bearish sentiment.
The recent rally should be closely monitored in the weeks ahead to determine whether this was just another bull trap or a beginning of a new bull market, as sellers might dominate again.
