Ripple’s price has been on the rise over the last couple of weeks following Bitcoin’s rally. However, there are still significant resistance levels that should be claimed before a bullish shift in the market structure takes shape. Technical Analysis By: Edris XRP/USDT Daily Chart: On the daily USDT chart, the price has been rallying following a rebound from the critical %excerpt%.3 level earlier in the month. Ripple is currently trapped between the 50-day and 100-day moving averages, located around %excerpt%.37 and %excerpt%.39, respectively. In case the 200-day moving average gets broken to the upside, the significant %excerpt%.43 level would be the next obstacle that should be taken out before the market structure could be considered bullish in the short term. The RSI indicator should also be
Topics:
CryptoVizArt considers the following as important: Ripple (XRP) Price, XRP Analysis, xrpbtc, xrpusd
This could be interesting, too:
Jordan Lyanchev writes Ripple’s (XRP) Surge to Triggers Over Million in Short Liquidations
Jordan Lyanchev writes Trump Confirms Work on Strategic Crypto Reserve: XRP, ADA, SOL Included
Dimitar Dzhondzhorov writes Is a Major Ripple v. SEC Lawsuit Development Expected This Week? Here’s Why
Mandy Williams writes Ripple Releases Institutional DeFi Roadmap for XRP Ledger in 2025
Ripple’s price has been on the rise over the last couple of weeks following Bitcoin’s rally. However, there are still significant resistance levels that should be claimed before a bullish shift in the market structure takes shape.
Technical Analysis
By: Edris
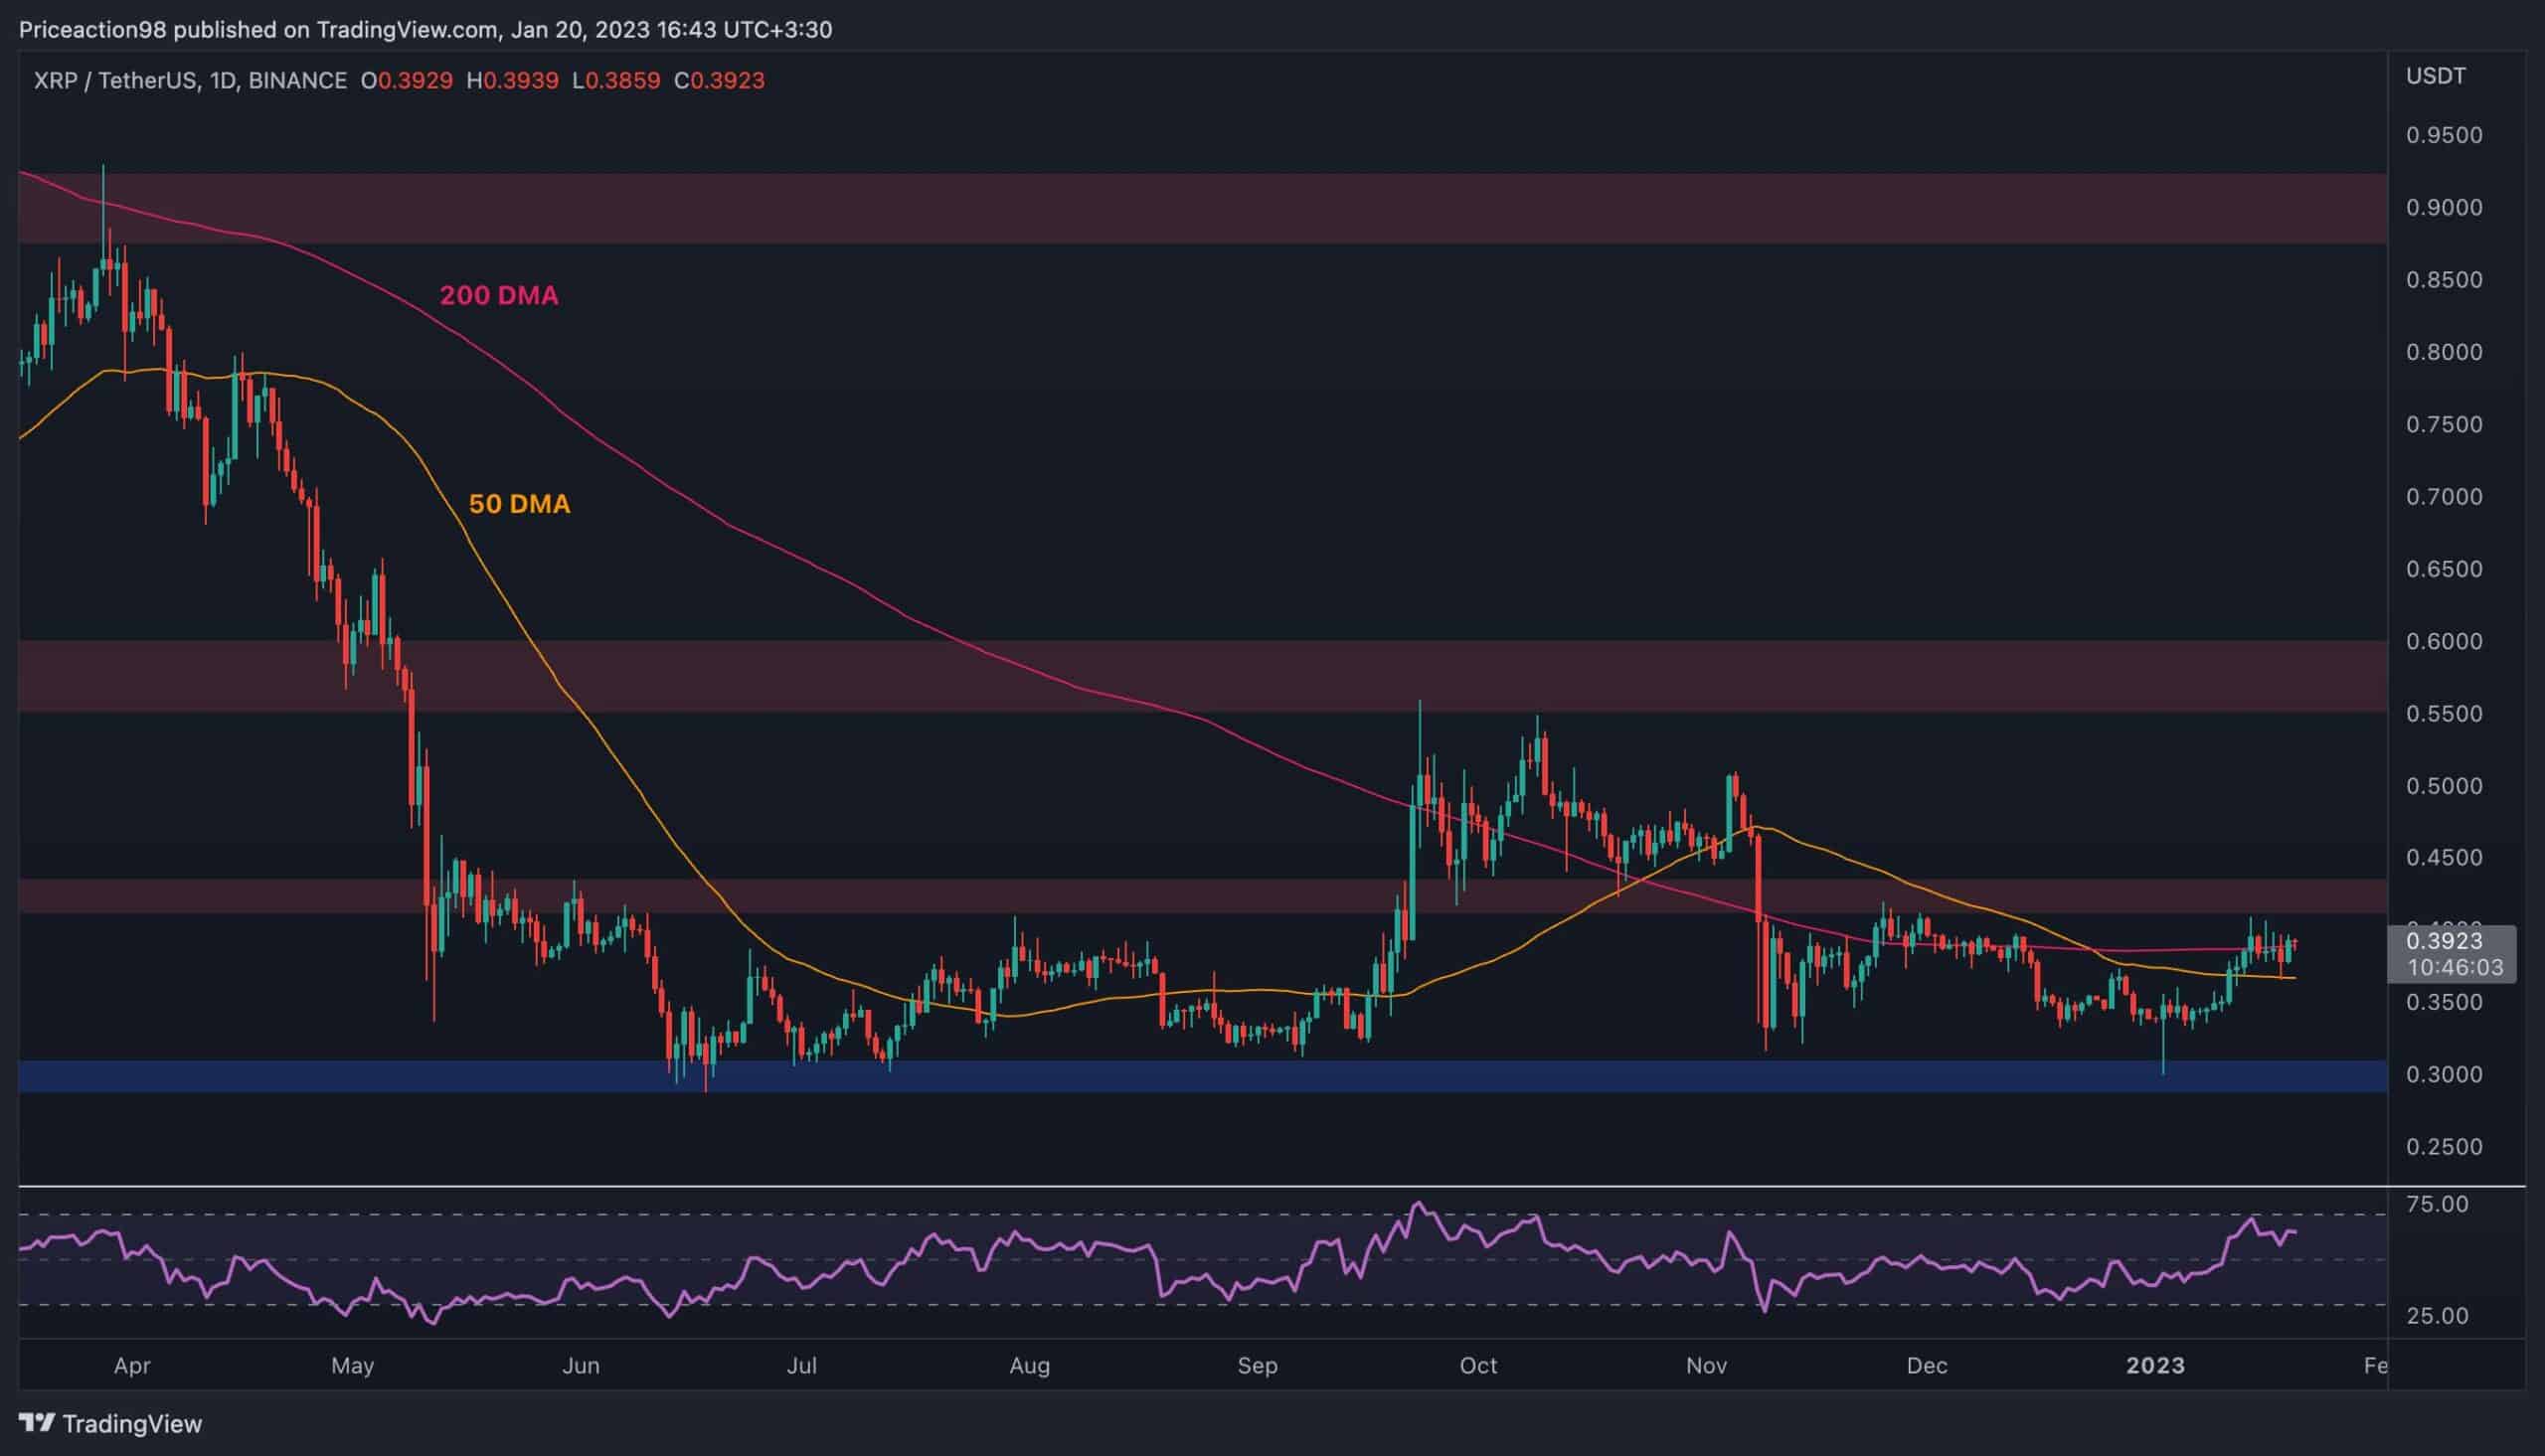
XRP/USDT Daily Chart:
On the daily USDT chart, the price has been rallying following a rebound from the critical $0.3 level earlier in the month. Ripple is currently trapped between the 50-day and 100-day moving averages, located around $0.37 and $0.39, respectively.
In case the 200-day moving average gets broken to the upside, the significant $0.43 level would be the next obstacle that should be taken out before the market structure could be considered bullish in the short term.
The RSI indicator should also be monitored closely as it is reaching the overbought zone and could form a potential bearish divergence signal in the coming days.
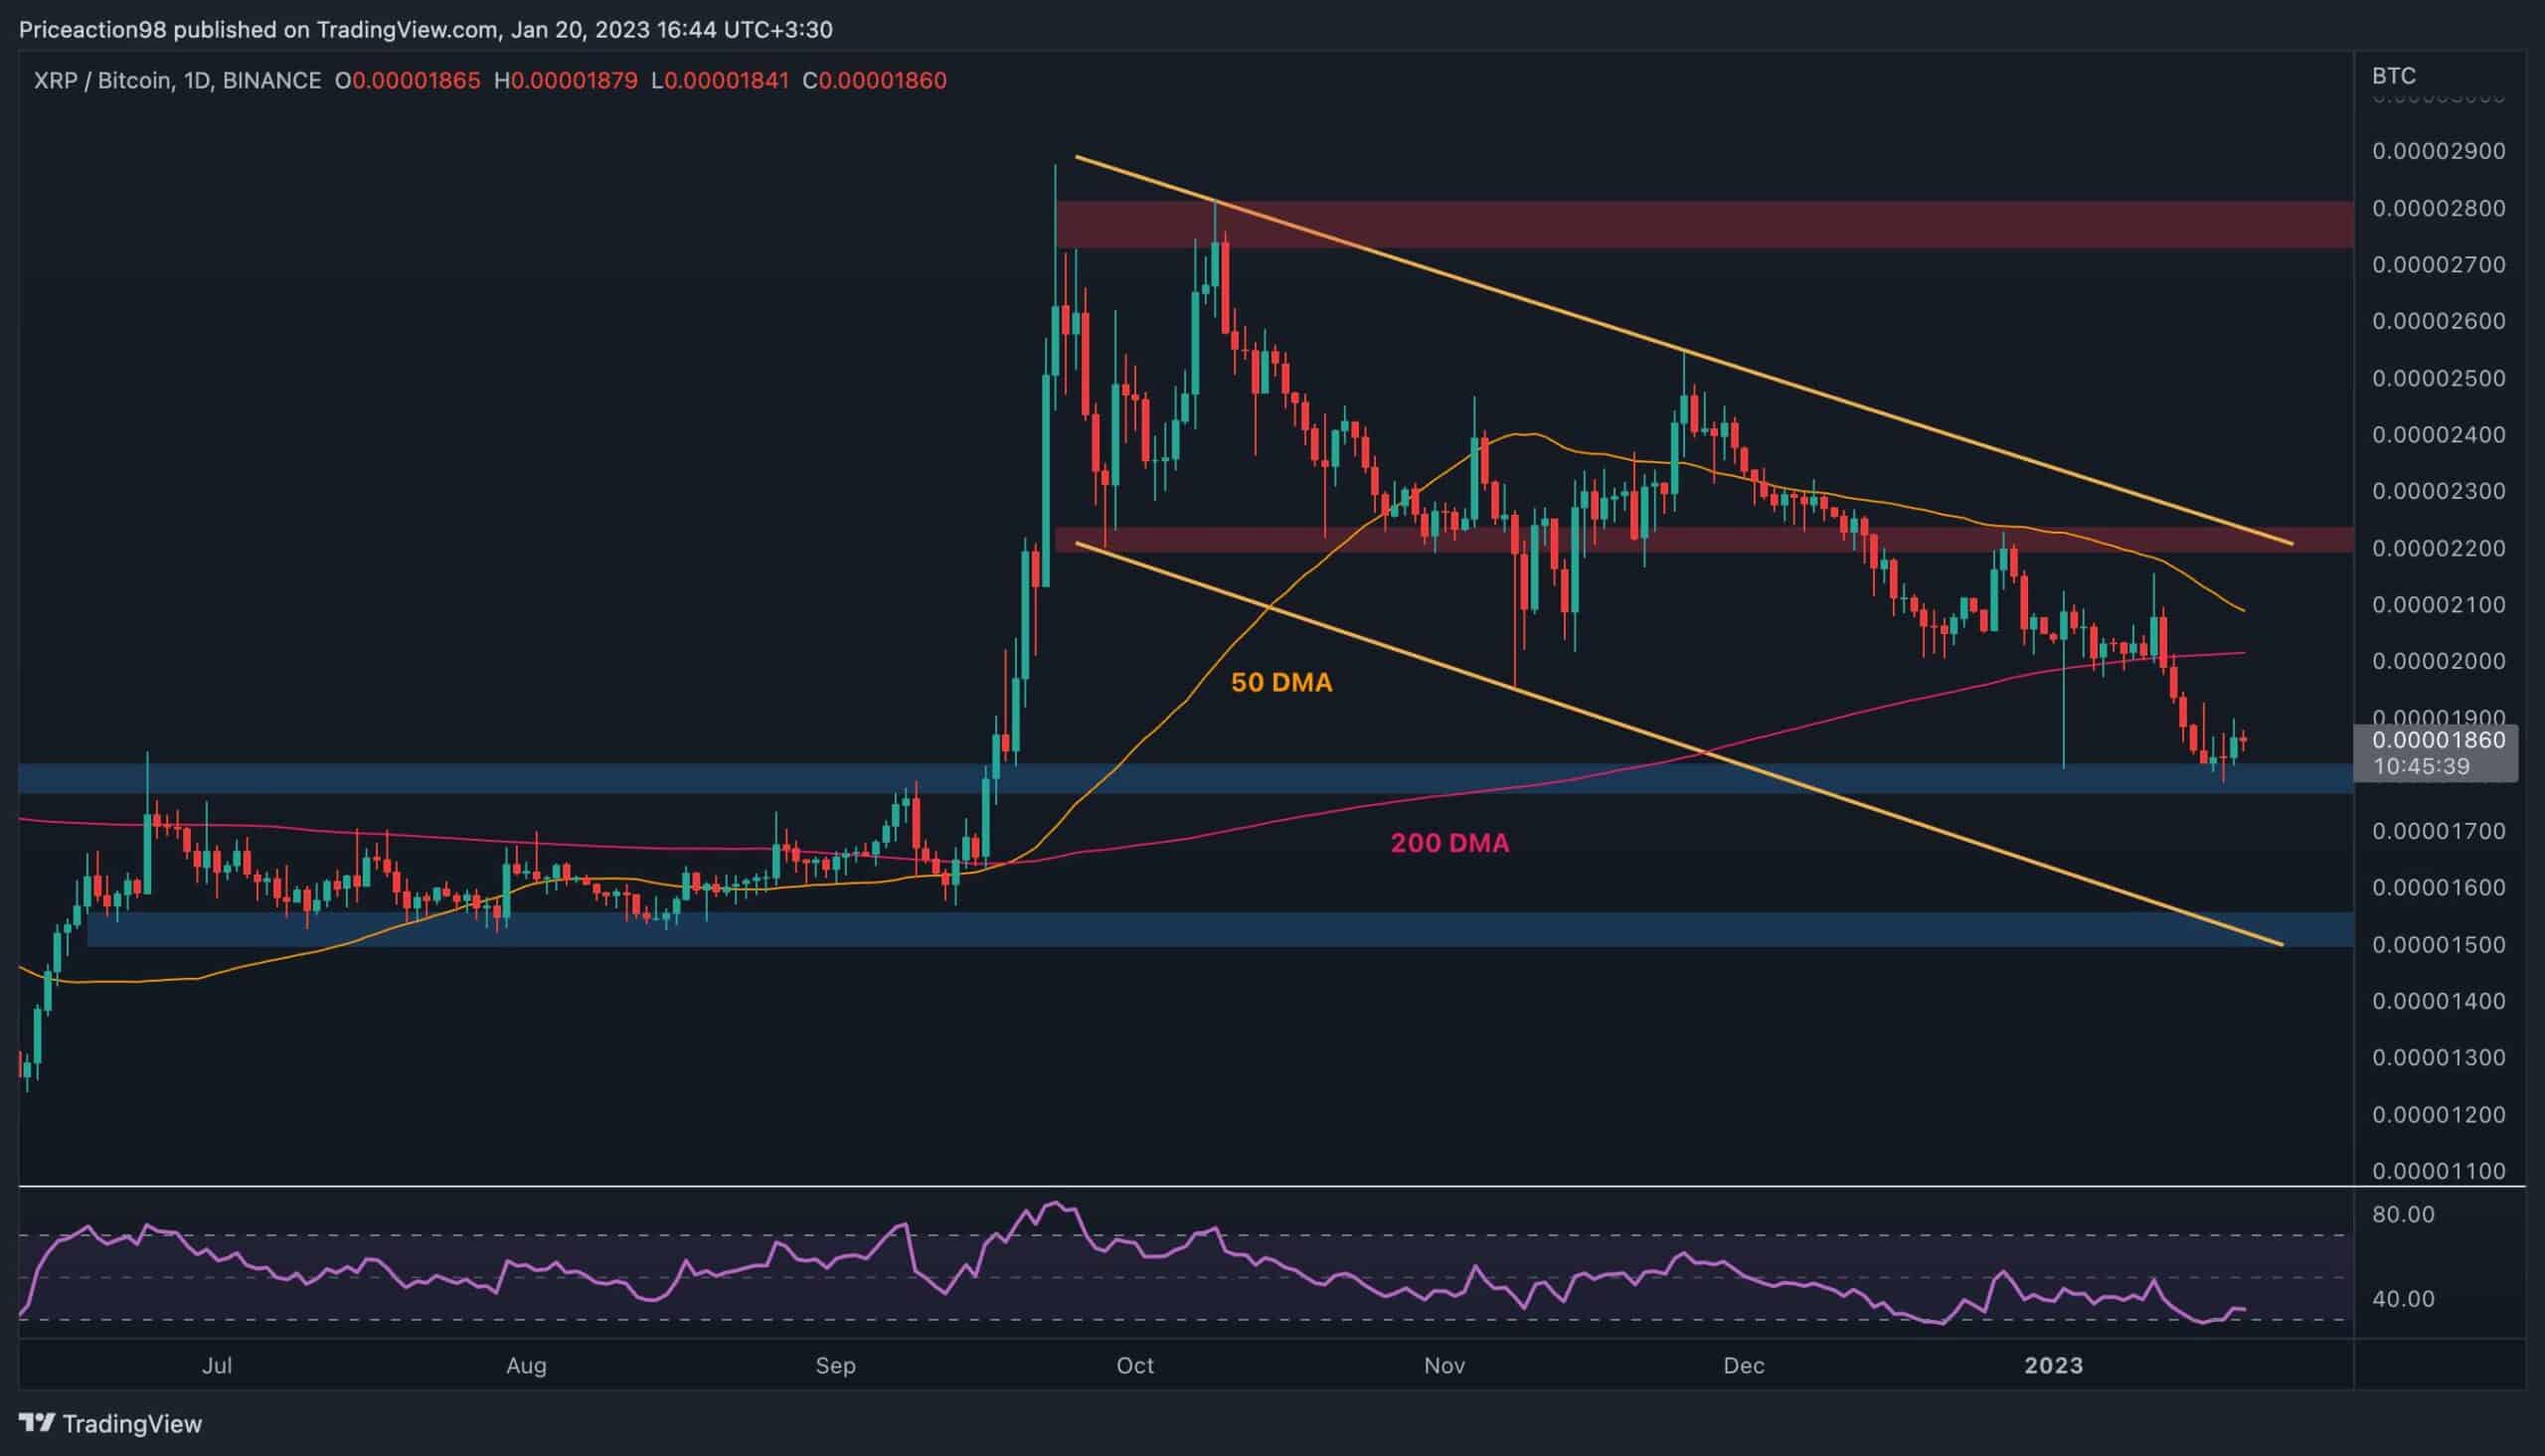
XRP/BTC Daily Chart:
The market structure seems almost utterly opposite on the BTC paired chart, as the price has been falling rapidly lately, with Bitcoin outperforming XRP.
However, the decline has seemingly halted, as the 0.000018 SAT support level holds the price. Yet, considering the potential bearish crossover between the 50-day and 100-day moving averages, with the former trending lower around the 0.000021 SAT level, the 0.000018 SAT support may be broken to the downside. This structure could drive Ripple’s price towards the lower boundary of the large bearish flag, and the critical 0.000015 SAT support zone.