Ethereum’s price surge has seemingly halted after rallying over the past couple of weeks. With multiple key resistance levels broken, the market seems likely to enter a bullish phase. However, some warning signals are emerging. Technical Analysis By: Edris The Daily Chart: On the daily timeframe, the price has broken past the 00 resistance level, and the 200-day moving average is around the 00 mark. Yet, bullish momentum has been fading recently, making a bearish pullback probable. The RSI indicator, which has been showing an overbought signal for a while, is now decreasing. This decline indicates a potential pullback or even a reversal. In this case, the 200-day moving average and the 00 level should be considered support levels. On the other hand, the 00
Topics:
CryptoVizArt considers the following as important: ETH Analysis, ETHBTC, Ethereum (ETH) Price, ethusd
This could be interesting, too:
Mandy Williams writes Ethereum Derivatives Metrics Signal Modest Downside Tail Risk Ahead: Nansen
Jordan Lyanchev writes Weekly Bitcoin, Ethereum ETF Recap: Light at the End of the Tunnel for BTC
CryptoVizArt writes Will Weak Momentum Drive ETH to .5K? (Ethereum Price Analysis)
Jordan Lyanchev writes Bybit Hack Fallout: Arthur Hayes, Samson Mow Push for Ethereum Rollback
Ethereum’s price surge has seemingly halted after rallying over the past couple of weeks. With multiple key resistance levels broken, the market seems likely to enter a bullish phase. However, some warning signals are emerging.
Technical Analysis
By: Edris
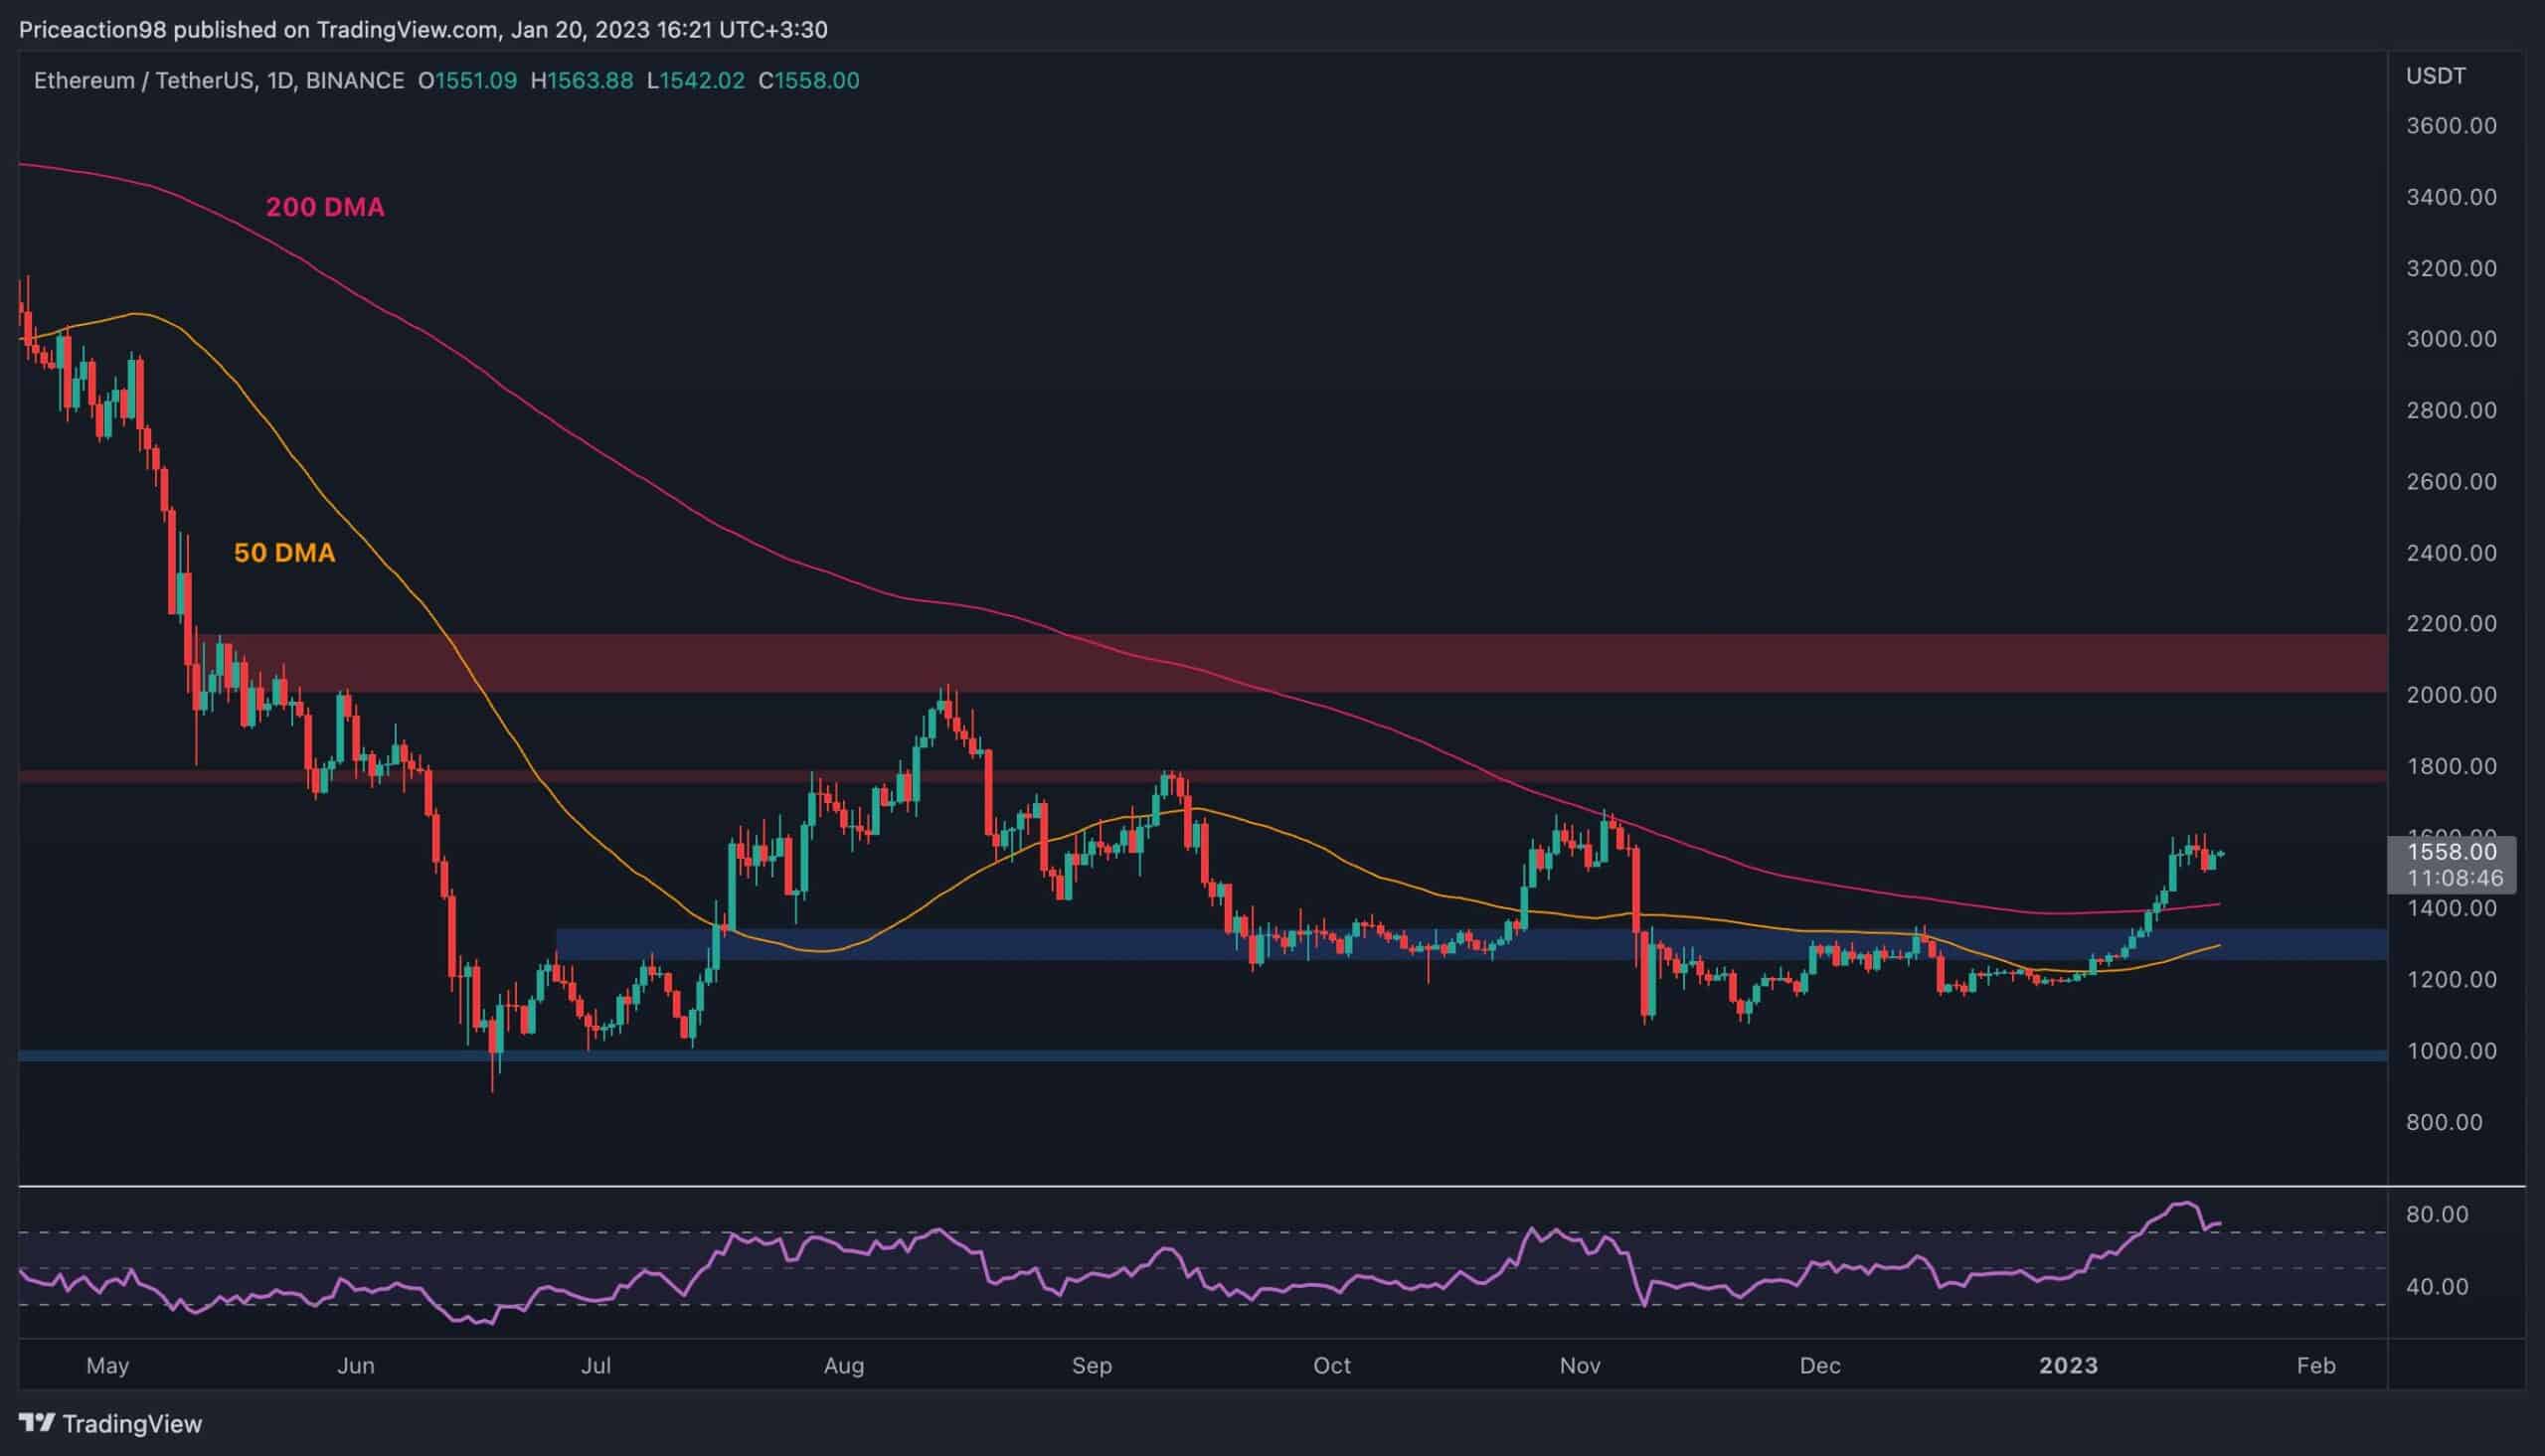
The Daily Chart:
On the daily timeframe, the price has broken past the $1300 resistance level, and the 200-day moving average is around the $1400 mark. Yet, bullish momentum has been fading recently, making a bearish pullback probable.
The RSI indicator, which has been showing an overbought signal for a while, is now decreasing. This decline indicates a potential pullback or even a reversal. In this case, the 200-day moving average and the $1300 level should be considered support levels.
On the other hand, the $1800 level is the next significant resistance zone and target for a further rally in the daily timeframe.
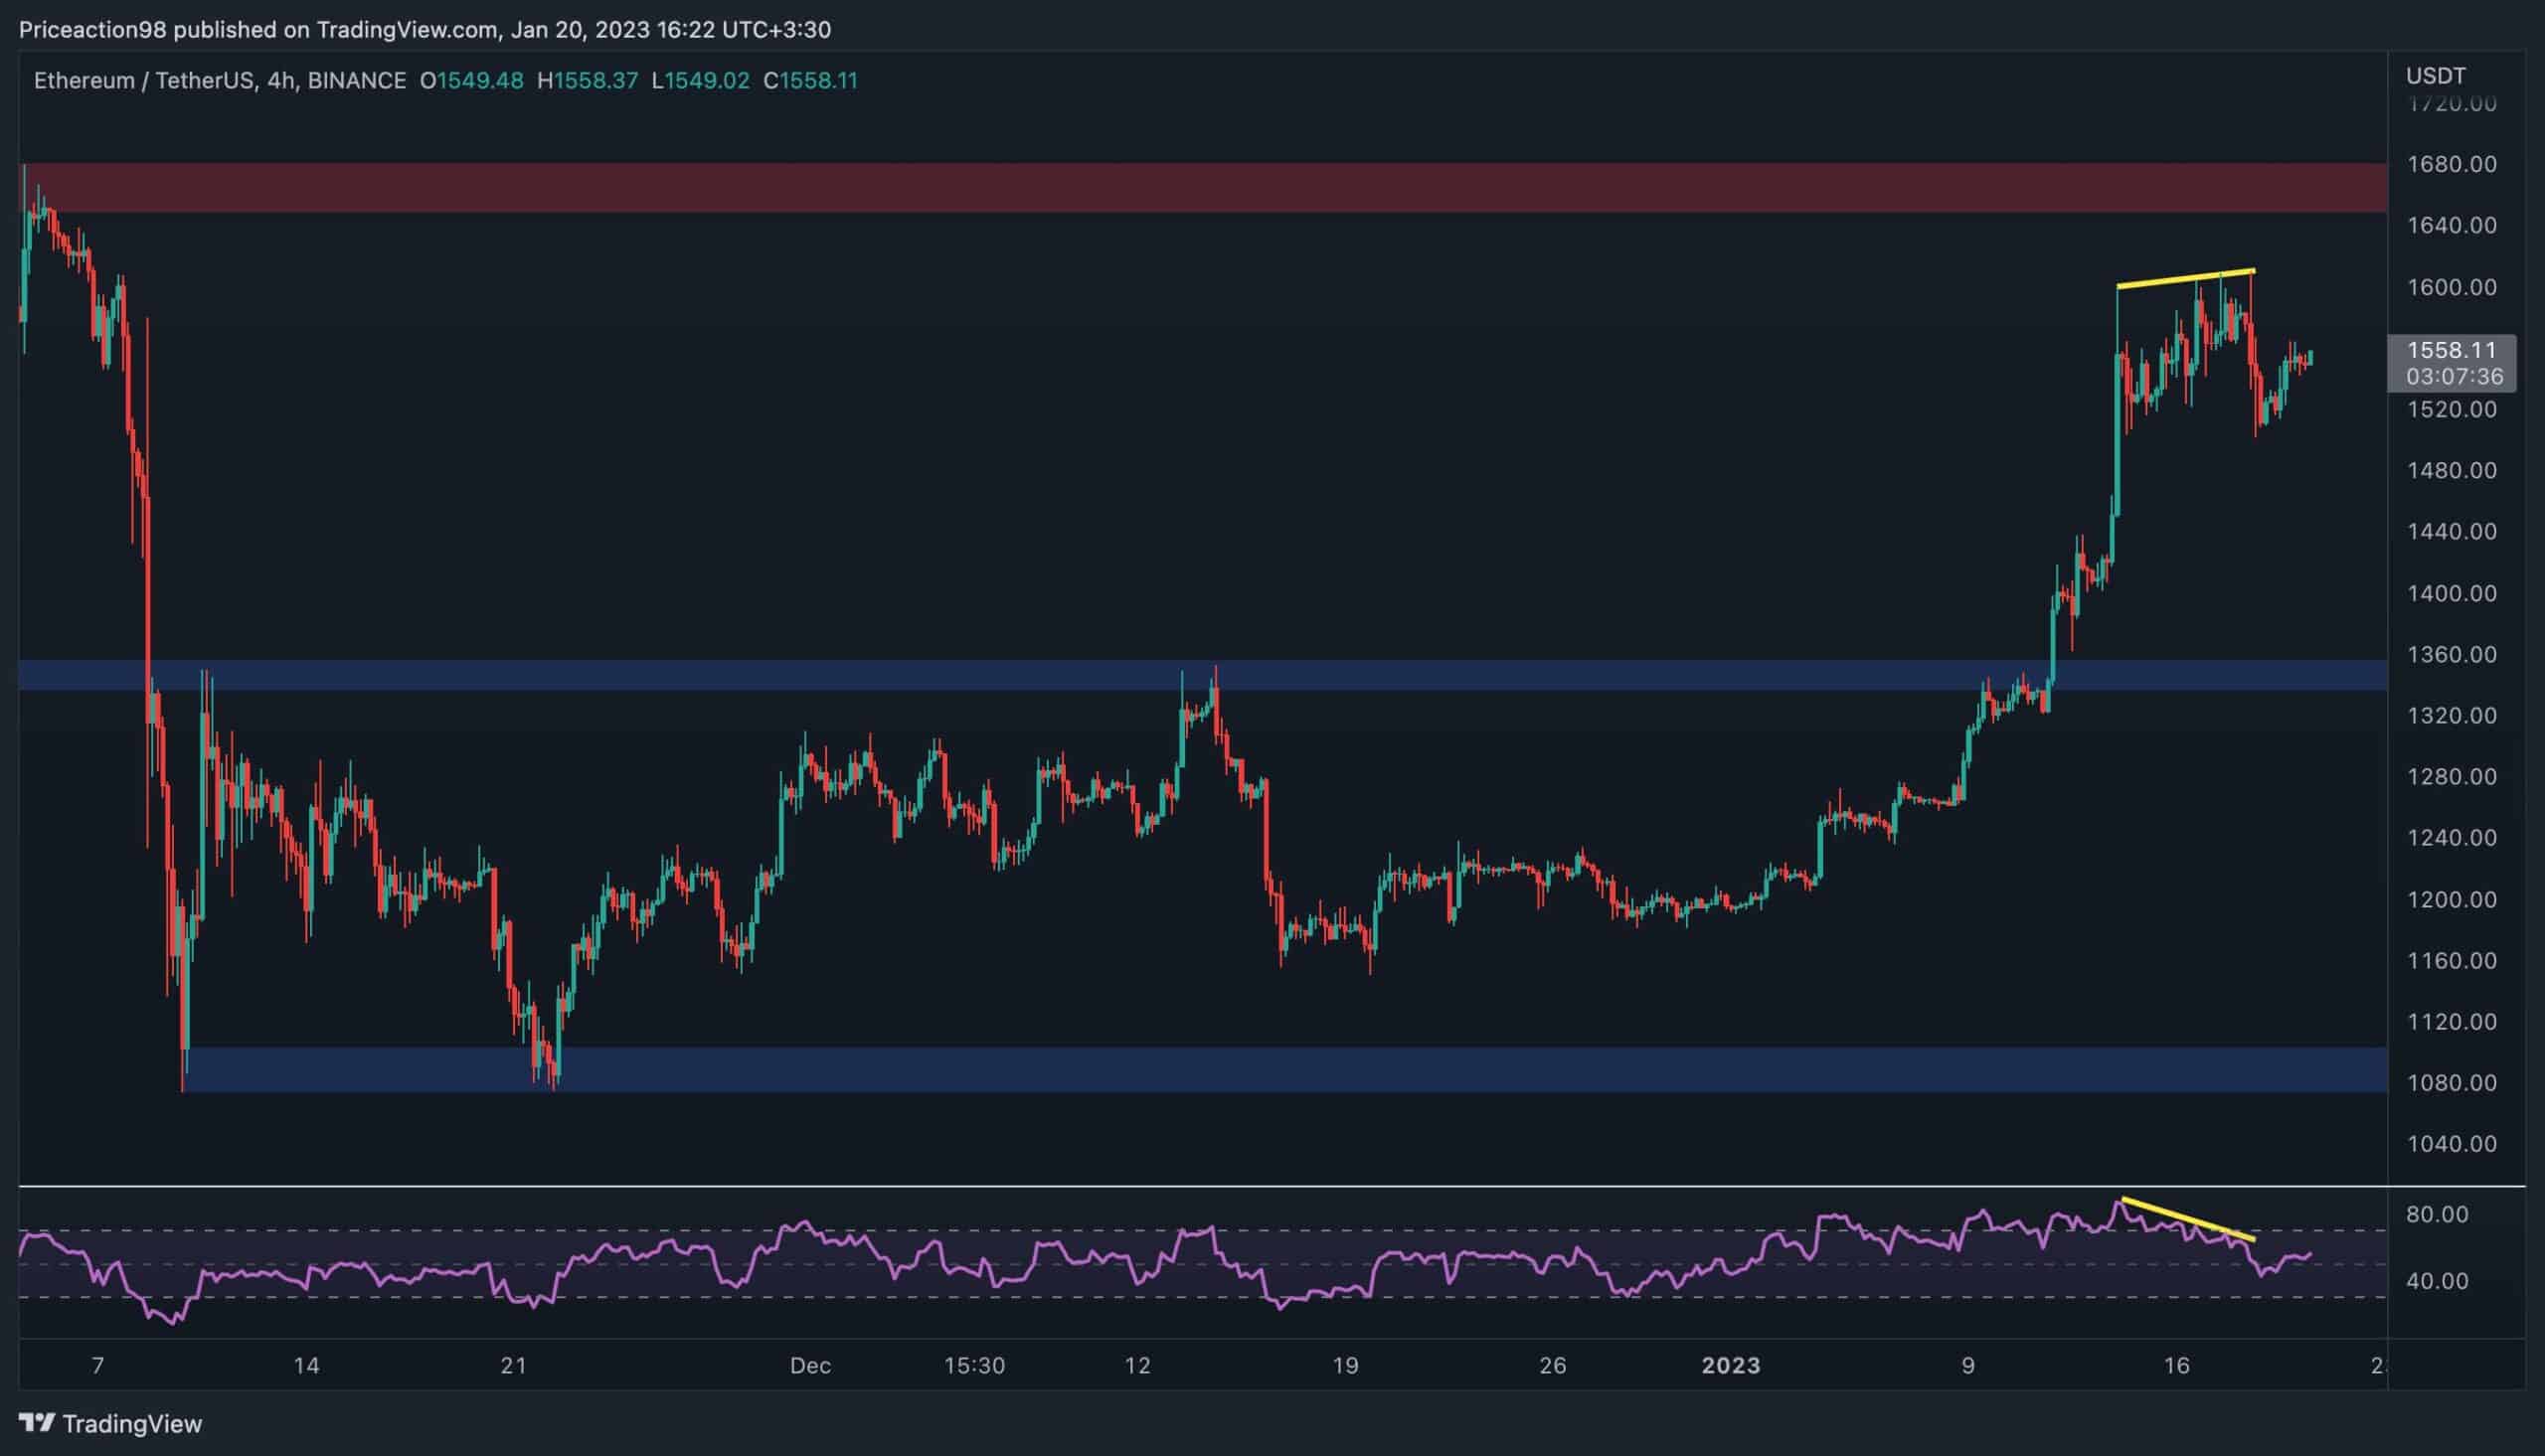
The 4-Hour Chart:
Looking at the 4-hour chart, the lack of bullish momentum can be seen more clearly. The price’s microstructure has seemingly turned bearish, but the $1650 resistance area has not been reached yet, and the cryptocurrency could still climb higher to test it.
The RSI indicator also flashes a significant warning signal, with a visible bearish divergence forming between the last few highs. While a bullish continuation toward the $1650 level still seems likely, a bearish pullback could be expected in the short term, either before testing the $1650 level or after.
Onchain Analysis
By Shayan
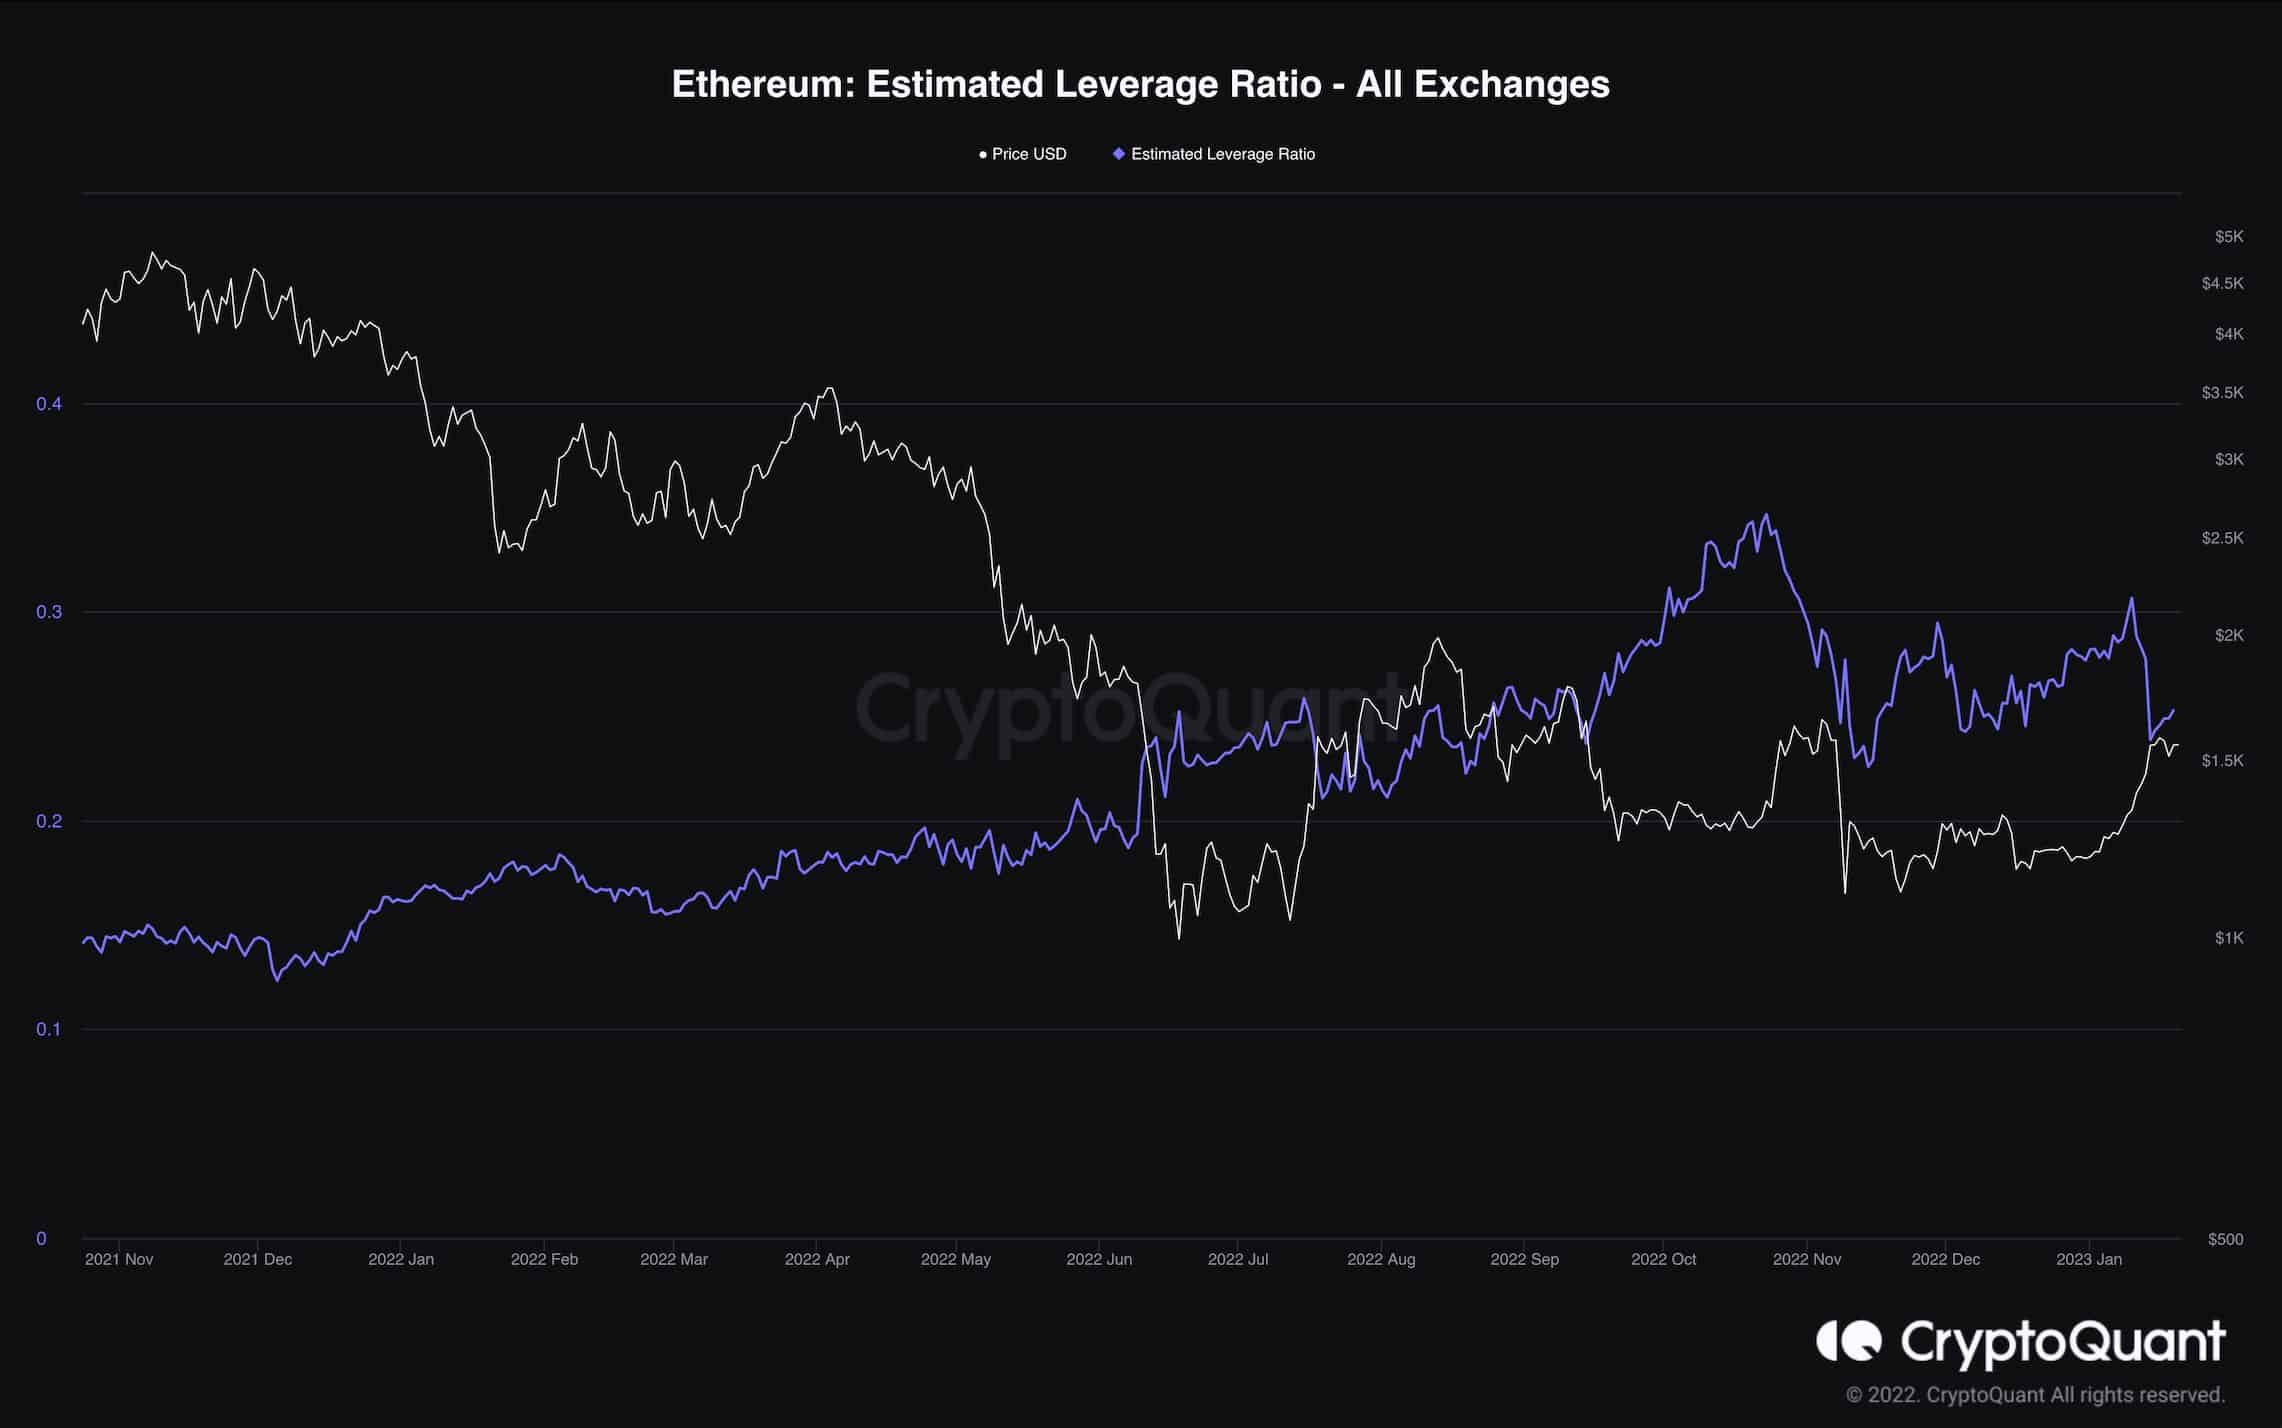
The following chart demonstrates the Estimated Leverage Ratio metric alongside Ethereum’s price. The metric measures the exchange’s open interest divided by their coins reserve, indicating how much leverage participants use on average.
Higher values indicate more investors are taking high leverage risk in the derivatives market. Due to the recent significant uptrend in Ethereum’s price, the metric experienced a sudden drop indicating a considerable amount of short positions were liquidated.
This provides an excellent chance for the bulls to bring back the demand to the futures market by taking long positions and initiating a rally toward higher price levels.