Ripple’s price has been moving sideways against USDT while plunging against BTC. Things are looking interesting on both charts at the moment. Technical Analysis By TradingRage XRP/USDT Price Analysis Against USDT, the XRP price has been consolidating above the %excerpt%.6 support level, failing to either break below or rebound to the upside. The relative strength index has also been hovering around the 50% mark, indicating that the momentum is neither bullish nor bearish. In case a bearish breakout occurs, the 200-day moving average is available to provide support around the %excerpt%.55 mark. On the other hand, a bullish rebound would likely result in a rally toward the %excerpt%.7 resistance level. Source: TradingViewXRP/BTC Price Analysis Against BTC, the price has been bearish, breaking
Topics:
CryptoVizArt considers the following as important: Ripple (XRP) Price, XRP Analysis, xrpbtc, xrpusd
This could be interesting, too:
Jordan Lyanchev writes Ripple’s (XRP) Surge to Triggers Over Million in Short Liquidations
Jordan Lyanchev writes Trump Confirms Work on Strategic Crypto Reserve: XRP, ADA, SOL Included
Dimitar Dzhondzhorov writes Is a Major Ripple v. SEC Lawsuit Development Expected This Week? Here’s Why
Mandy Williams writes Ripple Releases Institutional DeFi Roadmap for XRP Ledger in 2025
Ripple’s price has been moving sideways against USDT while plunging against BTC. Things are looking interesting on both charts at the moment.
Technical Analysis
By TradingRage
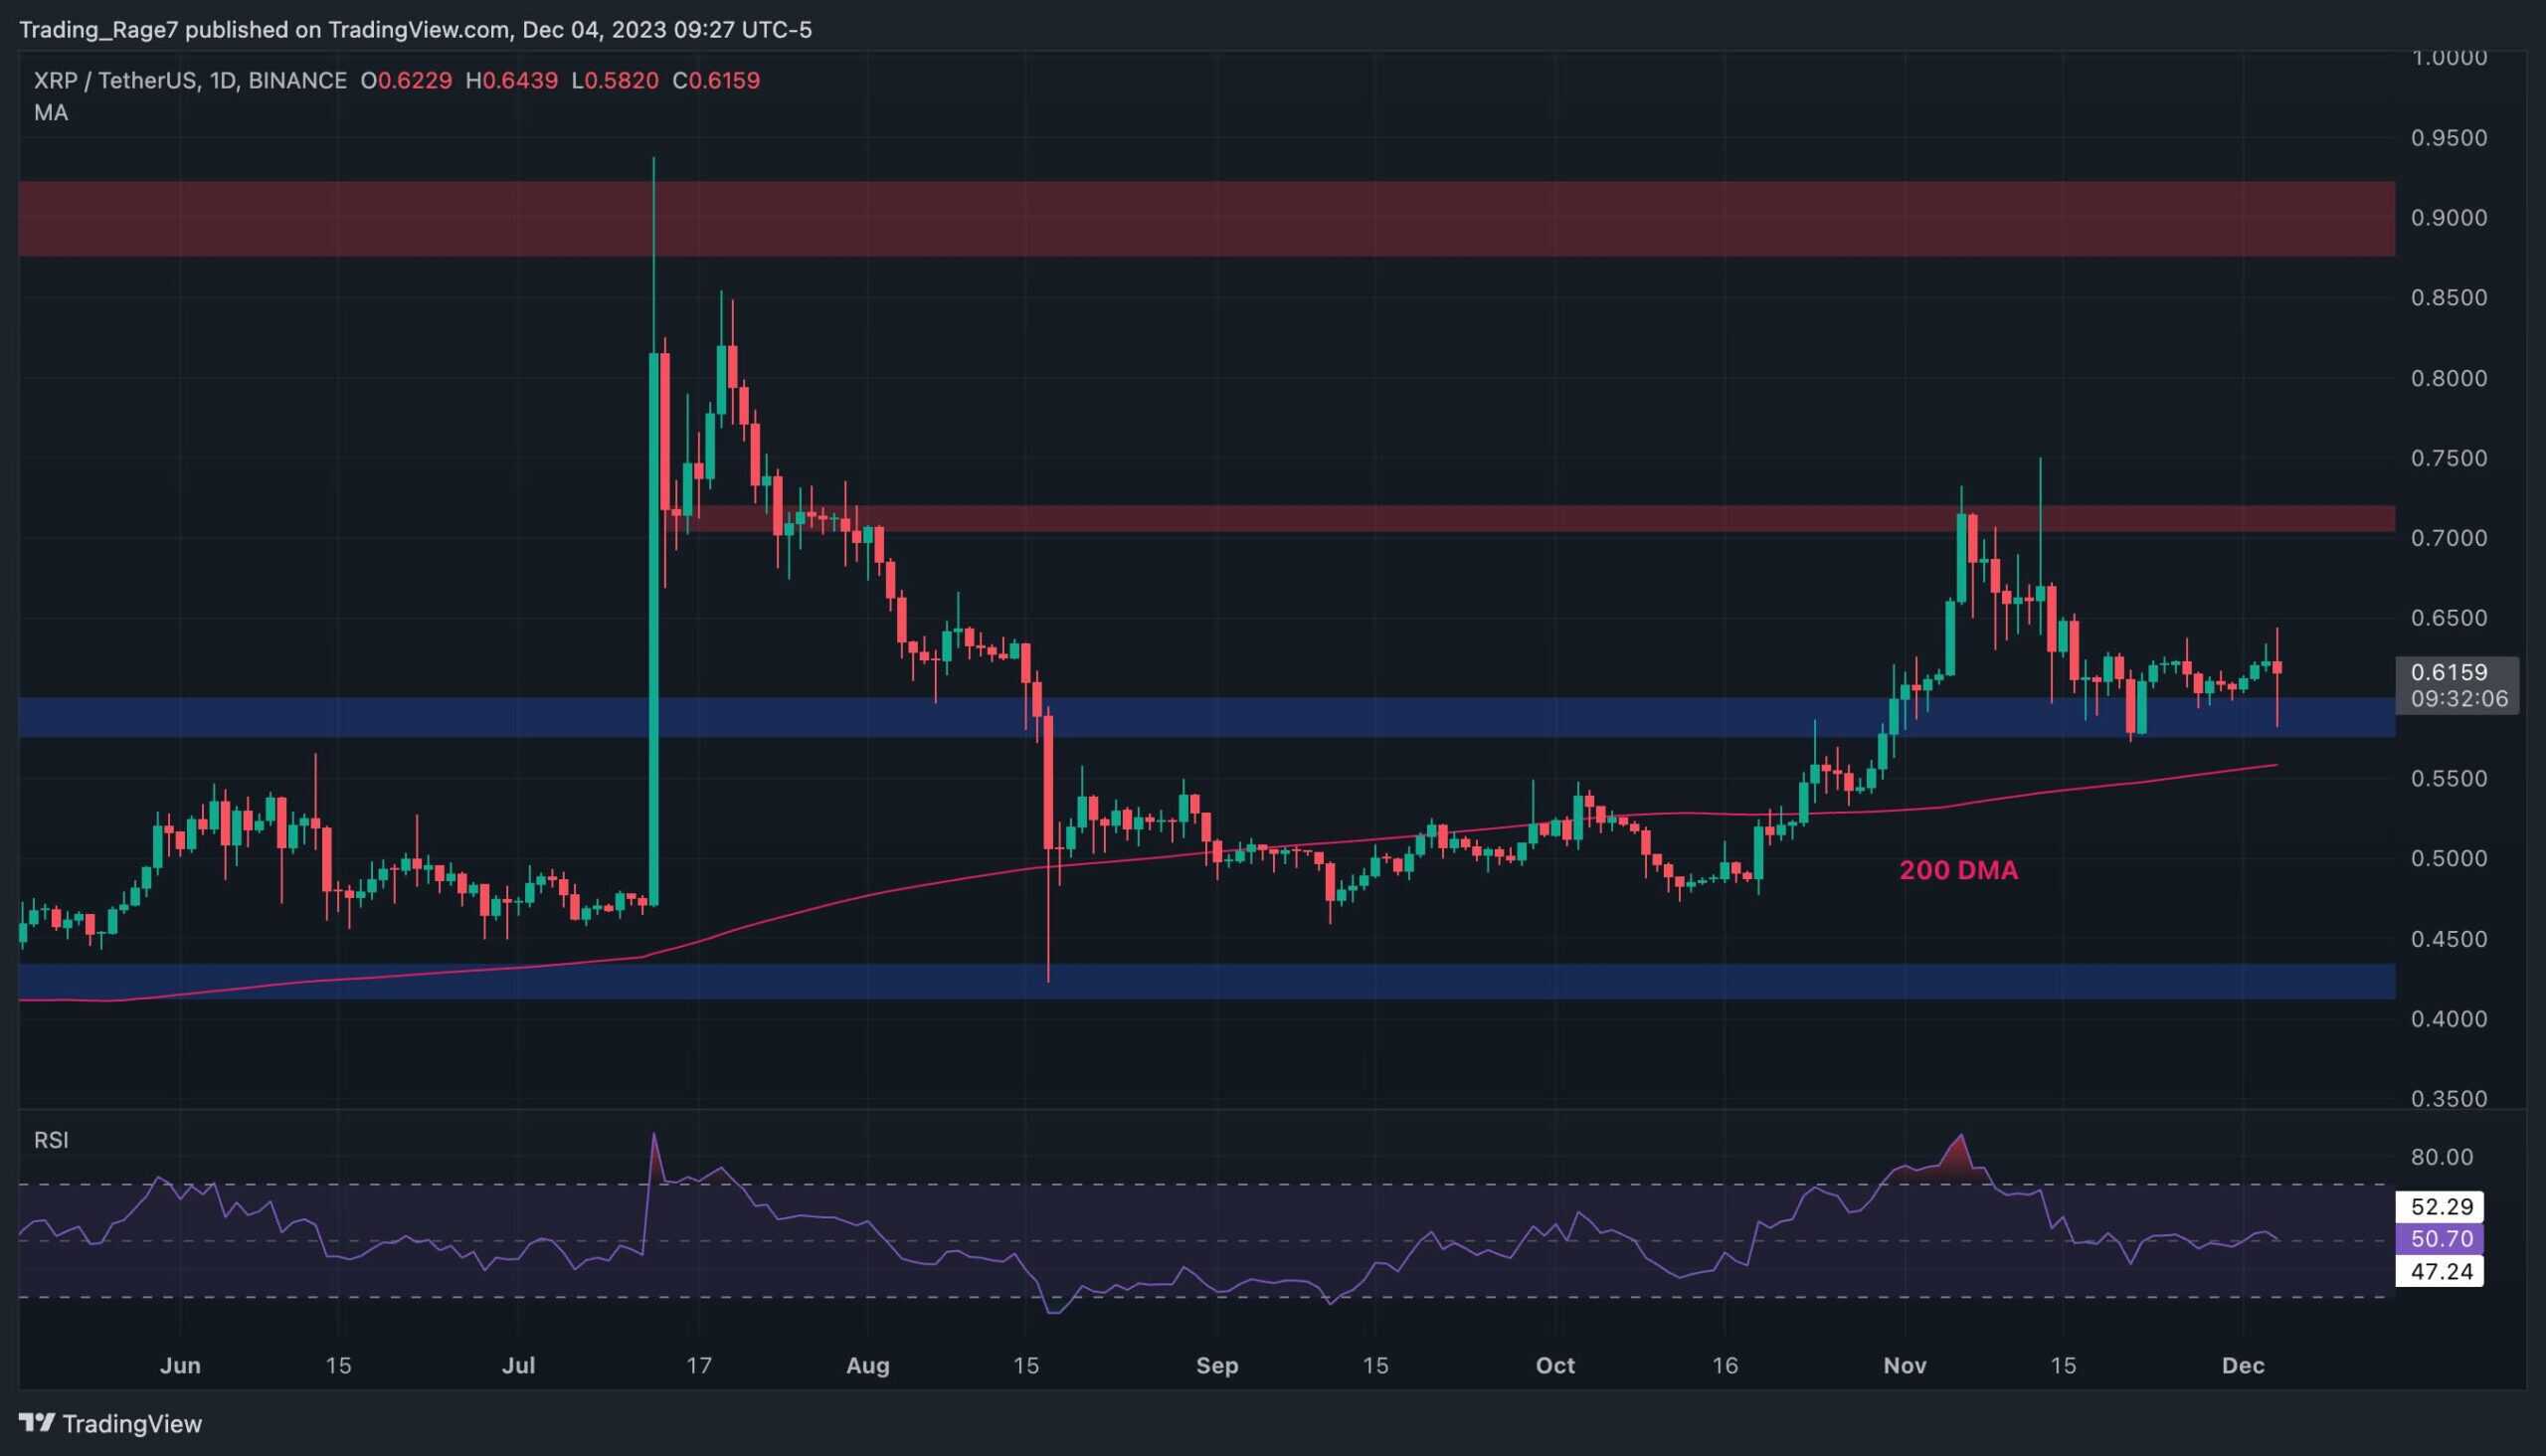
XRP/USDT Price Analysis
Against USDT, the XRP price has been consolidating above the $0.6 support level, failing to either break below or rebound to the upside. The relative strength index has also been hovering around the 50% mark, indicating that the momentum is neither bullish nor bearish.
In case a bearish breakout occurs, the 200-day moving average is available to provide support around the $0.55 mark. On the other hand, a bullish rebound would likely result in a rally toward the $0.7 resistance level.
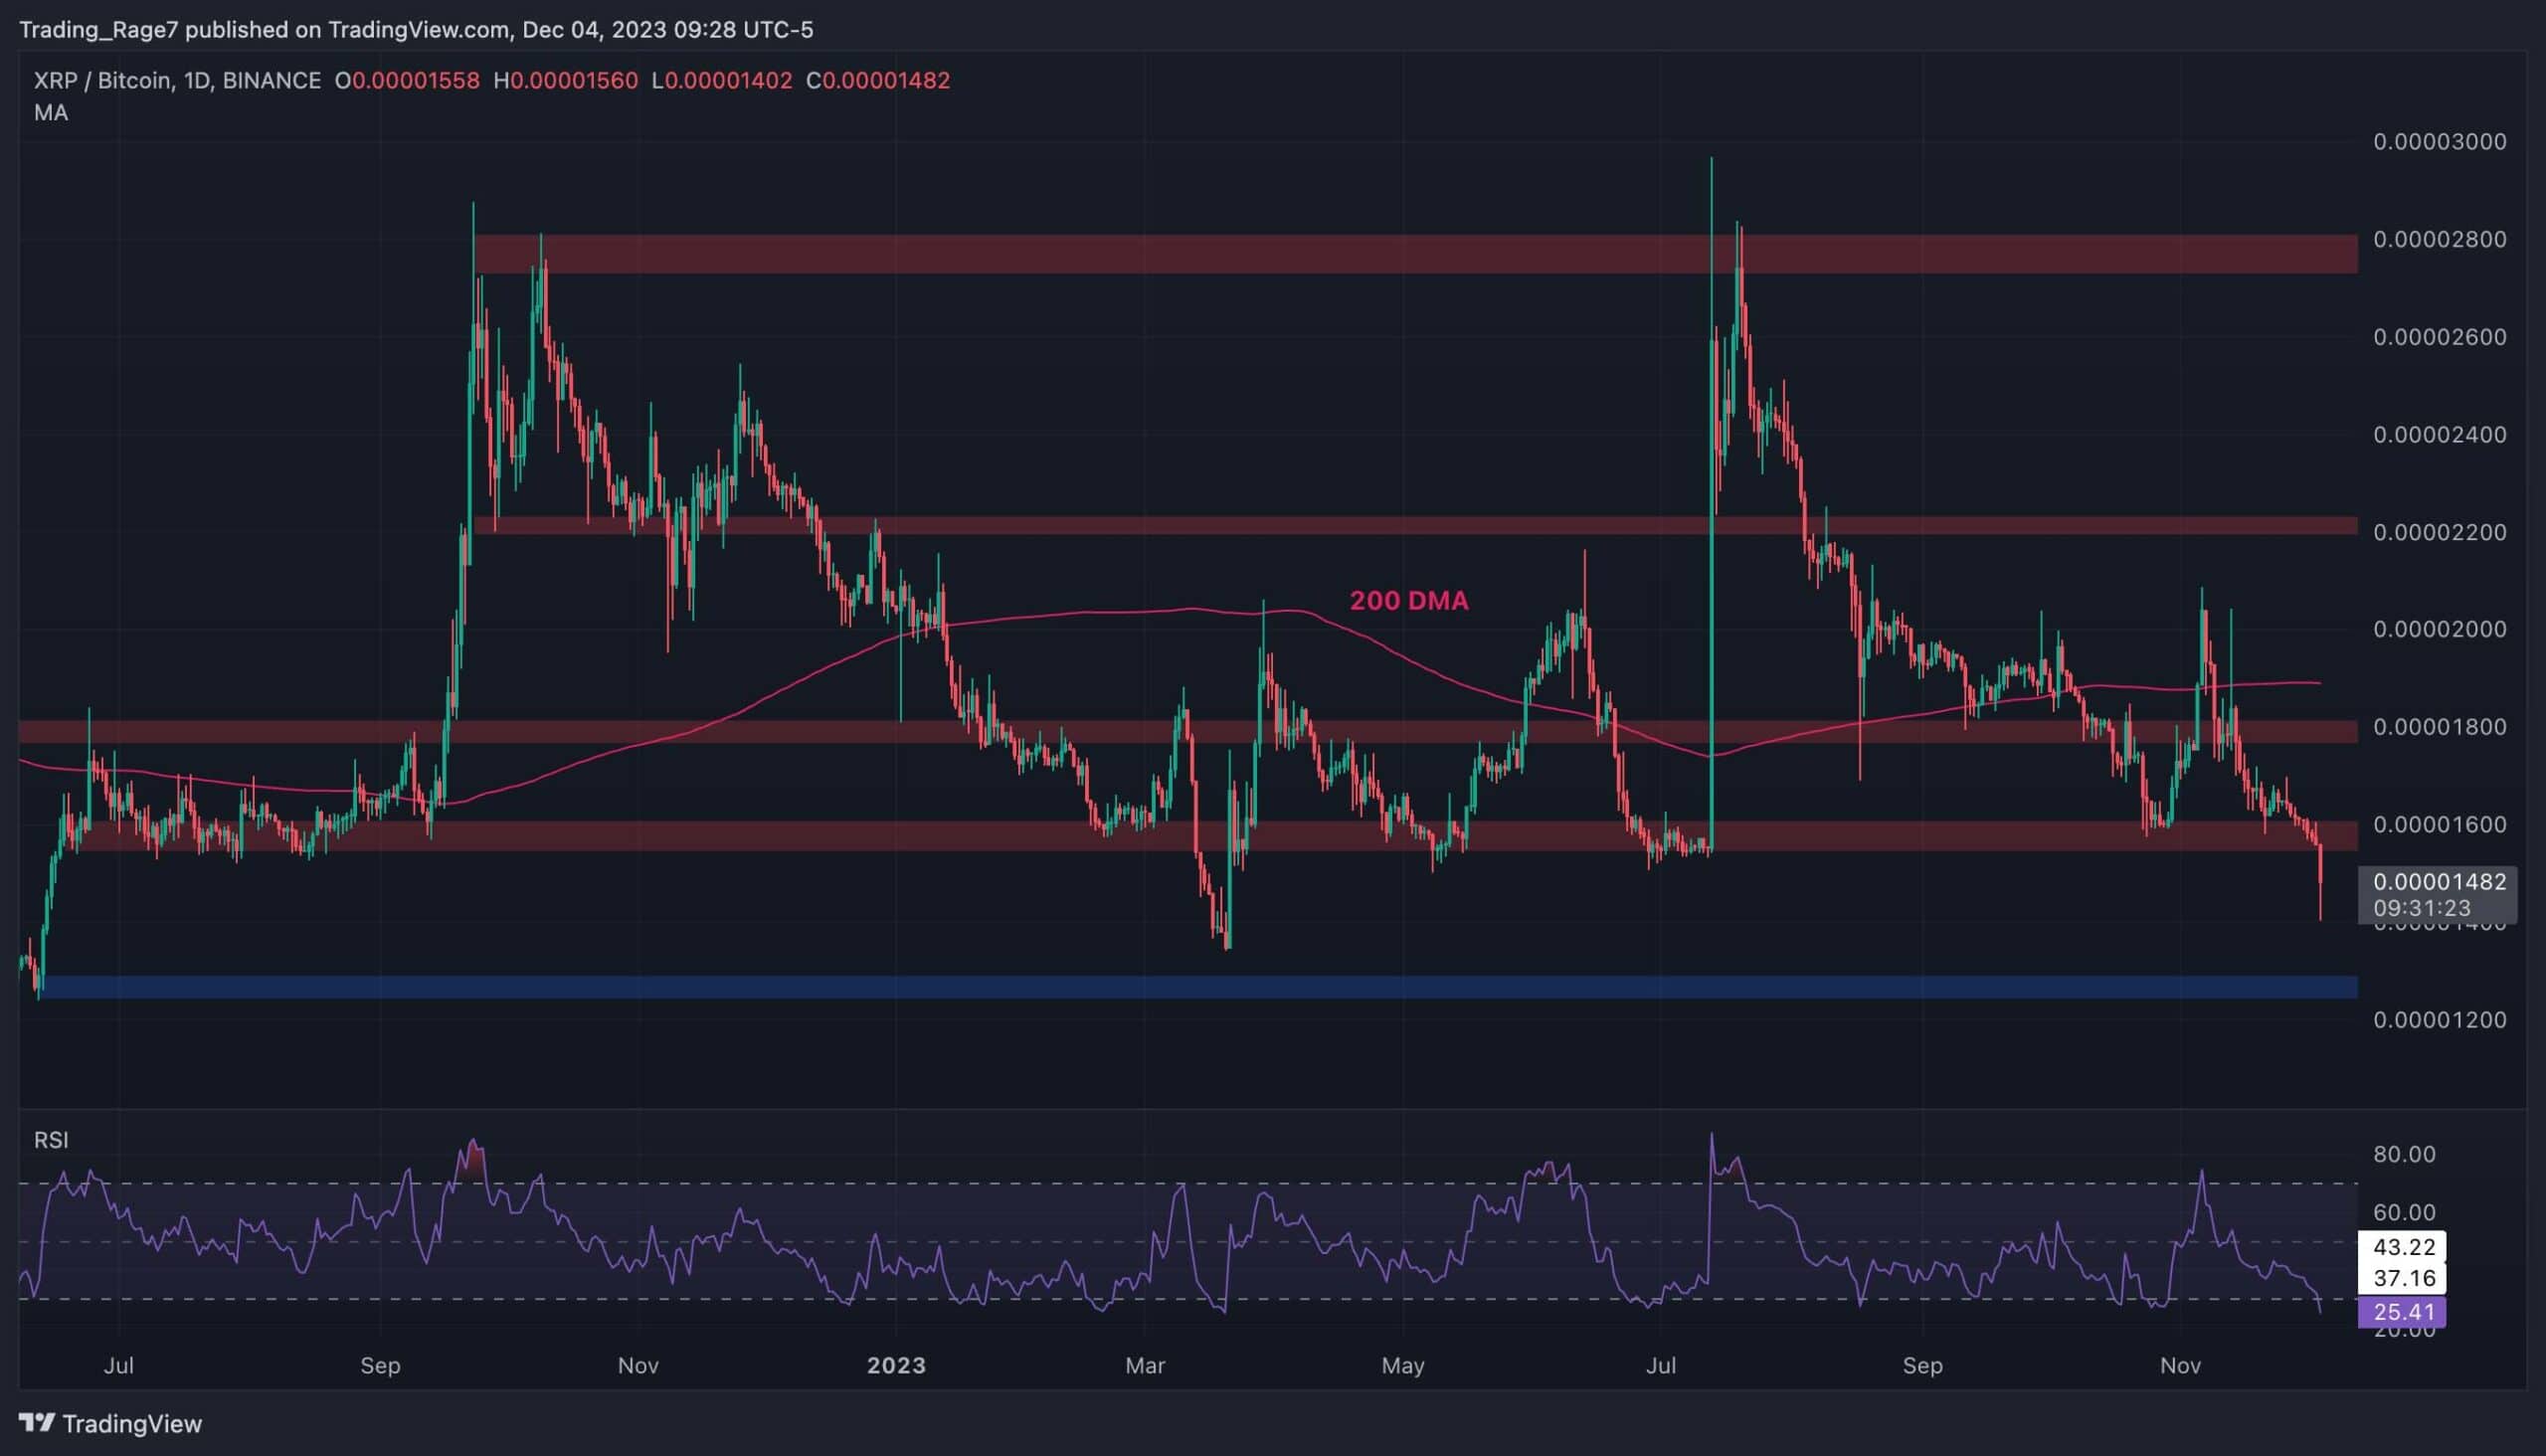
XRP/BTC Price Analysis
Against BTC, the price has been bearish, breaking below multiple support levels since failing to keep above the 200-day moving average, located around the 1,900 SAT mark. Currently, the price is dropping aggressively toward the 1,250 SAT support level, which could be the buyers’ last resort.
Yet, with the relative strength index entering the oversold territory, a bullish pullback to the 1,600 SAT level also seems likely in the near future before the price reaches the 1,250 SAT area.