Ethereum’s price has been blowing past several resistance levels recently. It is currently surging vertically, and the market participants are optimistic that a new bull market has begun. Technical Analysis By TradingRage The Daily Chart The daily chart shows that since the price broke above the 200-day moving average around the ,800 level and the large bullish flag pattern, the market structure has shifted bullish once again. The ,000 and ,150 resistance levels have been broken, and the market is currently targeting the next resistance zone at the ,500 price mark. Yet, the relative strength index is entering the overbought region, and a short-term pullback or consolidation might be near. Source: TradingViewThe 4-Hour Chart The 4-hour chart demonstrates more
Topics:
CryptoVizArt considers the following as important: ETH Analysis, ETHBTC, Ethereum (ETH) Price, ethusd
This could be interesting, too:
Mandy Williams writes Ethereum Derivatives Metrics Signal Modest Downside Tail Risk Ahead: Nansen
Jordan Lyanchev writes Weekly Bitcoin, Ethereum ETF Recap: Light at the End of the Tunnel for BTC
CryptoVizArt writes Will Weak Momentum Drive ETH to .5K? (Ethereum Price Analysis)
Jordan Lyanchev writes Bybit Hack Fallout: Arthur Hayes, Samson Mow Push for Ethereum Rollback
Ethereum’s price has been blowing past several resistance levels recently. It is currently surging vertically, and the market participants are optimistic that a new bull market has begun.
Technical Analysis
By TradingRage
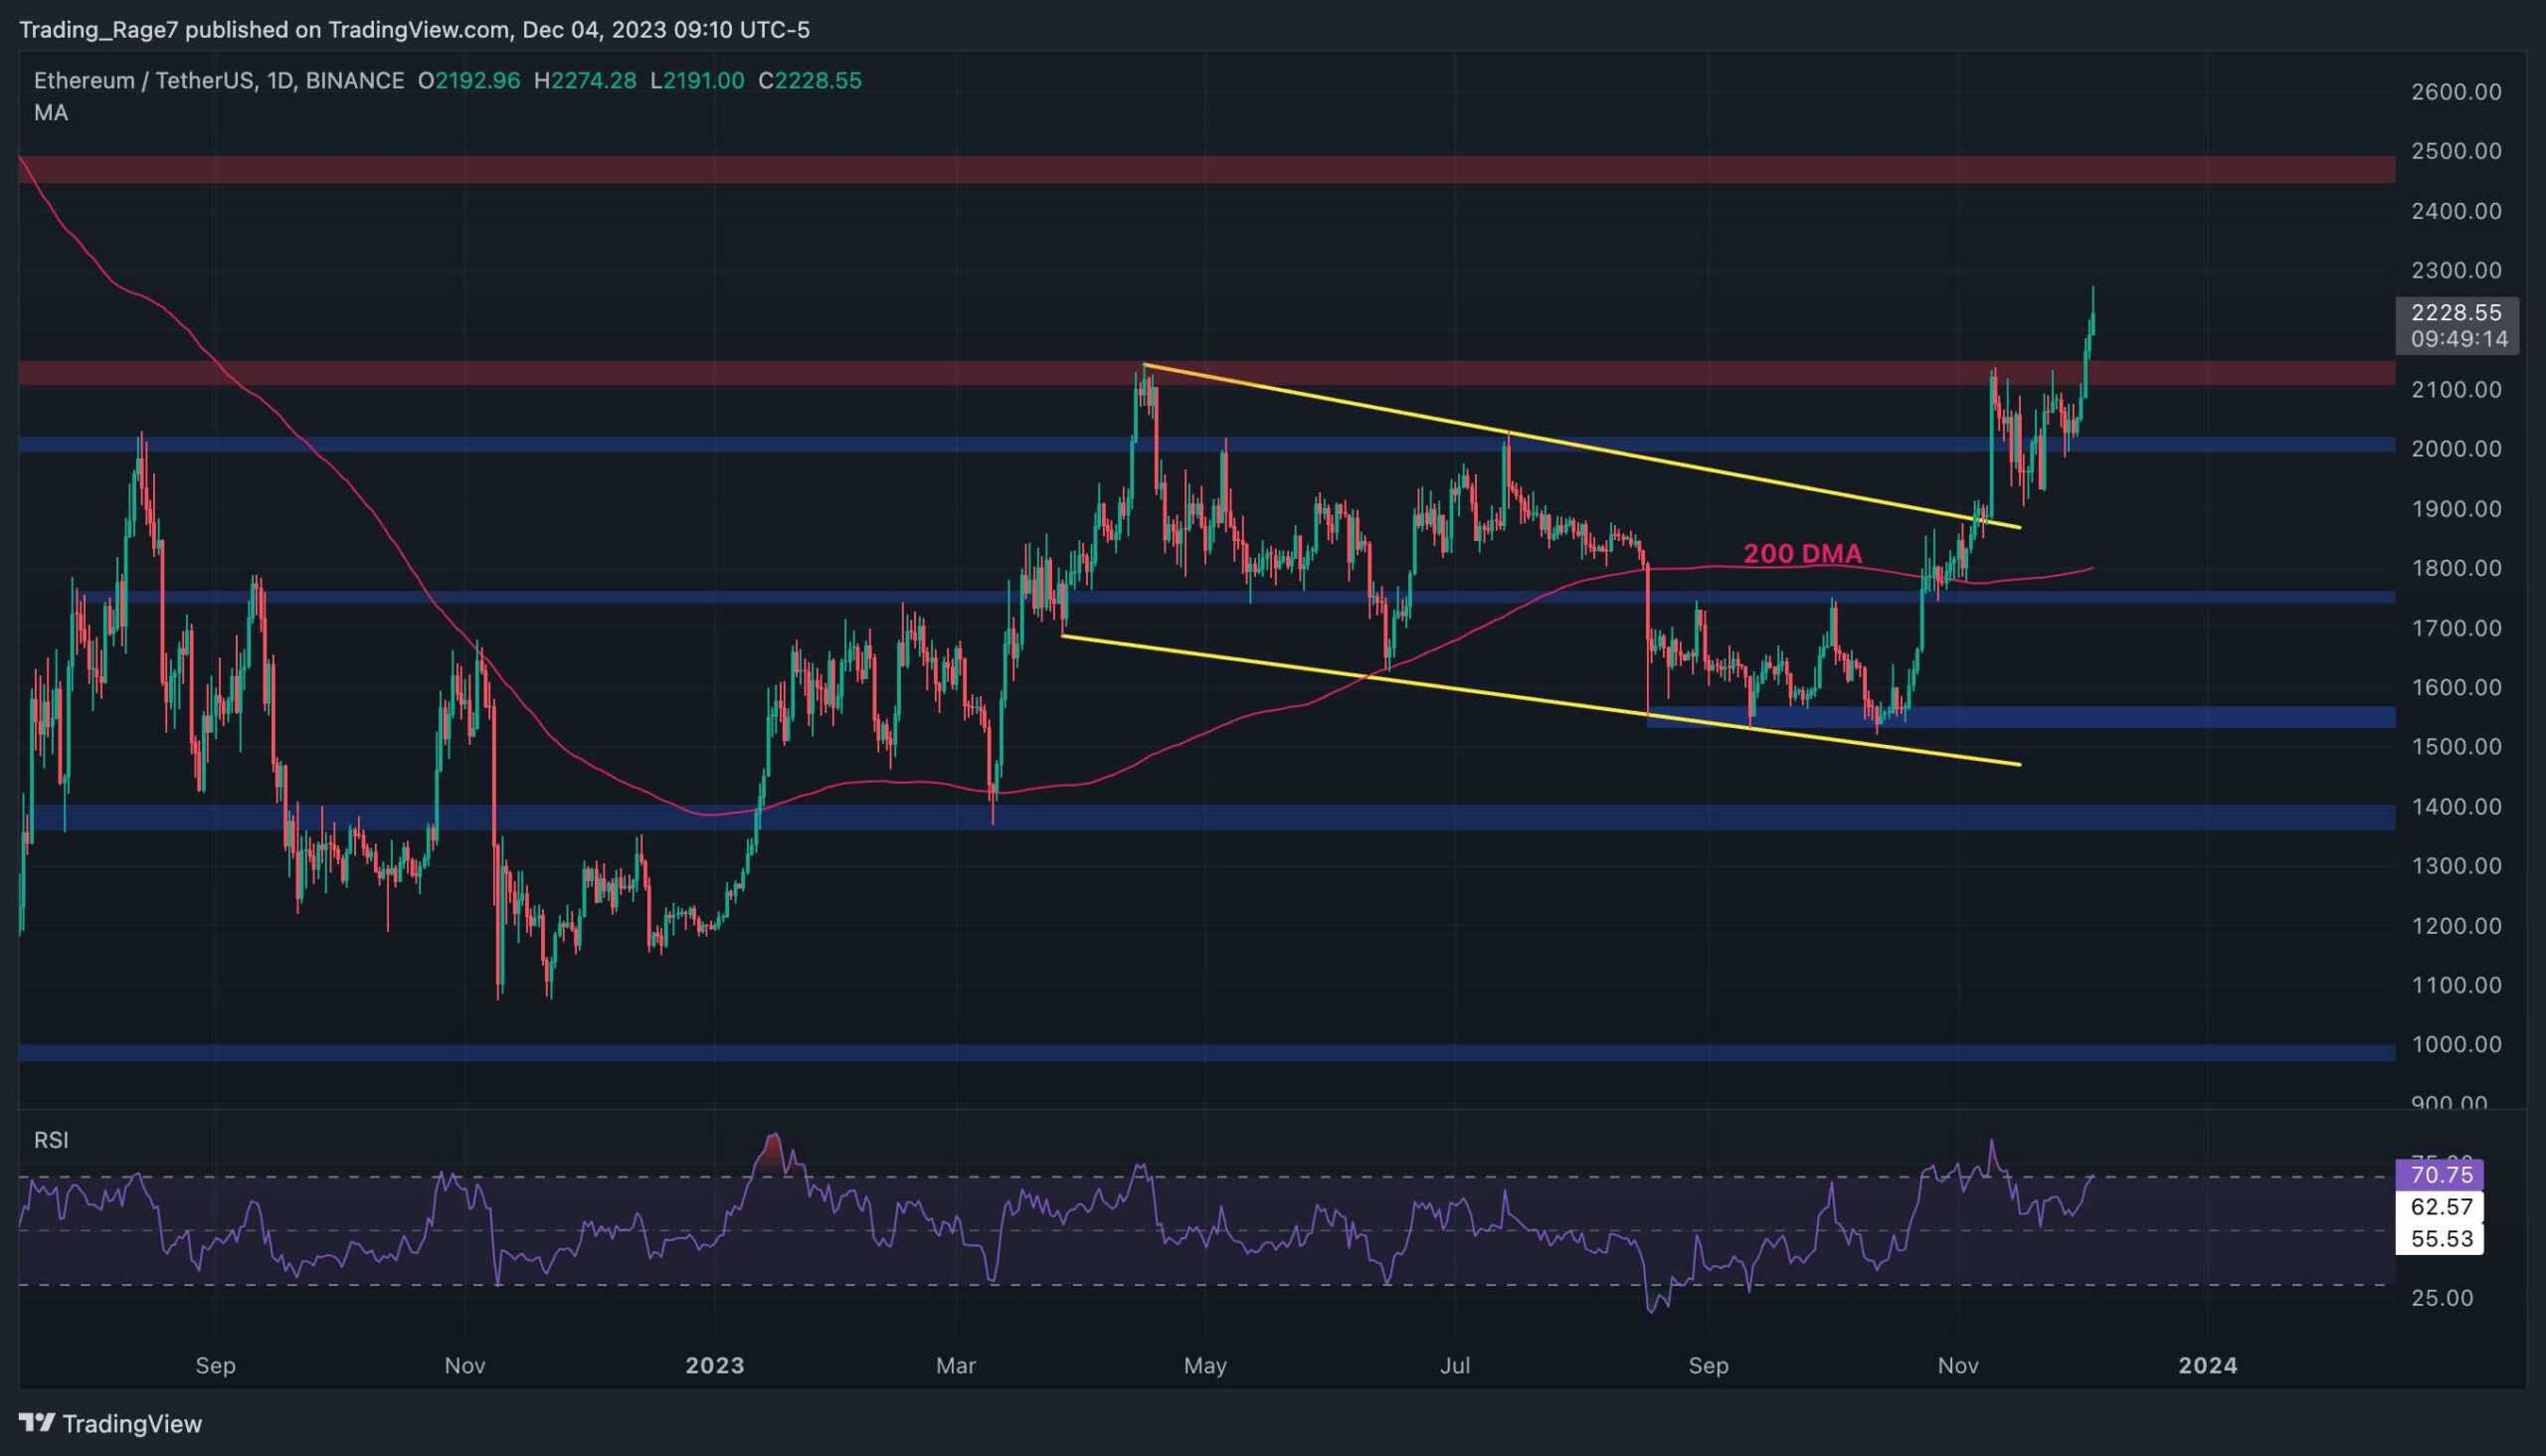
The Daily Chart
The daily chart shows that since the price broke above the 200-day moving average around the $1,800 level and the large bullish flag pattern, the market structure has shifted bullish once again. The $2,000 and $2,150 resistance levels have been broken, and the market is currently targeting the next resistance zone at the $2,500 price mark.
Yet, the relative strength index is entering the overbought region, and a short-term pullback or consolidation might be near.
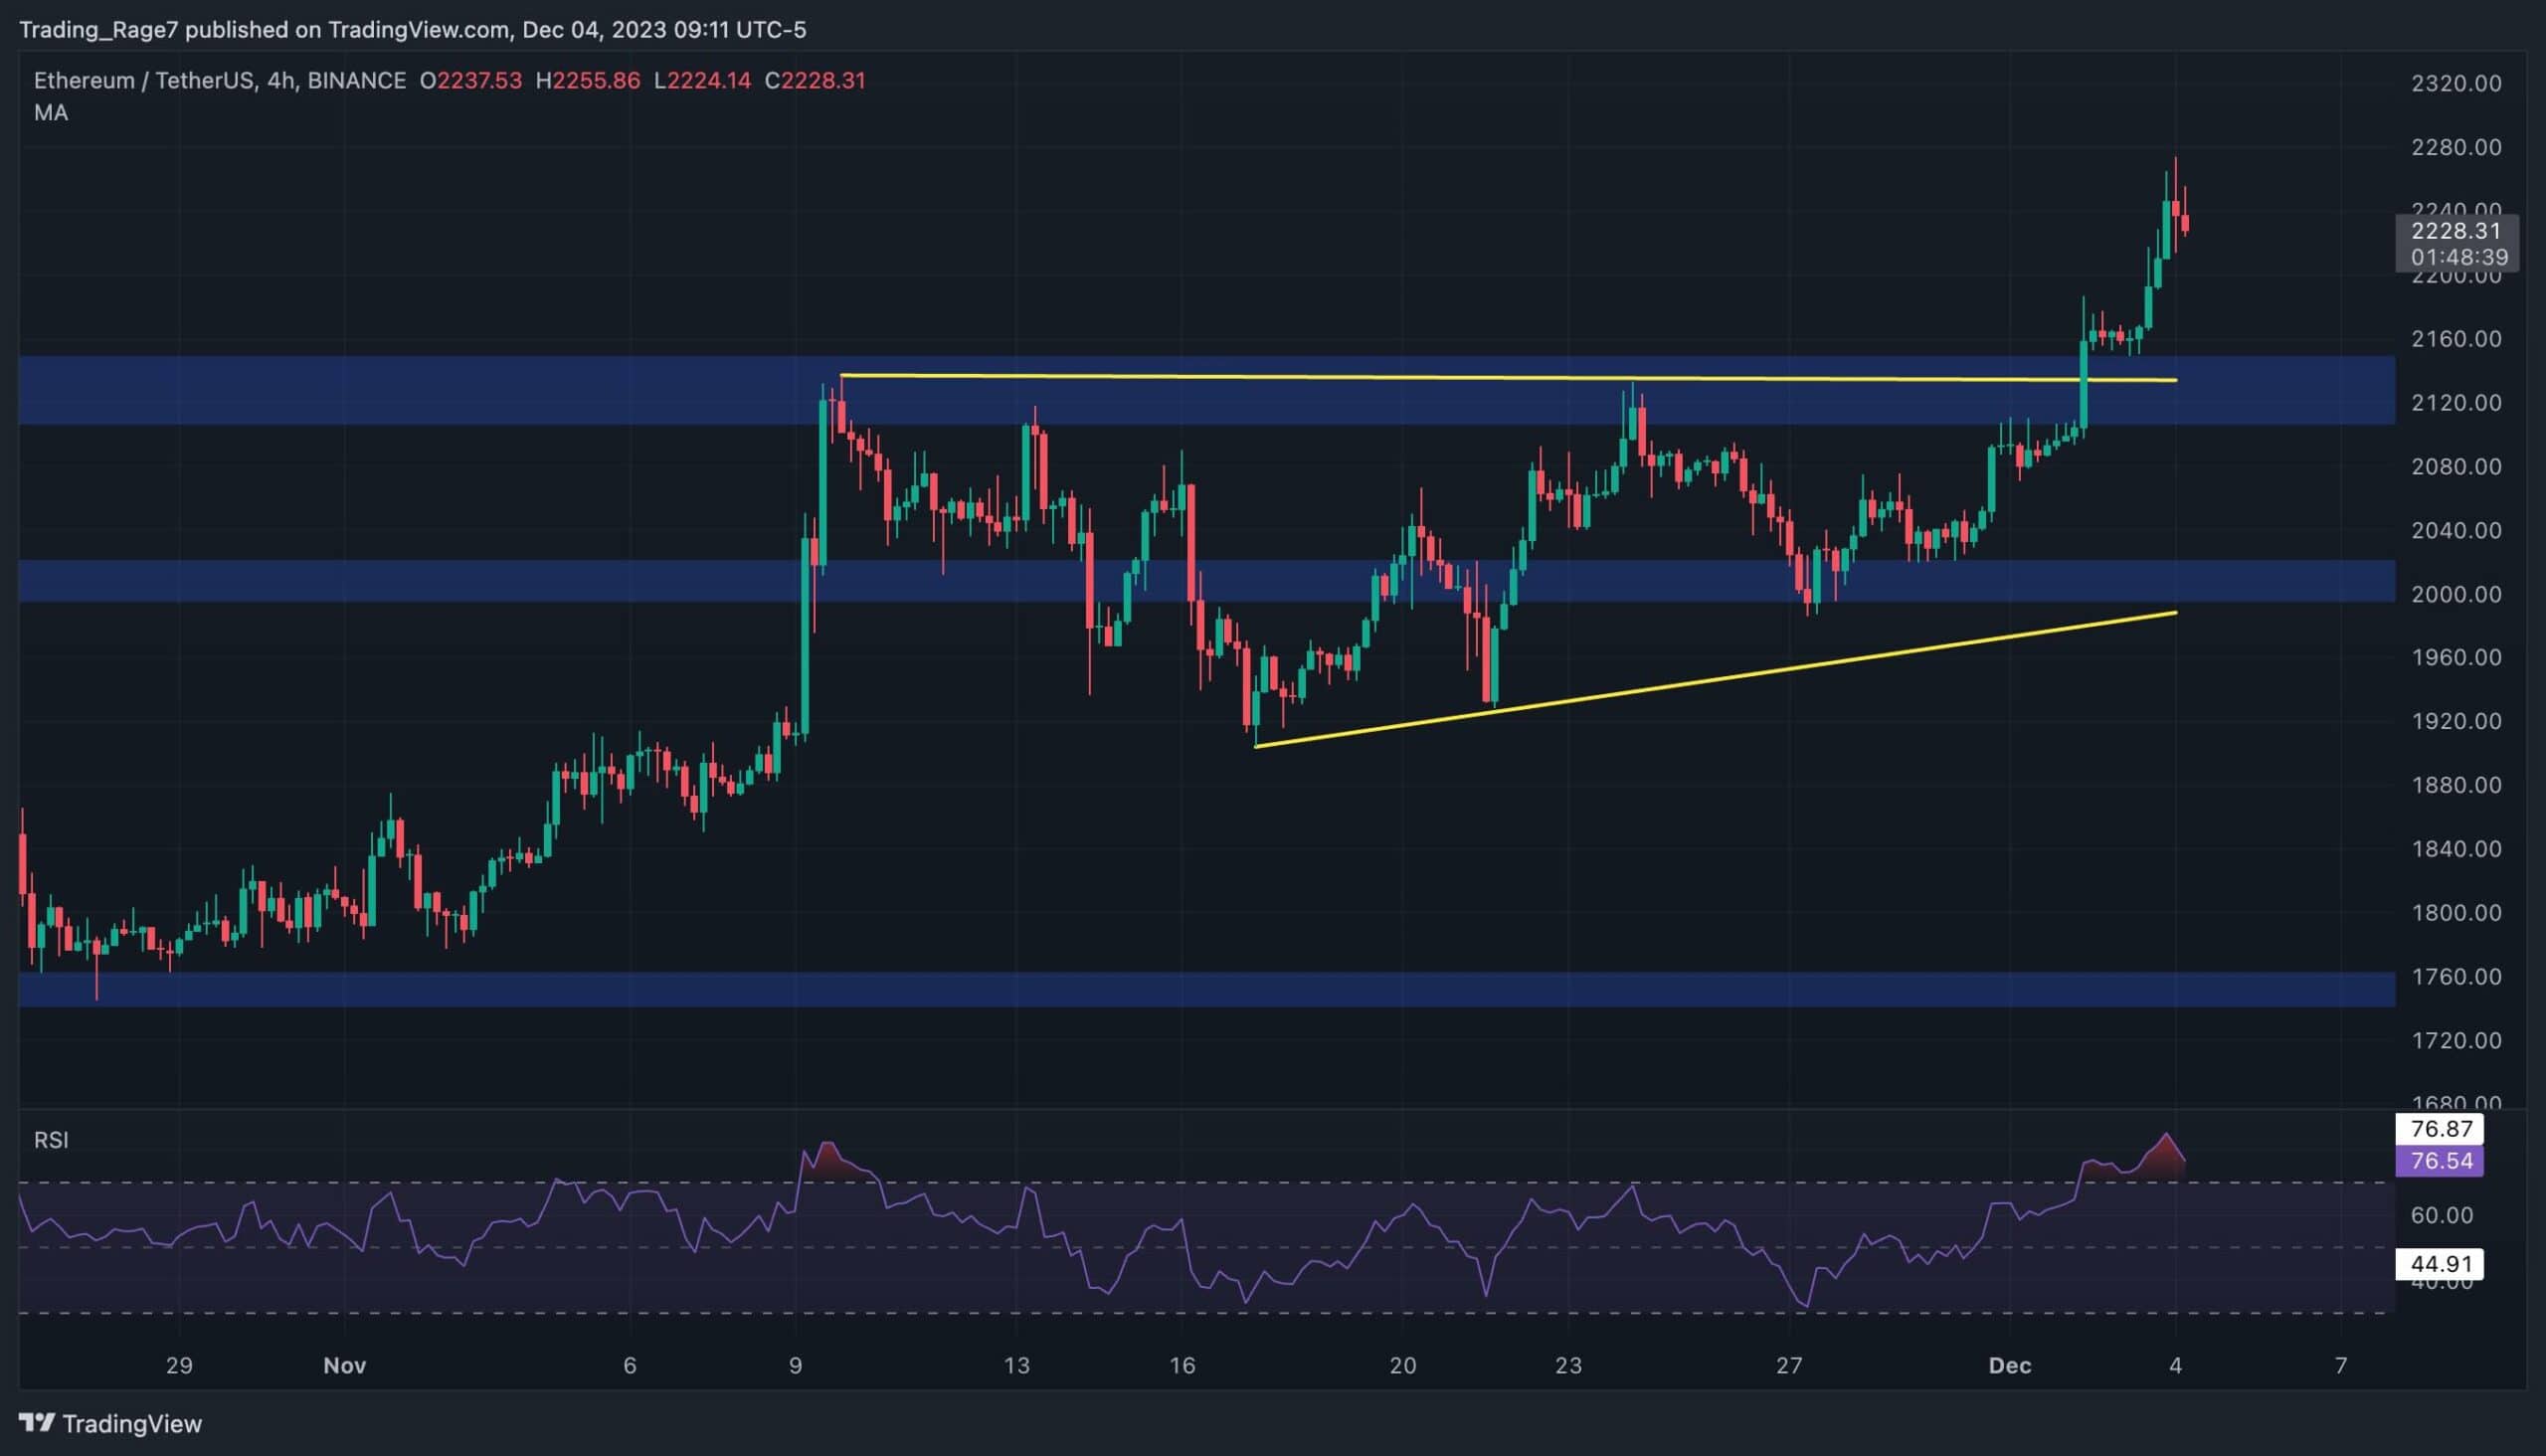
The 4-Hour Chart
The 4-hour chart demonstrates more details about the recent Ethereum price action. ETH has been forming a rising wedge pattern around the $2,000 mark but has broken past its higher boundary with ease. Consequently, the market has rallied aggressively and is currently trading above $2,200.
Yet, with the relative strength index showing a clear overbought signal and the last few 4-hour candles demonstrating weakness in bullish momentum, a pullback toward the $2,150 support level is expected in the coming weeks.
Sentiment Analysis
By TradingRage
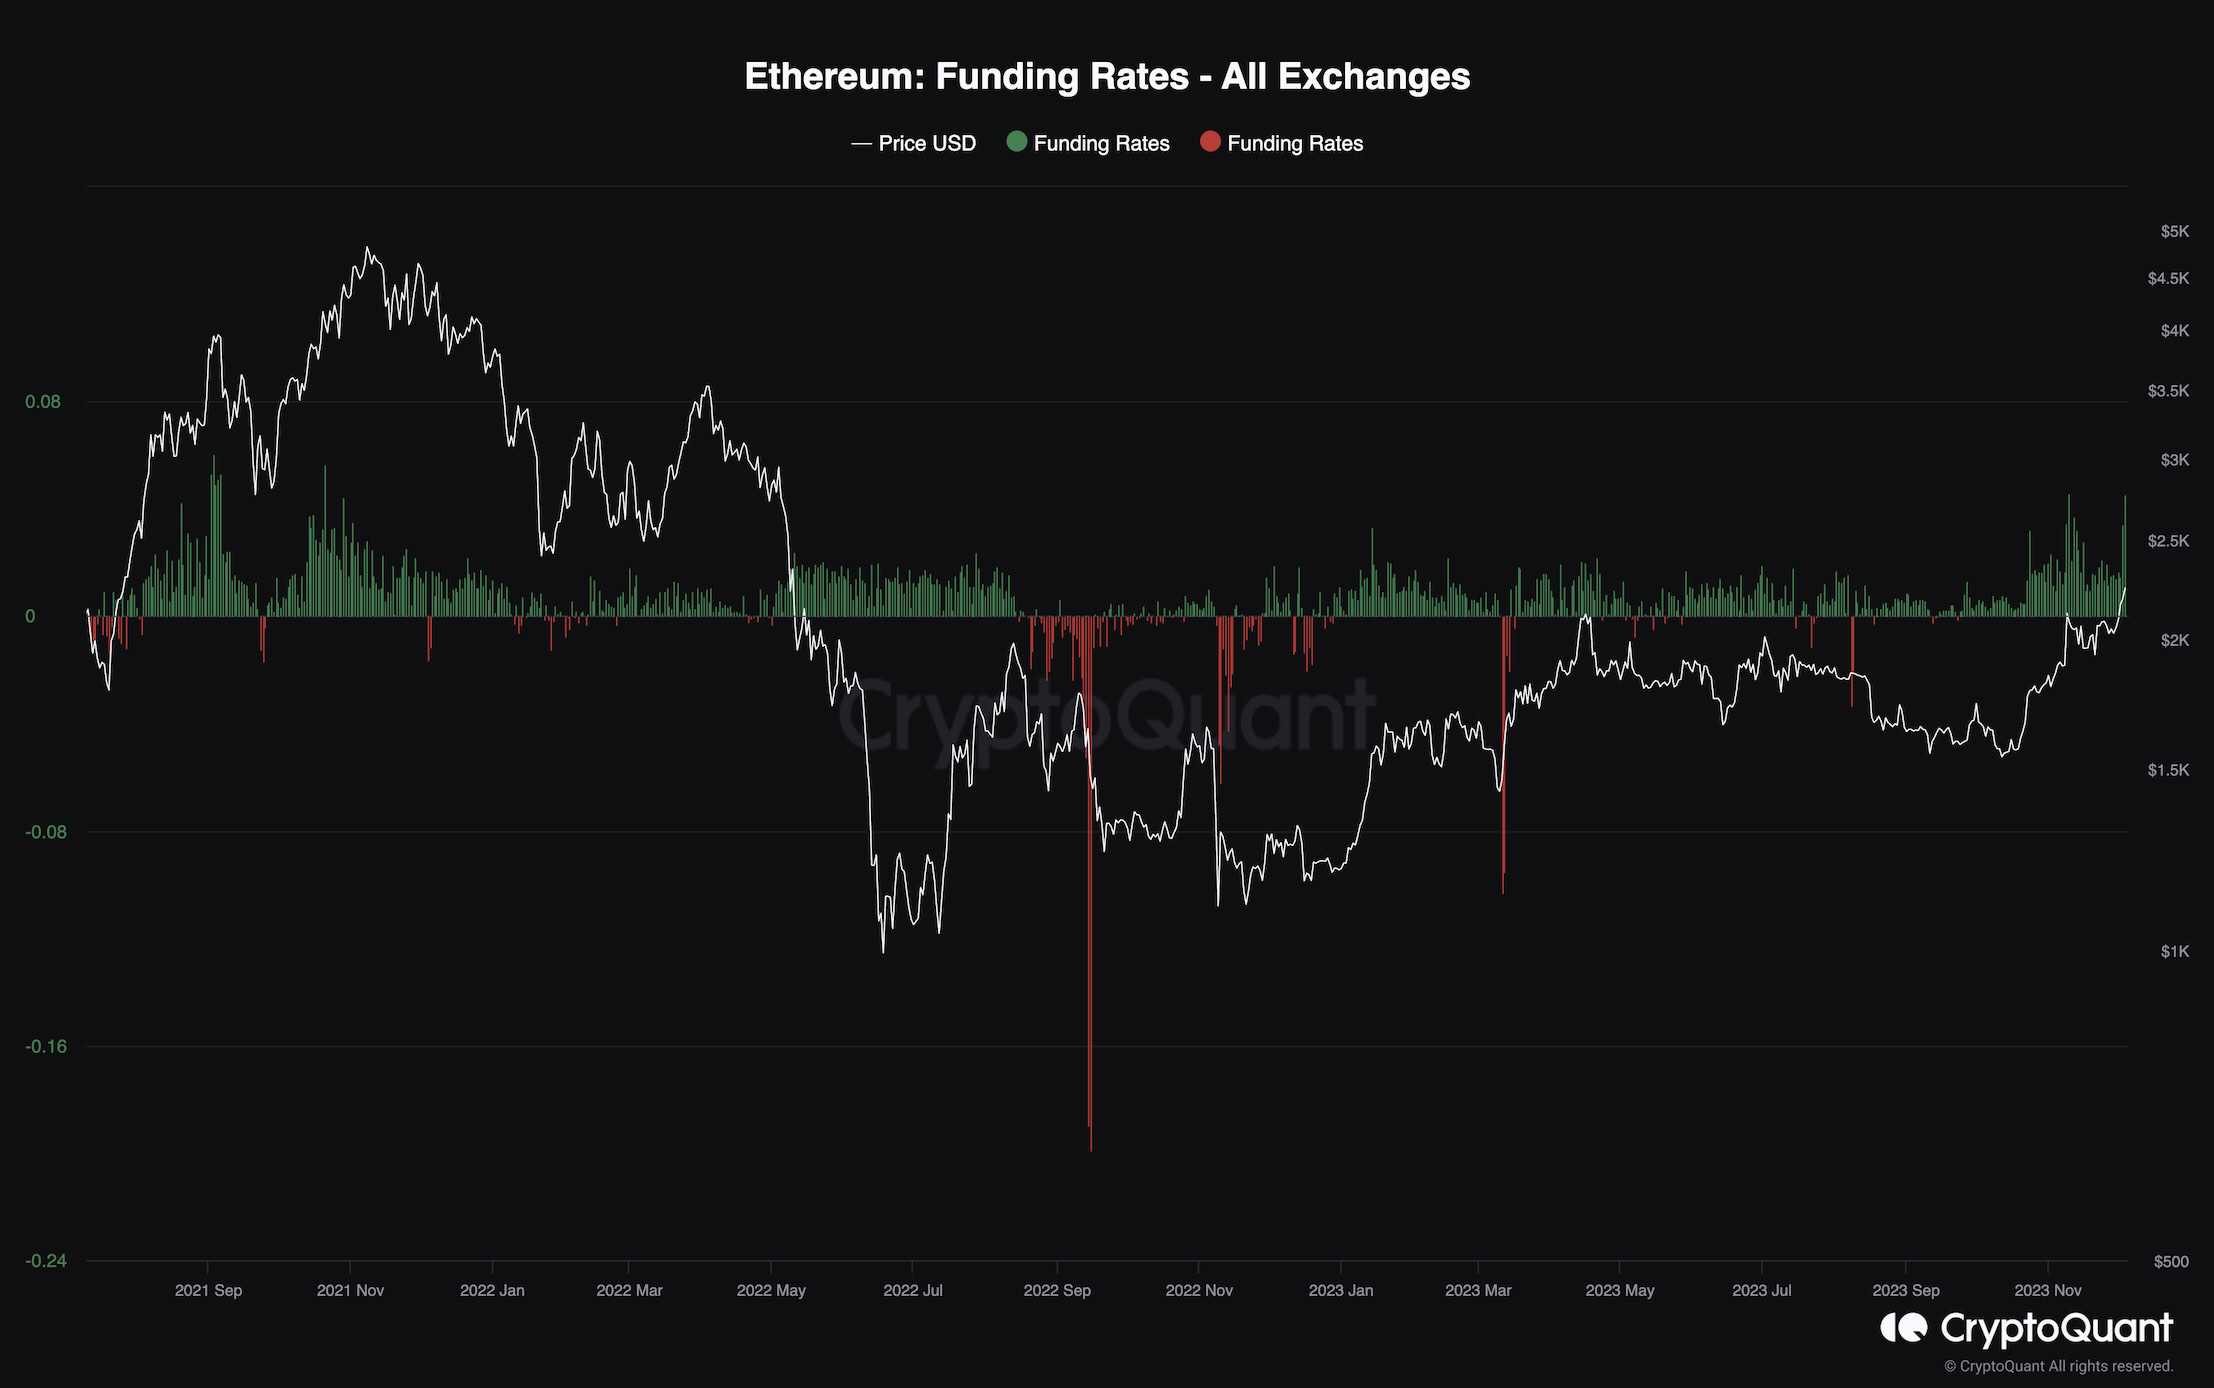
Funding Rates
Ethereum’s price has risen rapidly over the last few weeks, pushing past the $2,000 level. In the current situation, analyzing the futures market metrics can provide beneficial insights for investors.
This chart demonstrates the funding rates, one of the most useful metrics for evaluating the futures market sentiment. Positive funding values indicate that the longs are more aggressive. Conversely, negative values are associated with more dominance by the short sellers.
As the chart depicts, the funding rates are printing highly positive values with the recent surge in price. These values are similar levels previously seen during the $69K all-time high range. Therefore, investors should be cautious as a pullback or even a reversal looks very likely in the short term.