Bitcoin’s price has failed to make a new all-time high and is currently going through a correction. Yet, the bull market might still be far from over. Technical Analysis By TradingRage The Daily Chart On the daily chart, the price has failed to hold above the K level and is currently going through a correction. This is not a good sign, as the cryptocurrency recently broke above a large descending channel but has struggled to continue higher, making it a fake breakout. The RSI has also dropped below 50%, indicating that the momentum is bearish once more. It seems that a decline toward the K support zone is probable at the moment. Source: TradingViewThe 4-Hour Chart Looking at the 4-hour chart, things seem a little better. The price has been consolidating inside a
Topics:
CryptoVizArt considers the following as important: Bitcoin (BTC) Price, BTC Analysis, BTCEUR, BTCGBP, btcusd, btcusdt
This could be interesting, too:
Chayanika Deka writes XRP, SOL, and ADA Inclusion in US Crypto Reserve Pushes Traders on Edge
Chayanika Deka writes Why Arthur Hayes Is Bullish on Bitcoin Under Trump’s Economic Strategy
Mandy Williams writes Why the Bitcoin Market Is Stuck—and the Key Metric That Could Change It: CryptoQuant CEO
Wayne Jones writes Metaplanet Acquires 156 BTC, Bringing Total Holdings to 2,391
Bitcoin’s price has failed to make a new all-time high and is currently going through a correction. Yet, the bull market might still be far from over.
Technical Analysis
By TradingRage
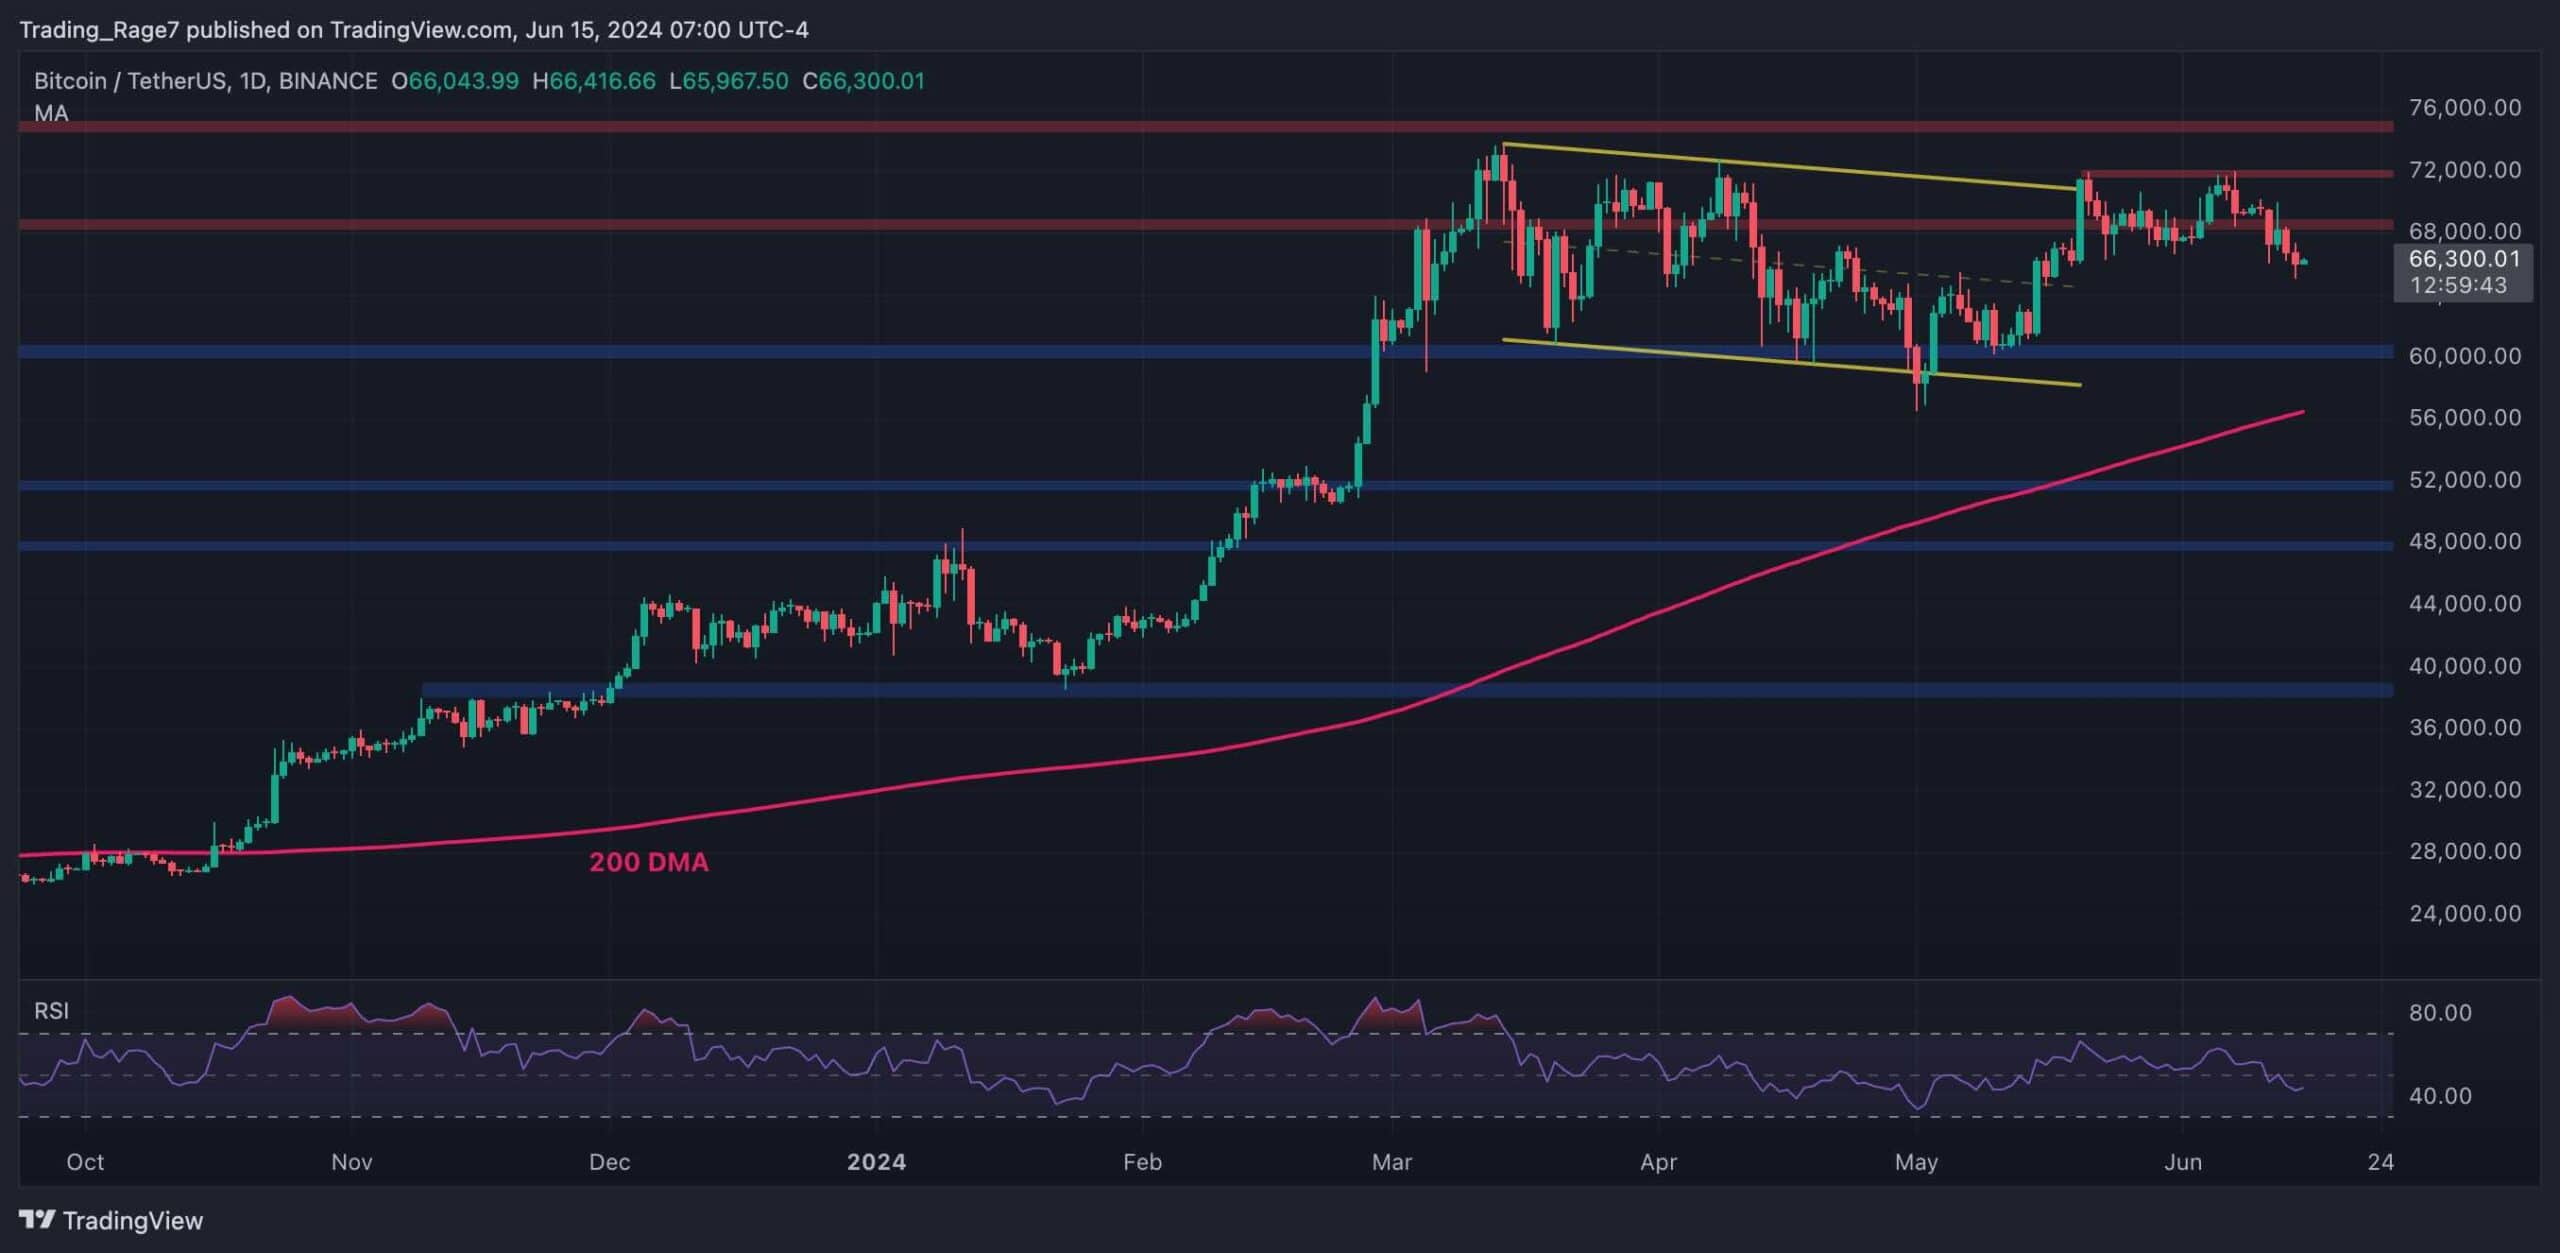
The Daily Chart
On the daily chart, the price has failed to hold above the $66K level and is currently going through a correction. This is not a good sign, as the cryptocurrency recently broke above a large descending channel but has struggled to continue higher, making it a fake breakout.
The RSI has also dropped below 50%, indicating that the momentum is bearish once more. It seems that a decline toward the $60K support zone is probable at the moment.
The 4-Hour Chart
Looking at the 4-hour chart, things seem a little better. The price has been consolidating inside a horizontal channel. While the market has recently broken below the channel, it has quickly recovered back inside it.
If the price climbs back inside the channel, the market can test the higher boundary of the pattern once more, located around the $72K mark. However, if the channel breaks down, a drop toward the $60K level would be imminent.
