Ethereum’s rally has come to a halt, as the price has failed to continue above the ,000 level once more. However, not all hopes for a new bull run are lost just yet. Technical Analysis By TradingRage The Daily Chart The price has been decreasing in the last two weeks based on the daily timeframe of the ETH/USDT chart. This short-term downtrend has begun since the cryptocurrency has been rejected from the ,000 resistance level once again. Currently, the ,500 level provides support and prevents the market from dropping lower. A bearish breakout could result in a further decline toward ,000 and the 200-day moving average located around the same area. This would be a key area, as a drop lower could cause a shift in the overall trend. Source: TradingViewThe 4-Hour
Topics:
CryptoVizArt considers the following as important: ETH Analysis, ETHBTC, Ethereum (ETH) Price, ethusd
This could be interesting, too:
Mandy Williams writes Ethereum Derivatives Metrics Signal Modest Downside Tail Risk Ahead: Nansen
Jordan Lyanchev writes Weekly Bitcoin, Ethereum ETF Recap: Light at the End of the Tunnel for BTC
CryptoVizArt writes Will Weak Momentum Drive ETH to .5K? (Ethereum Price Analysis)
Jordan Lyanchev writes Bybit Hack Fallout: Arthur Hayes, Samson Mow Push for Ethereum Rollback
Ethereum’s rally has come to a halt, as the price has failed to continue above the $4,000 level once more. However, not all hopes for a new bull run are lost just yet.
Technical Analysis
By TradingRage
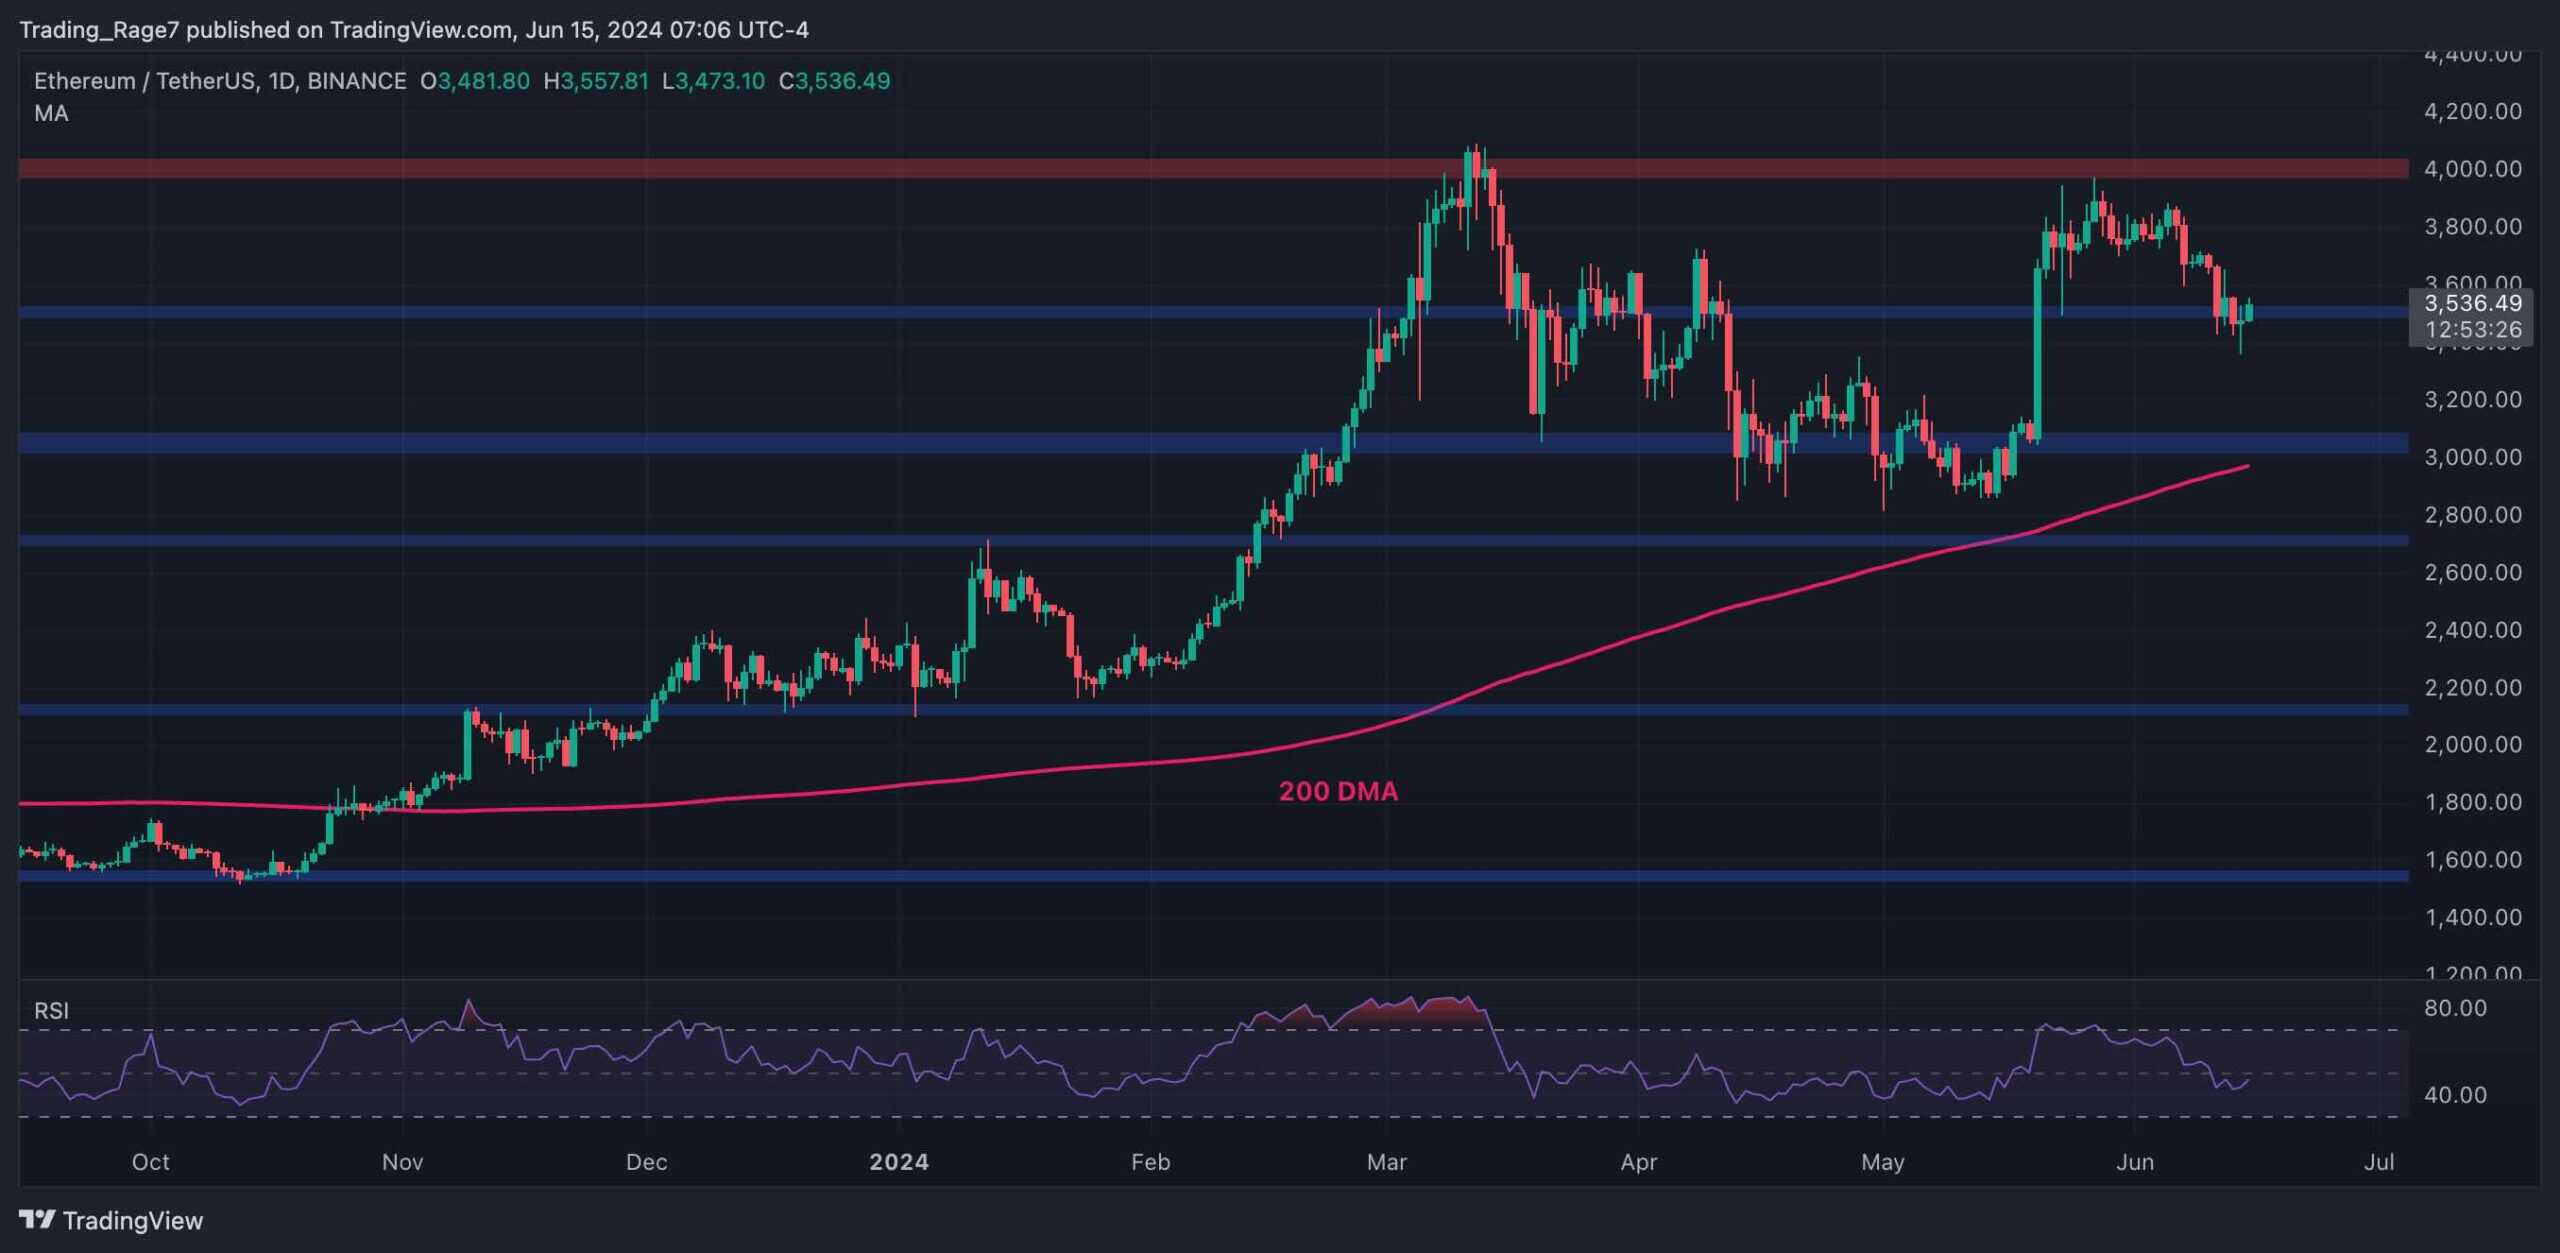
The Daily Chart
The price has been decreasing in the last two weeks based on the daily timeframe of the ETH/USDT chart. This short-term downtrend has begun since the cryptocurrency has been rejected from the $4,000 resistance level once again.
Currently, the $3,500 level provides support and prevents the market from dropping lower. A bearish breakout could result in a further decline toward $3,000 and the 200-day moving average located around the same area. This would be a key area, as a drop lower could cause a shift in the overall trend.
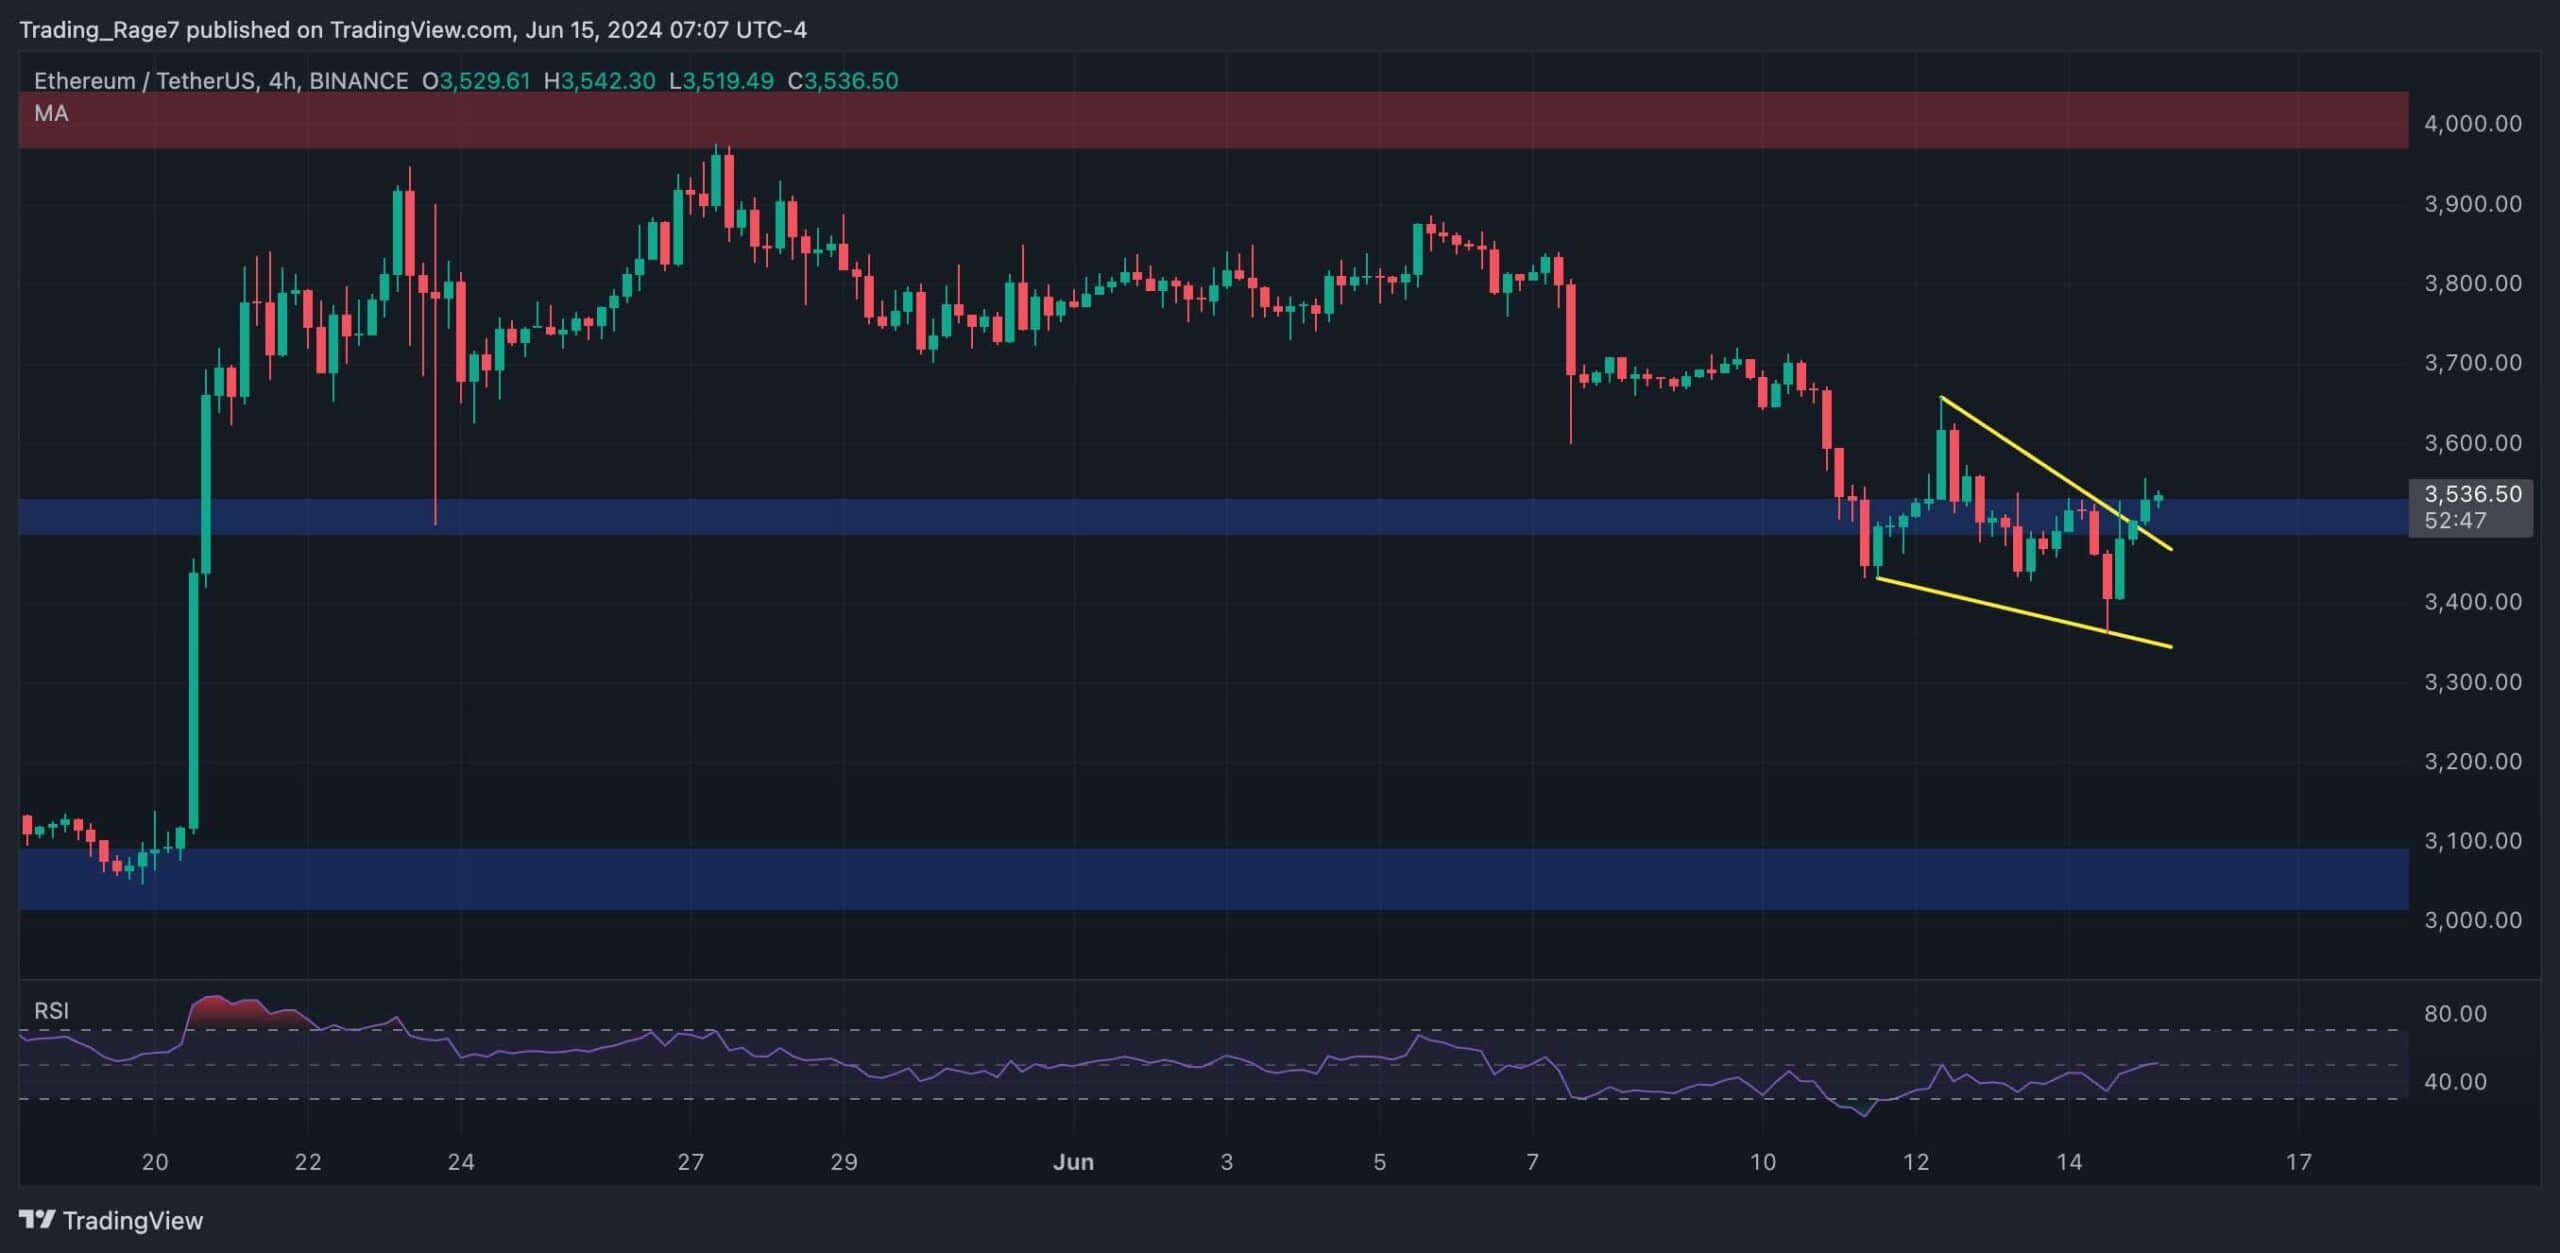
The 4-Hour Chart
Looking at the 4-hour chart, the price is seemingly starting to rebound from the $3,500 support zone. It has formed a falling wedge pattern and broken above it, a classical bullish reversal pattern.
If the market can rise above the recent high around the $3,650 mark, a rally back toward the $4,000 resistance zone would be highly probable. With the RSI also climbing back above 50%, a bullish scenario is much more likely.