Bitcoin’s prolonged downward correction has encountered a pause in the vicinity of a significant support area, primarily defined by the 200-day moving average, sparking a slight rebound. However, the recent uptick appears to lack the necessary momentum, suggesting a potential phase of sideways consolidation. Technical Analysis By Shayan The Daily Chart A thorough examination of the daily chart reveals a temporary halt in Bitcoin’s recent correction near a pivotal support range, indicated by the middle boundary of the ascending channel and the crucial 200-day moving average at K. This support prompted an uptick in demand, leading to a slight upward retracement. With the strength of this support range and the possible presence of substantial demand, it is anticipated to
Topics:
CryptoVizArt considers the following as important: Bitcoin (BTC) Price, BTC Analysis, BTCEUR, BTCGBP, btcusd, btcusdt
This could be interesting, too:
Chayanika Deka writes XRP, SOL, and ADA Inclusion in US Crypto Reserve Pushes Traders on Edge
Chayanika Deka writes Why Arthur Hayes Is Bullish on Bitcoin Under Trump’s Economic Strategy
Mandy Williams writes Why the Bitcoin Market Is Stuck—and the Key Metric That Could Change It: CryptoQuant CEO
Wayne Jones writes Metaplanet Acquires 156 BTC, Bringing Total Holdings to 2,391
Bitcoin’s prolonged downward correction has encountered a pause in the vicinity of a significant support area, primarily defined by the 200-day moving average, sparking a slight rebound. However, the recent uptick appears to lack the necessary momentum, suggesting a potential phase of sideways consolidation.
Technical Analysis
By Shayan
The Daily Chart
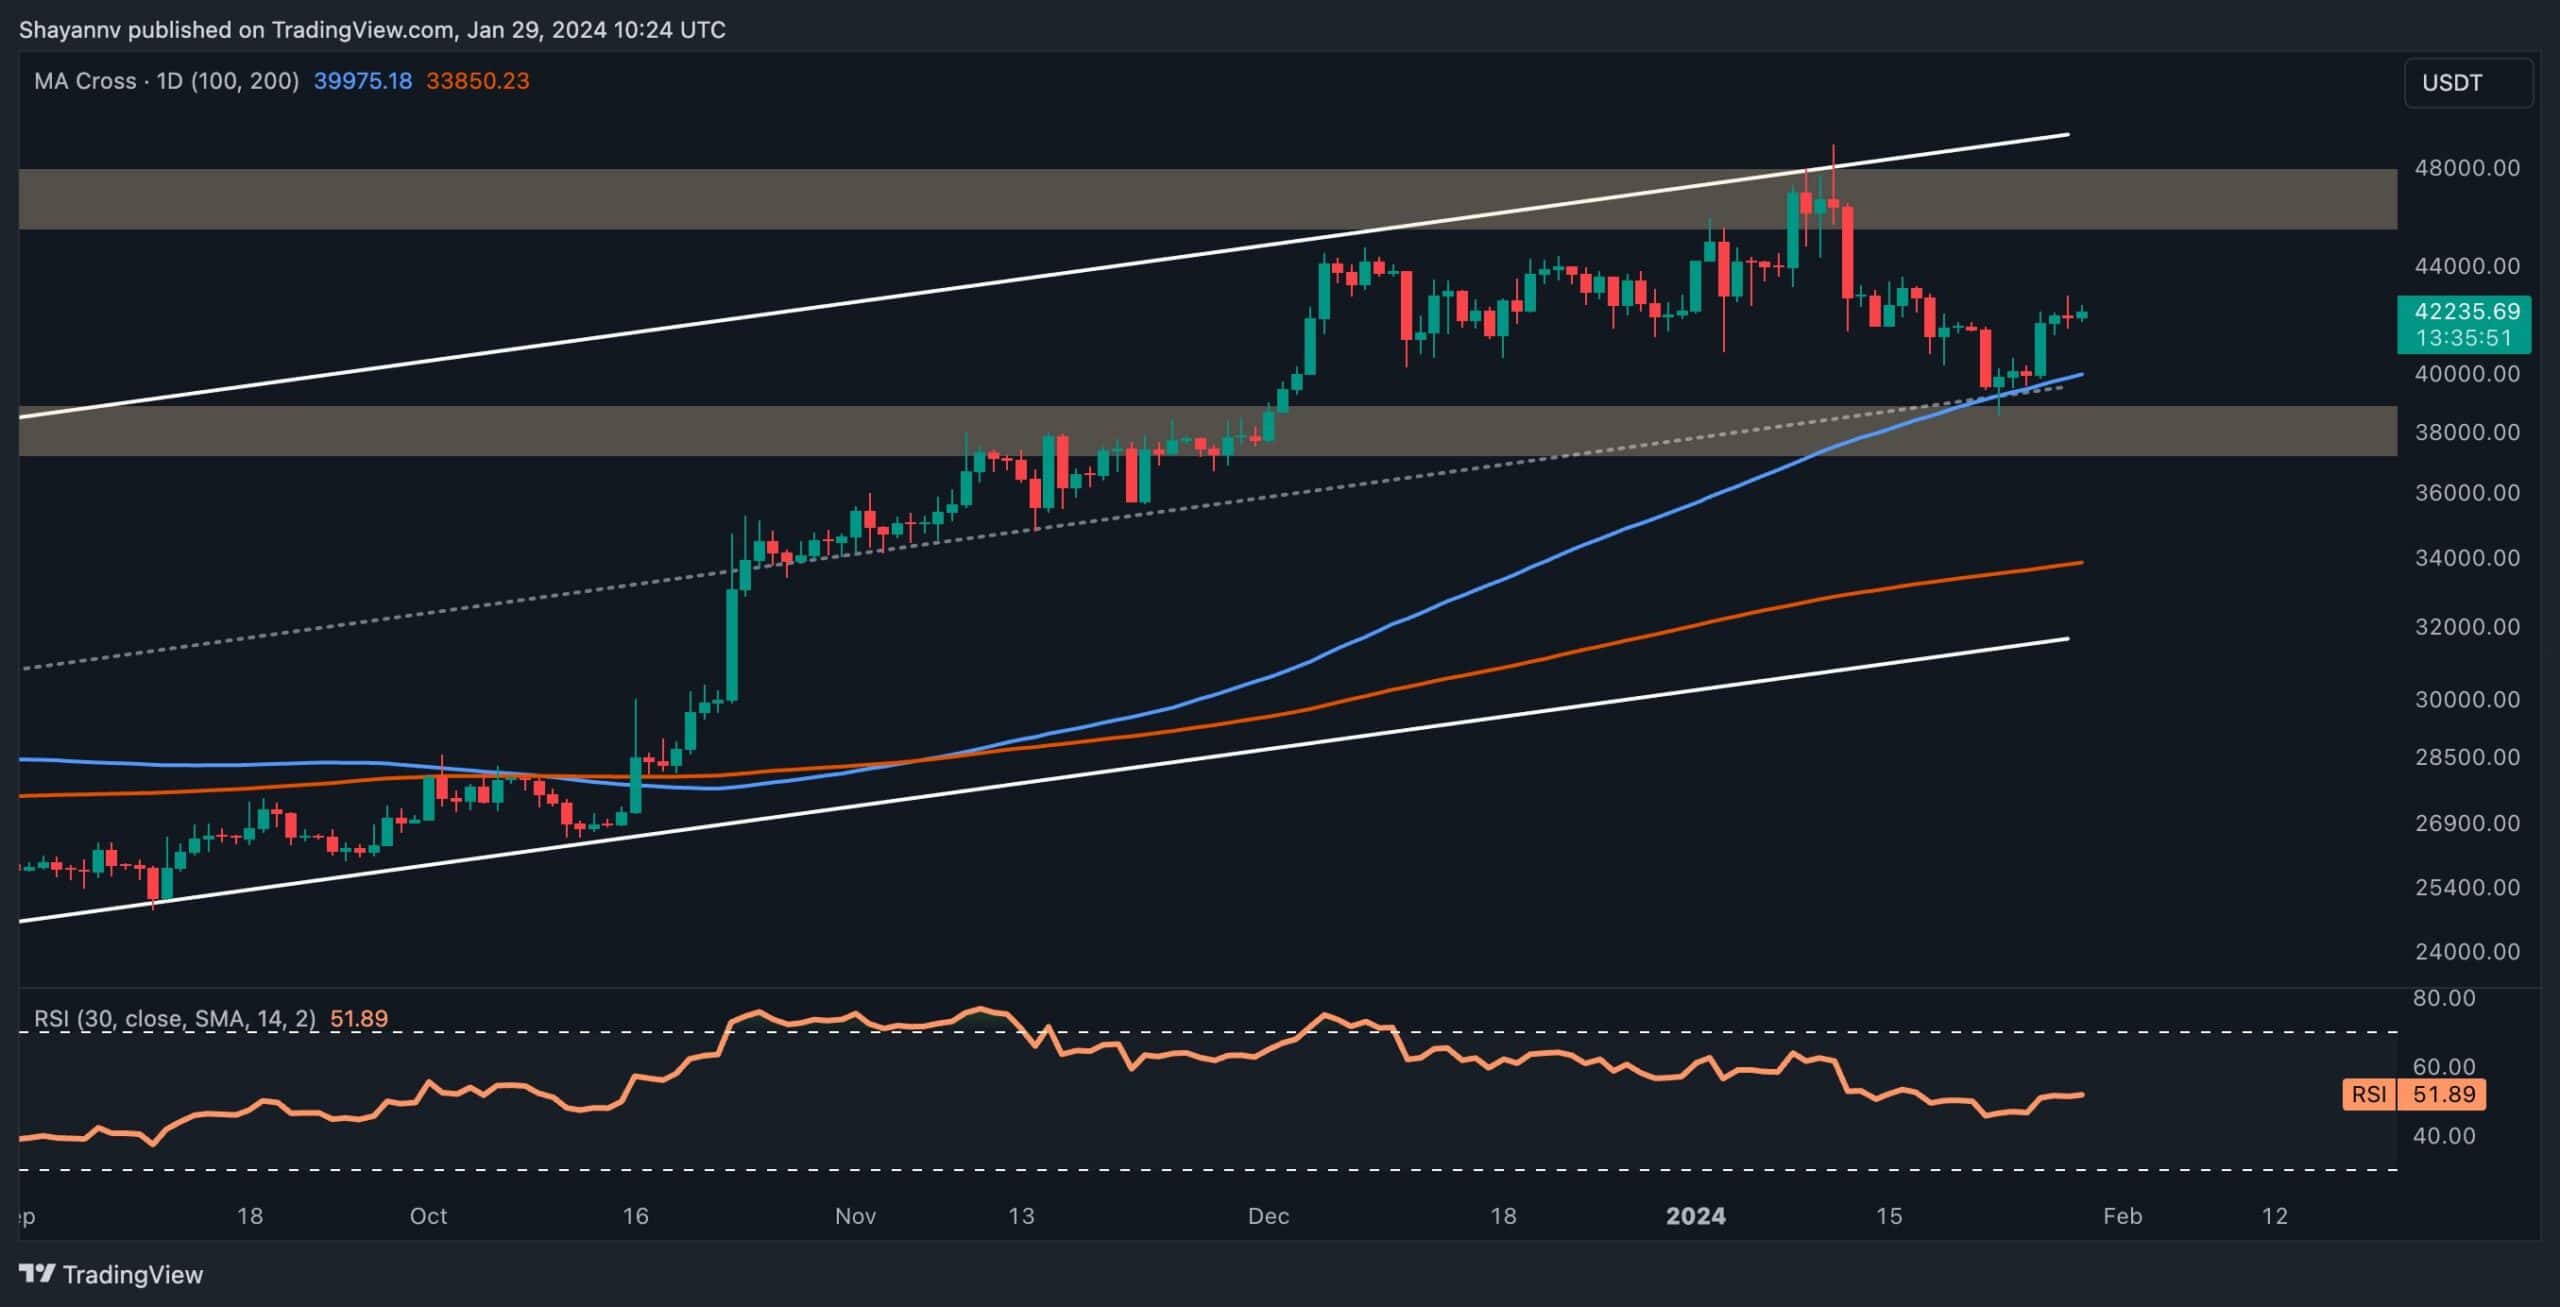
A thorough examination of the daily chart reveals a temporary halt in Bitcoin’s recent correction near a pivotal support range, indicated by the middle boundary of the ascending channel and the crucial 200-day moving average at $39K. This support prompted an uptick in demand, leading to a slight upward retracement.
With the strength of this support range and the possible presence of substantial demand, it is anticipated to act as a fortress for buyers in the mid-term, impeding further downward attempts by sellers. Consequently, the most plausible scenario for Bitcoin in the mid-term entails a period of sideways consolidation between the 200-day moving average and the notable resistance around $48K.
However, it’s essential to acknowledge the risk, as an unforeseen break below the 200-day moving average could trigger a cascade effect, propelling the price toward the substantial support of the 100-day moving average.
The 4-Hour Chart
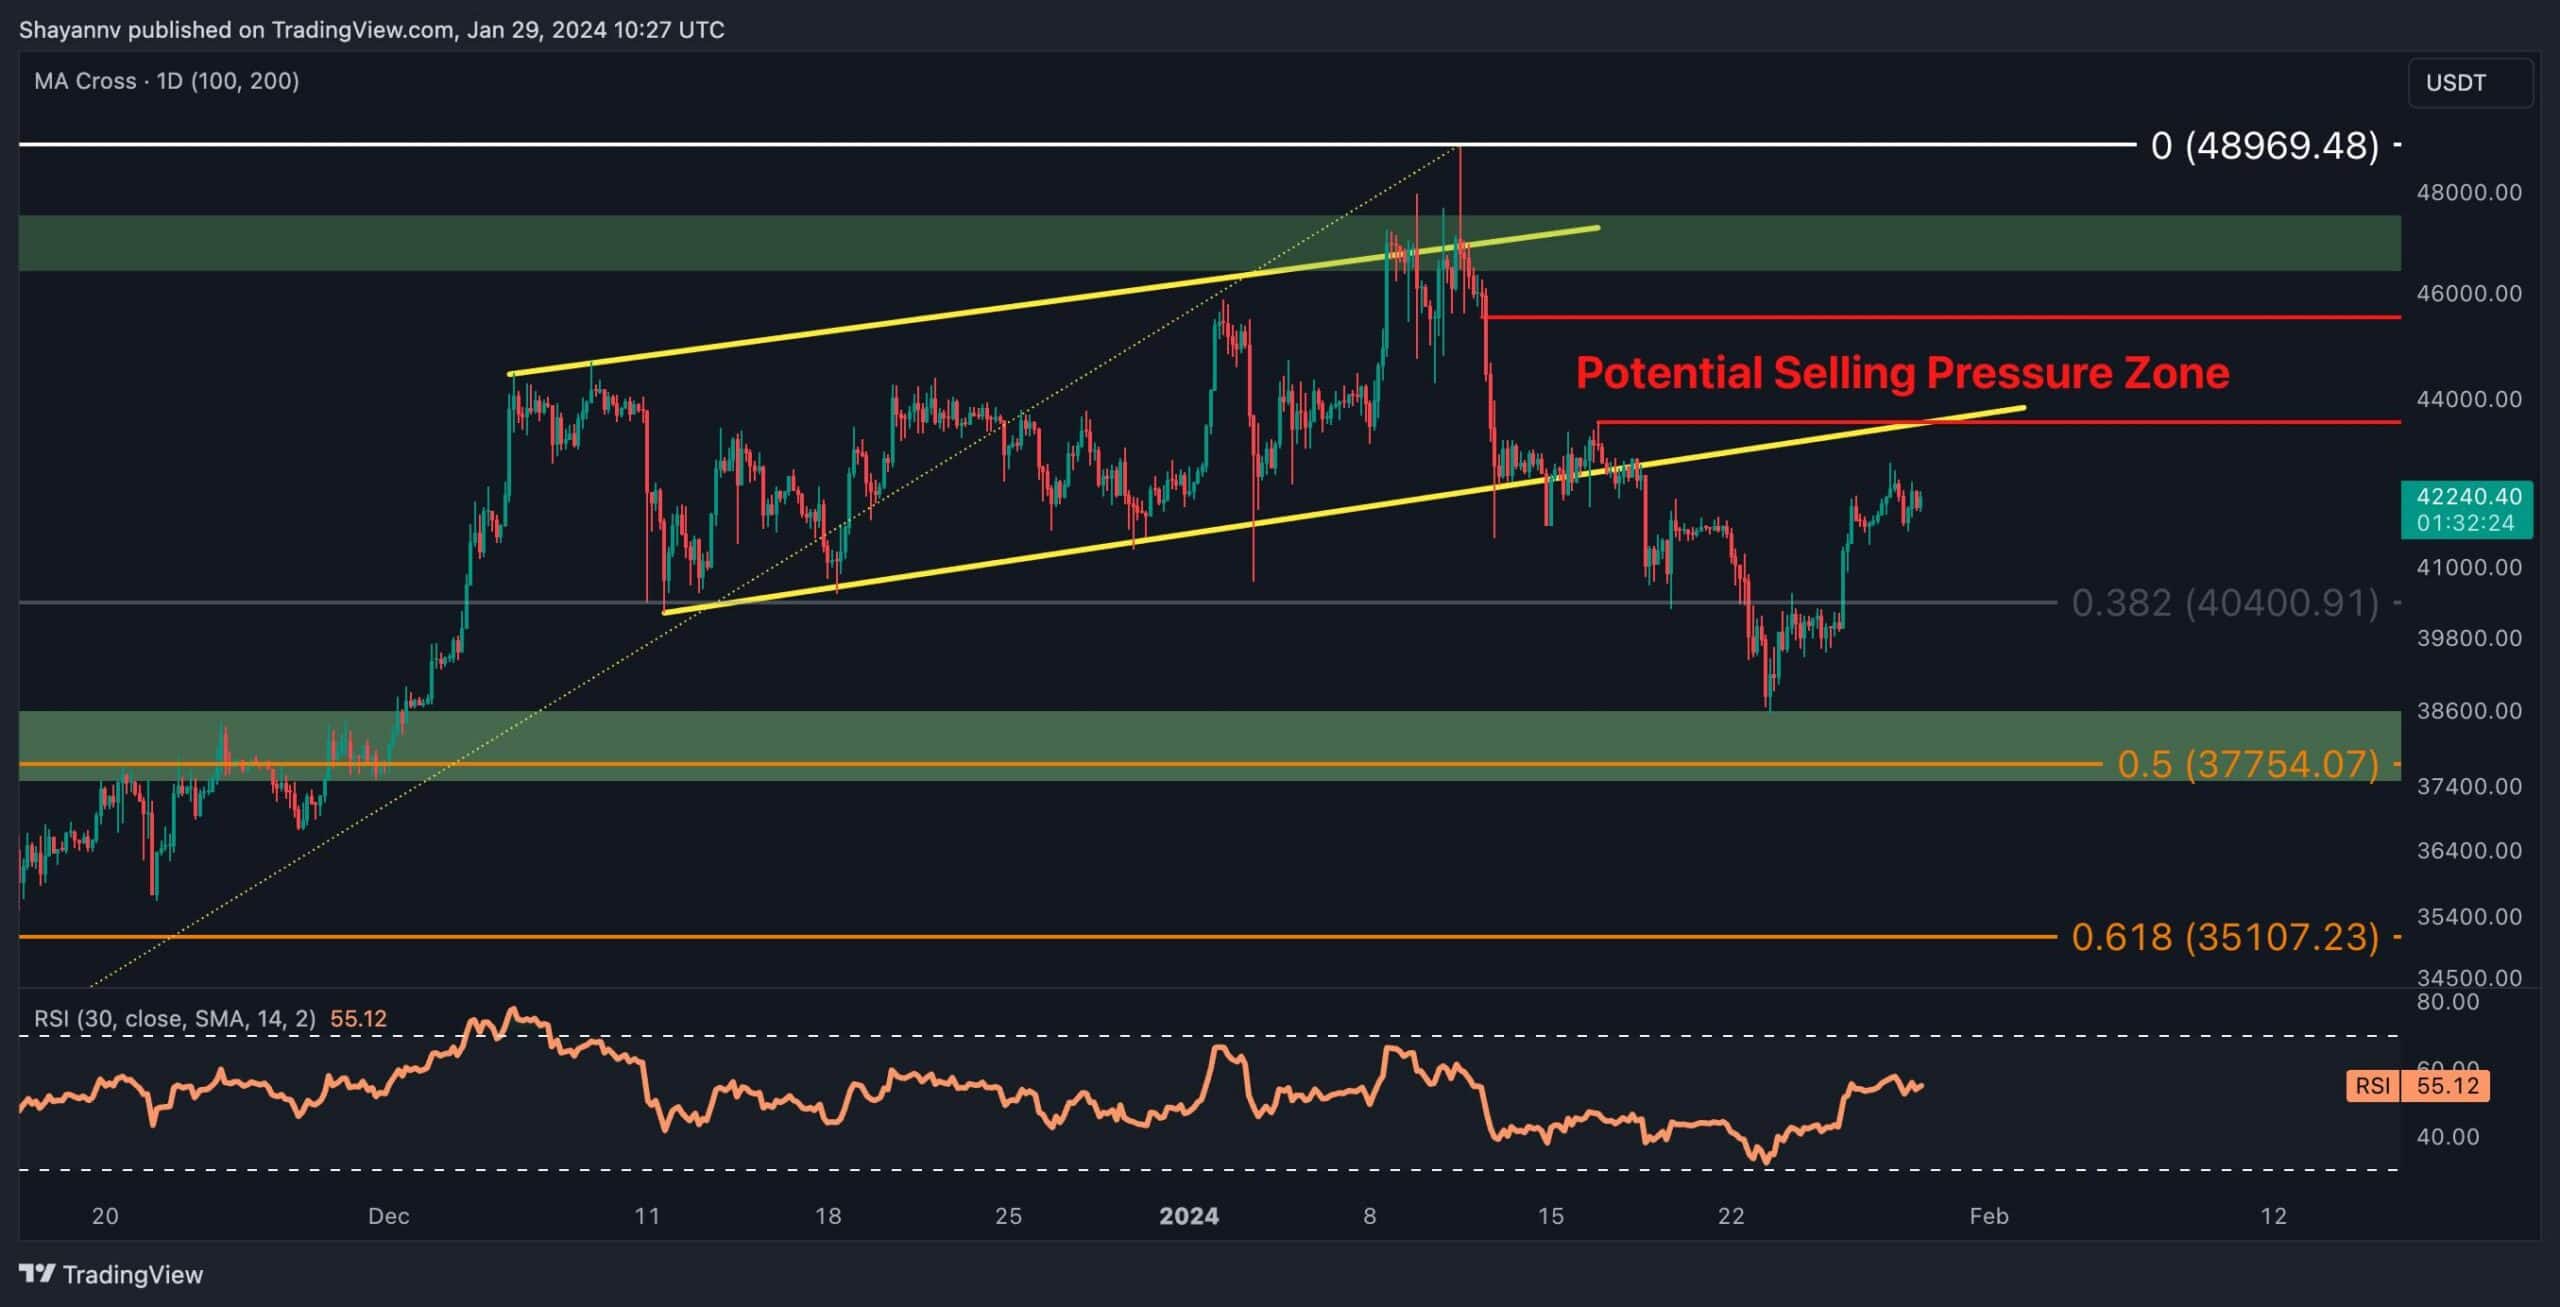
An analysis of the 4-hour chart reveals that the rejection from the $48K resistance zone has been temporarily halted, with the price finding support in a critical and substantial region. This zone encompasses the static support of $39K and aligns with the significant 0.5 level of Fibonacci retracement, creating a formidable barrier against downward attempts by sellers due to increased buying pressure.
As a result, the price has initiated a reversal, experiencing a bullish surge towards a substantial resistance zone. This resistance zone includes the lower boundary of the ascending flag, coinciding with a critical static resistance region ranging between $43,578 and $45,606.
Notably, this price range represents a bearish market inefficiency, termed as FVG. Therefore, Bitcoin’s upcoming price action around this crucial range is likely to determine its next course of action.
On-chain Analysis
By Shayan
Bitcoin’s recent rejection from the decisive $48K resistance level has triggered a downward trend, impacting investors and warranting a closer analysis of the associated effects.
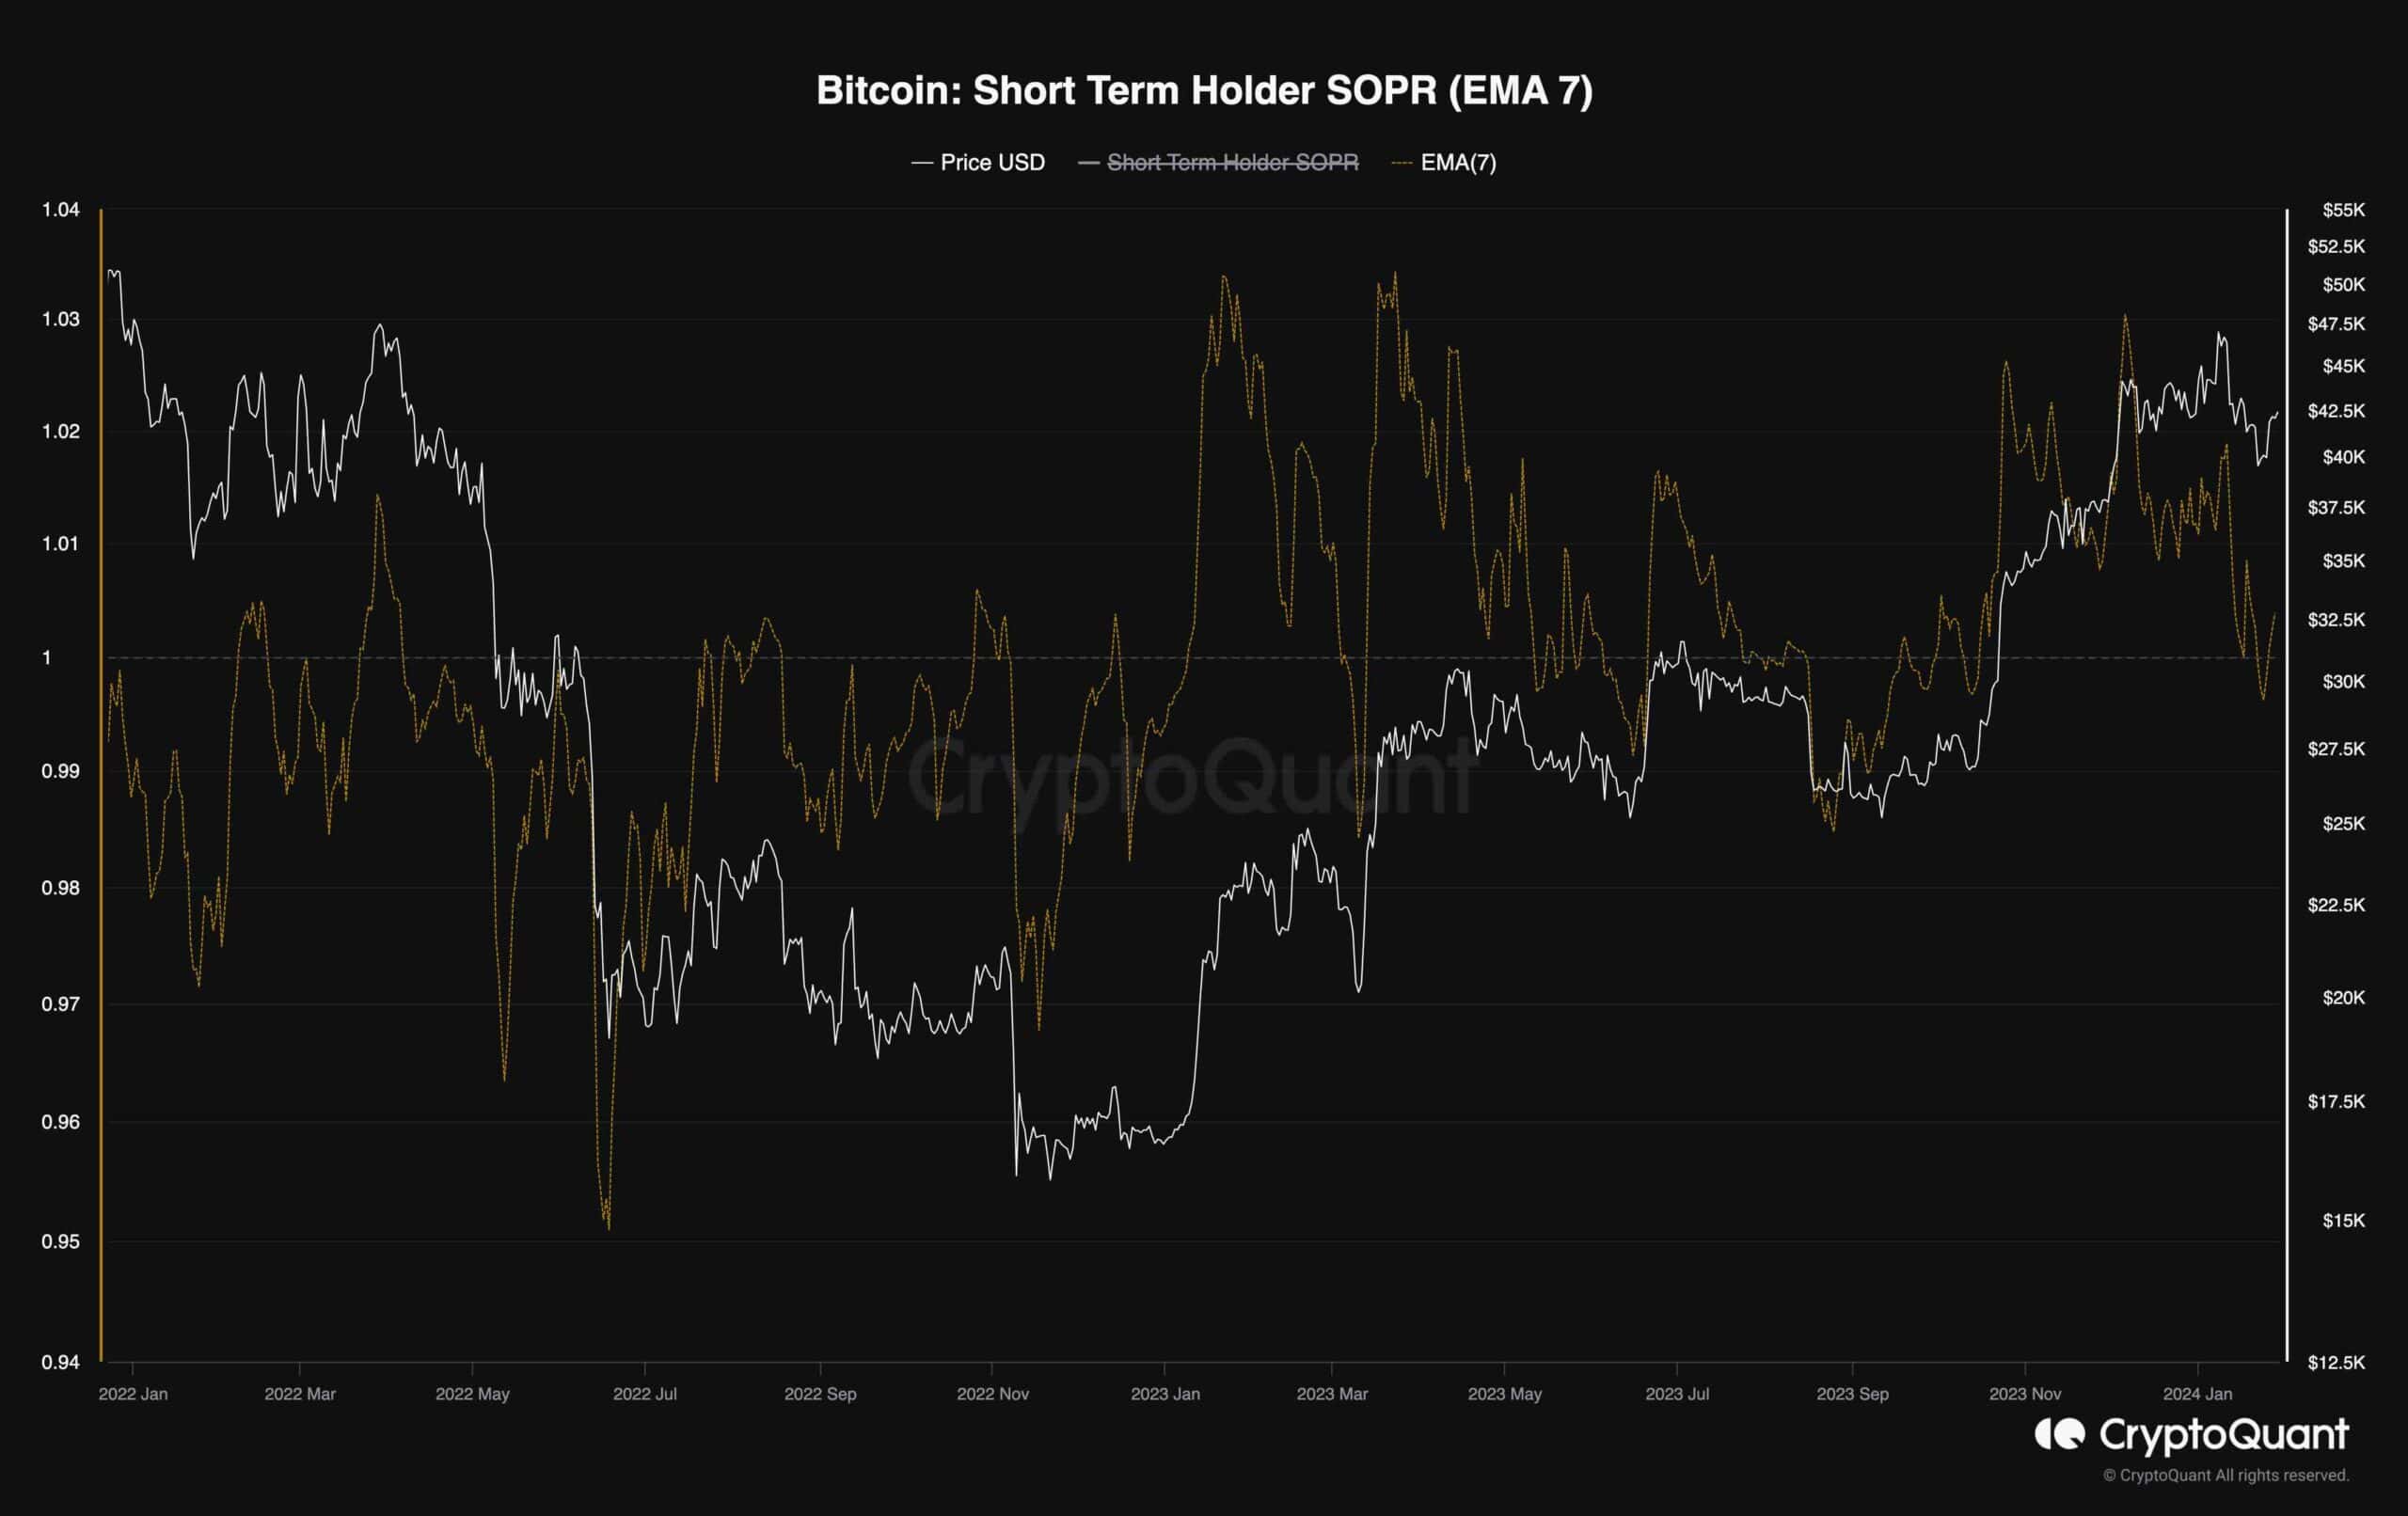
A key metric under scrutiny is the Short-Term Holder Spent Output Ratio, illustrated in the chart, with a 7-day exponential moving average applied for enhanced visualization. This metric assesses whether short-term holders—investors who acquired their coins in the past 6 months—are collectively selling at a profit or loss.
As depicted in the chart, the STH SOPR metric has recently fallen below 1, aligning with the decline in Bitcoin’s price. This suggests that short-term holders are selling their coins below their purchase cost, likely driven by fear and a desire to stem further losses.
Nevertheless, capitulation amid an uptrend is generally viewed positively, as weaker hands transfer their holdings to stronger hands. However, it becomes imperative to monitor whether this trend in short-term holders selling at a loss continues, as sustained selling pressure may lead to an overwhelming excess supply, potentially exerting further downward pressure on the market.