Ethereum’s price has been dropping over the last couple of weeks following a decisive rejection from a significant resistance level. Yet, there are several support levels nearby. Technical Analysis By TradingRage The Daily Chart On the daily chart, the price has been forming a large ascending channel over the last year. It has recently tested the higher boundary of the channel, which coincided with the ,750 resistance level and failed to break above. The resulting rejection has been gruesome, and the market has even fallen below the ,400 support zone. With the Relative Strength Index showing values below 50%, the price seems likely to decline toward the 200-day moving average, located around the ,000 level. Source: TradingViewThe 4-Hour Chart The 4-hour timeframe
Topics:
CryptoVizArt considers the following as important: ETH Analysis, ETHBTC, Ethereum (ETH) Price, ethusd
This could be interesting, too:
Mandy Williams writes Ethereum Derivatives Metrics Signal Modest Downside Tail Risk Ahead: Nansen
Jordan Lyanchev writes Weekly Bitcoin, Ethereum ETF Recap: Light at the End of the Tunnel for BTC
CryptoVizArt writes Will Weak Momentum Drive ETH to .5K? (Ethereum Price Analysis)
Jordan Lyanchev writes Bybit Hack Fallout: Arthur Hayes, Samson Mow Push for Ethereum Rollback
Ethereum’s price has been dropping over the last couple of weeks following a decisive rejection from a significant resistance level. Yet, there are several support levels nearby.
Technical Analysis
By TradingRage
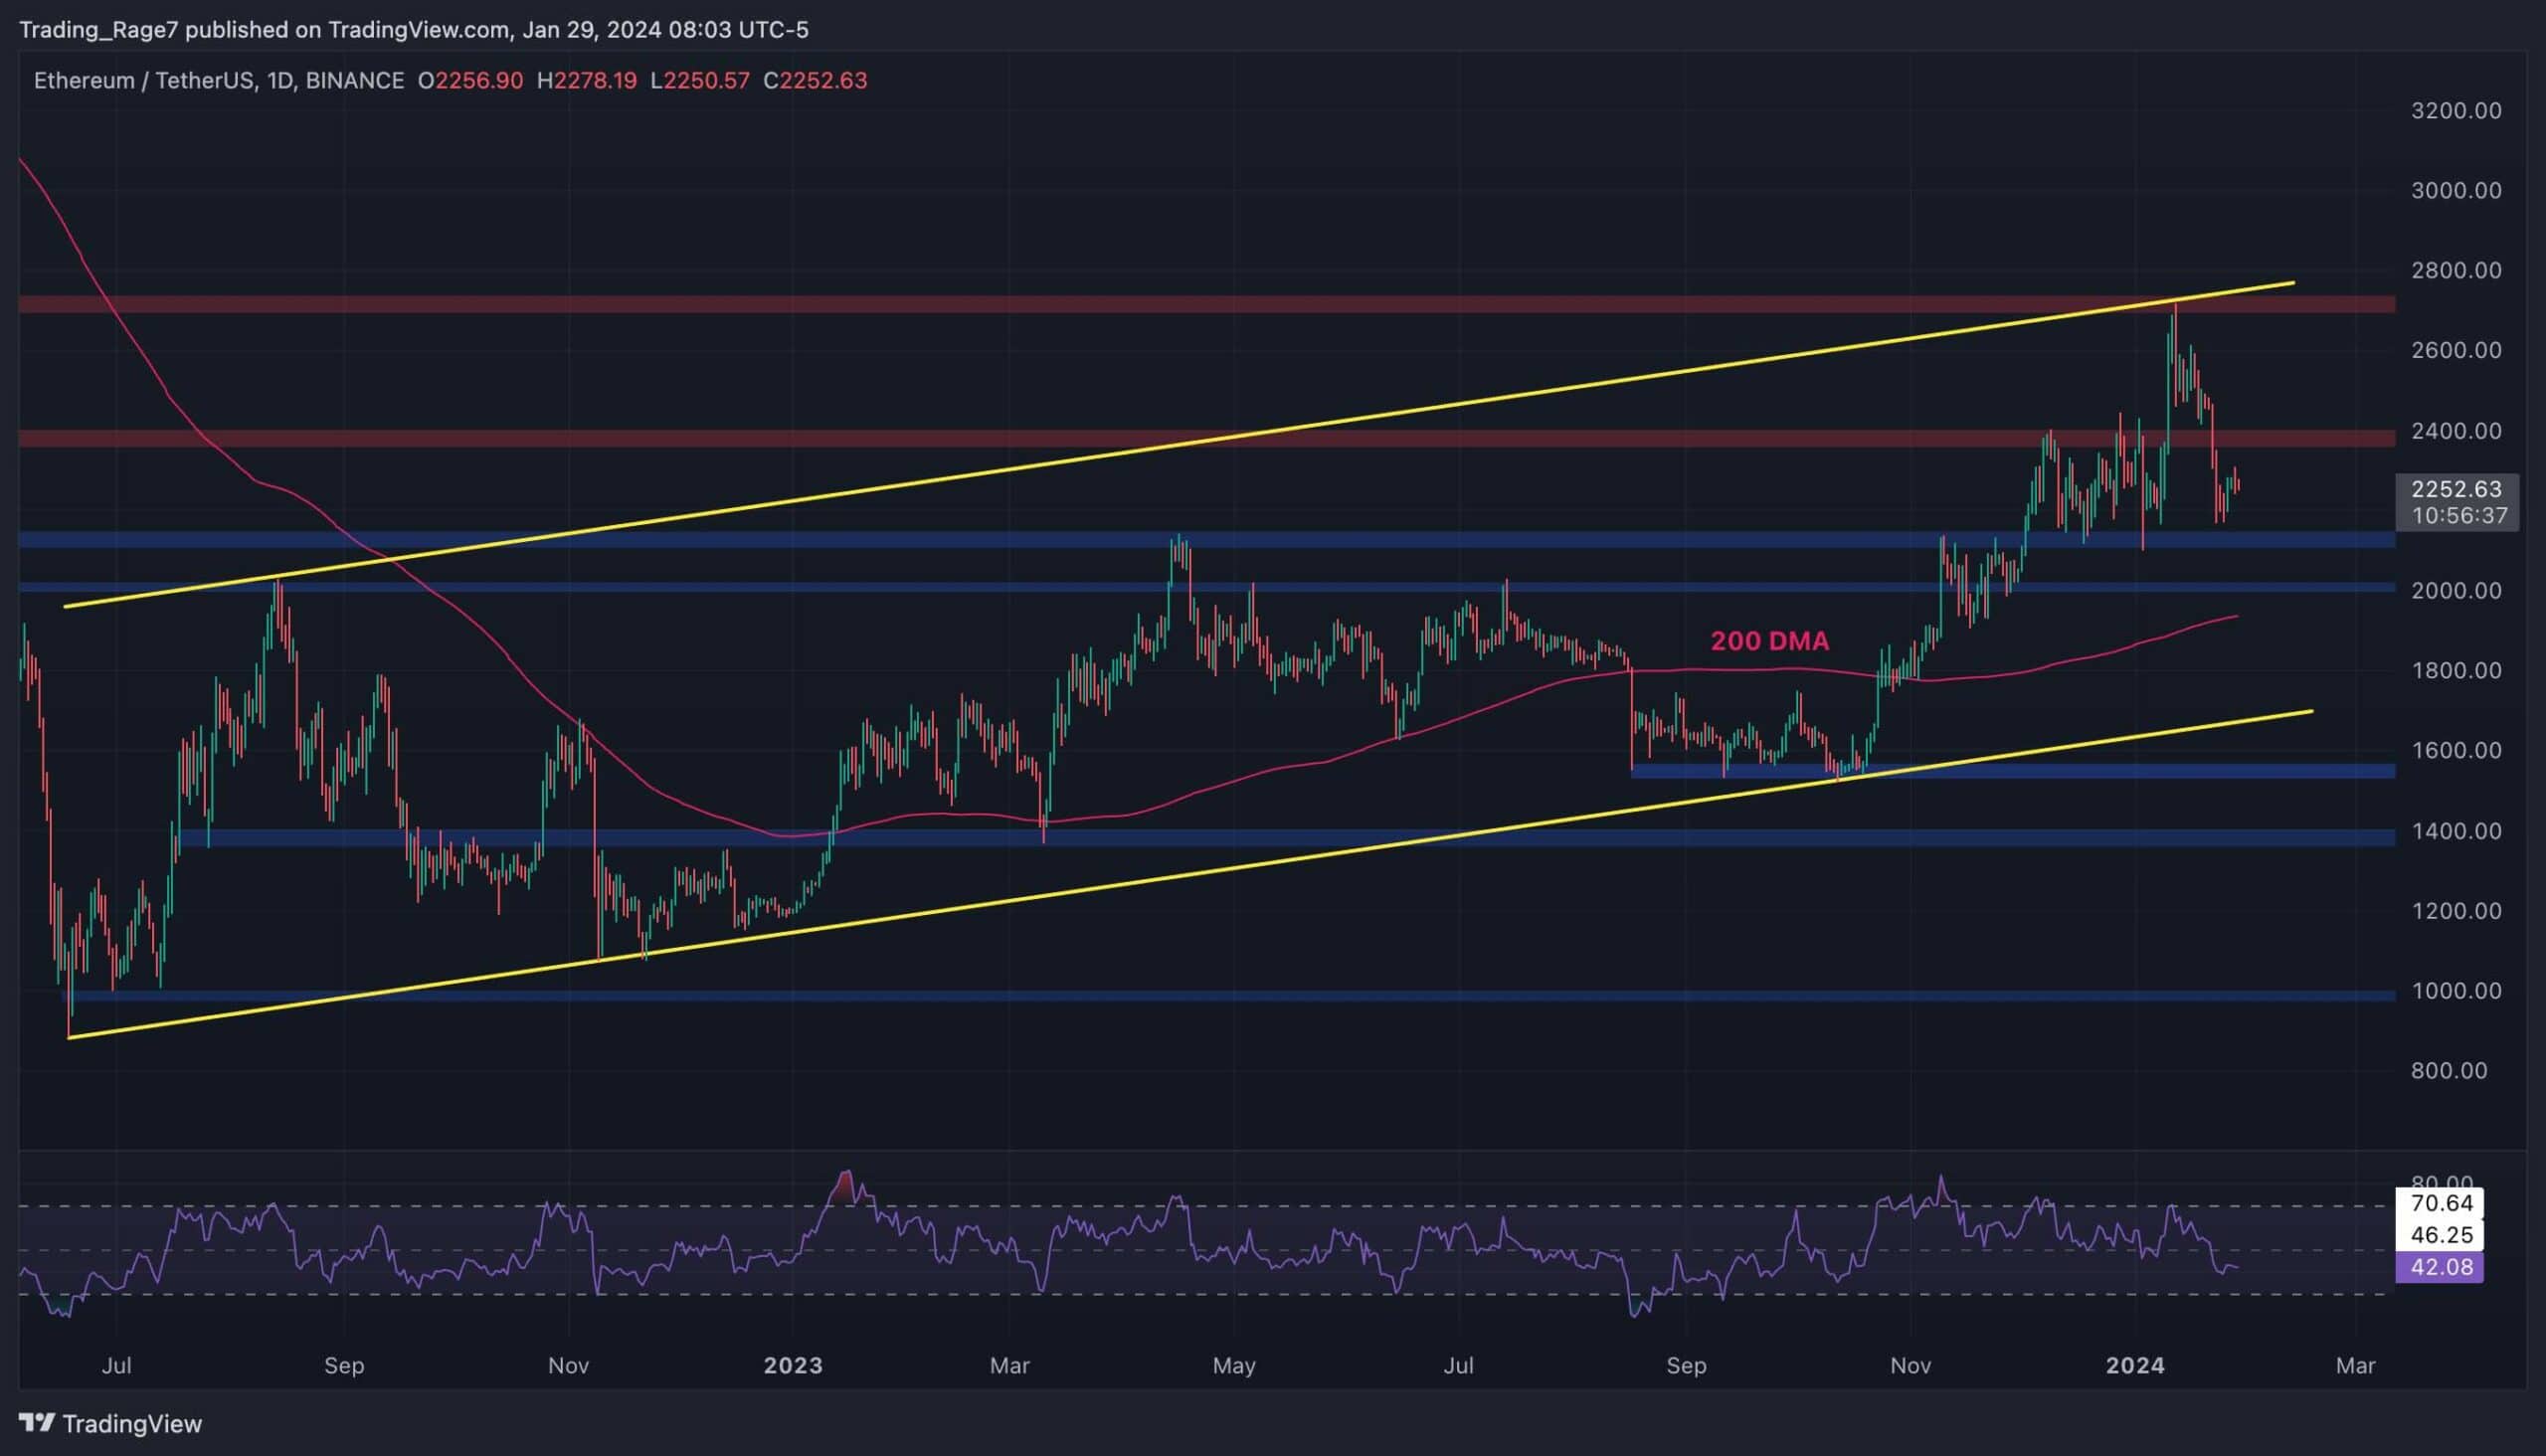
The Daily Chart
On the daily chart, the price has been forming a large ascending channel over the last year. It has recently tested the higher boundary of the channel, which coincided with the $2,750 resistance level and failed to break above. The resulting rejection has been gruesome, and the market has even fallen below the $2,400 support zone.
With the Relative Strength Index showing values below 50%, the price seems likely to decline toward the 200-day moving average, located around the $2,000 level.
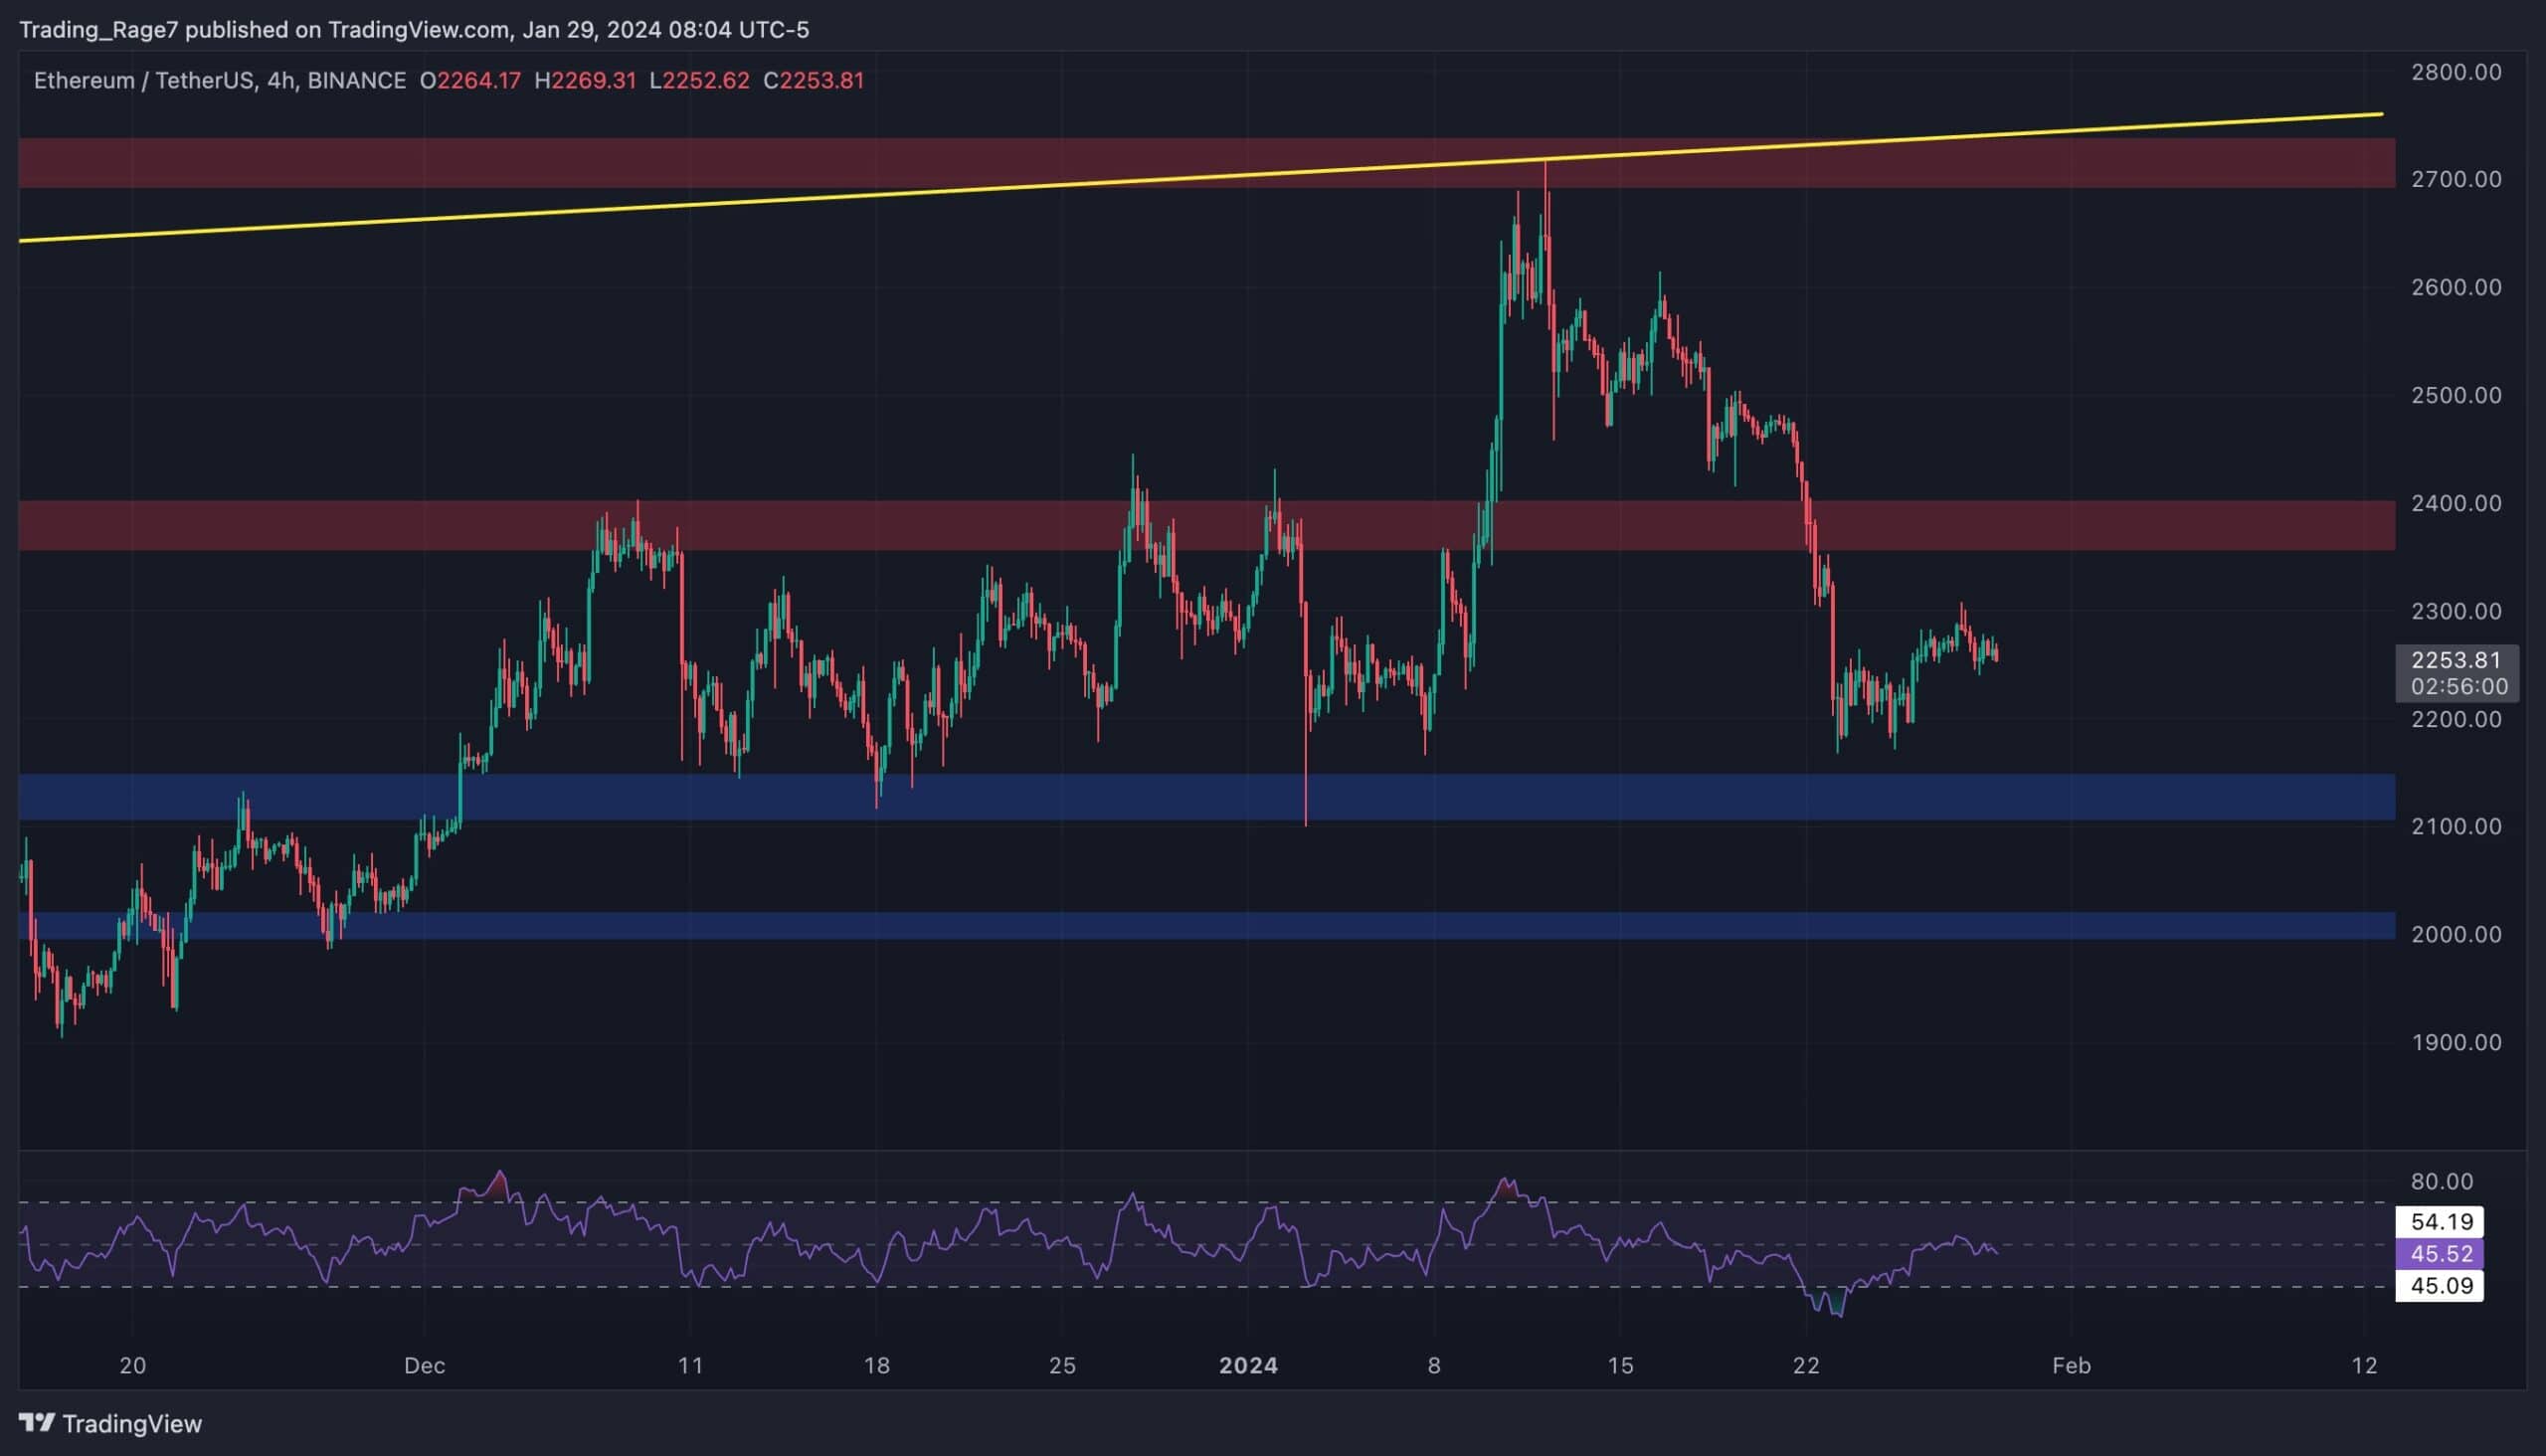
The 4-Hour Chart
The 4-hour timeframe does not have much insight to offer. The market is currently consolidating between the $2,100 and $2,400 levels. In case of a breakout to the upside, the higher boundary of the large channel would be the probable target.
On the other hand, a breakdown of the $2,100 level would likely result in a drop toward $2,000 and even below. Judging by the signs witnessed on the daily chart, further downside seems more probable.
Sentiment Analysis
By TradingRage
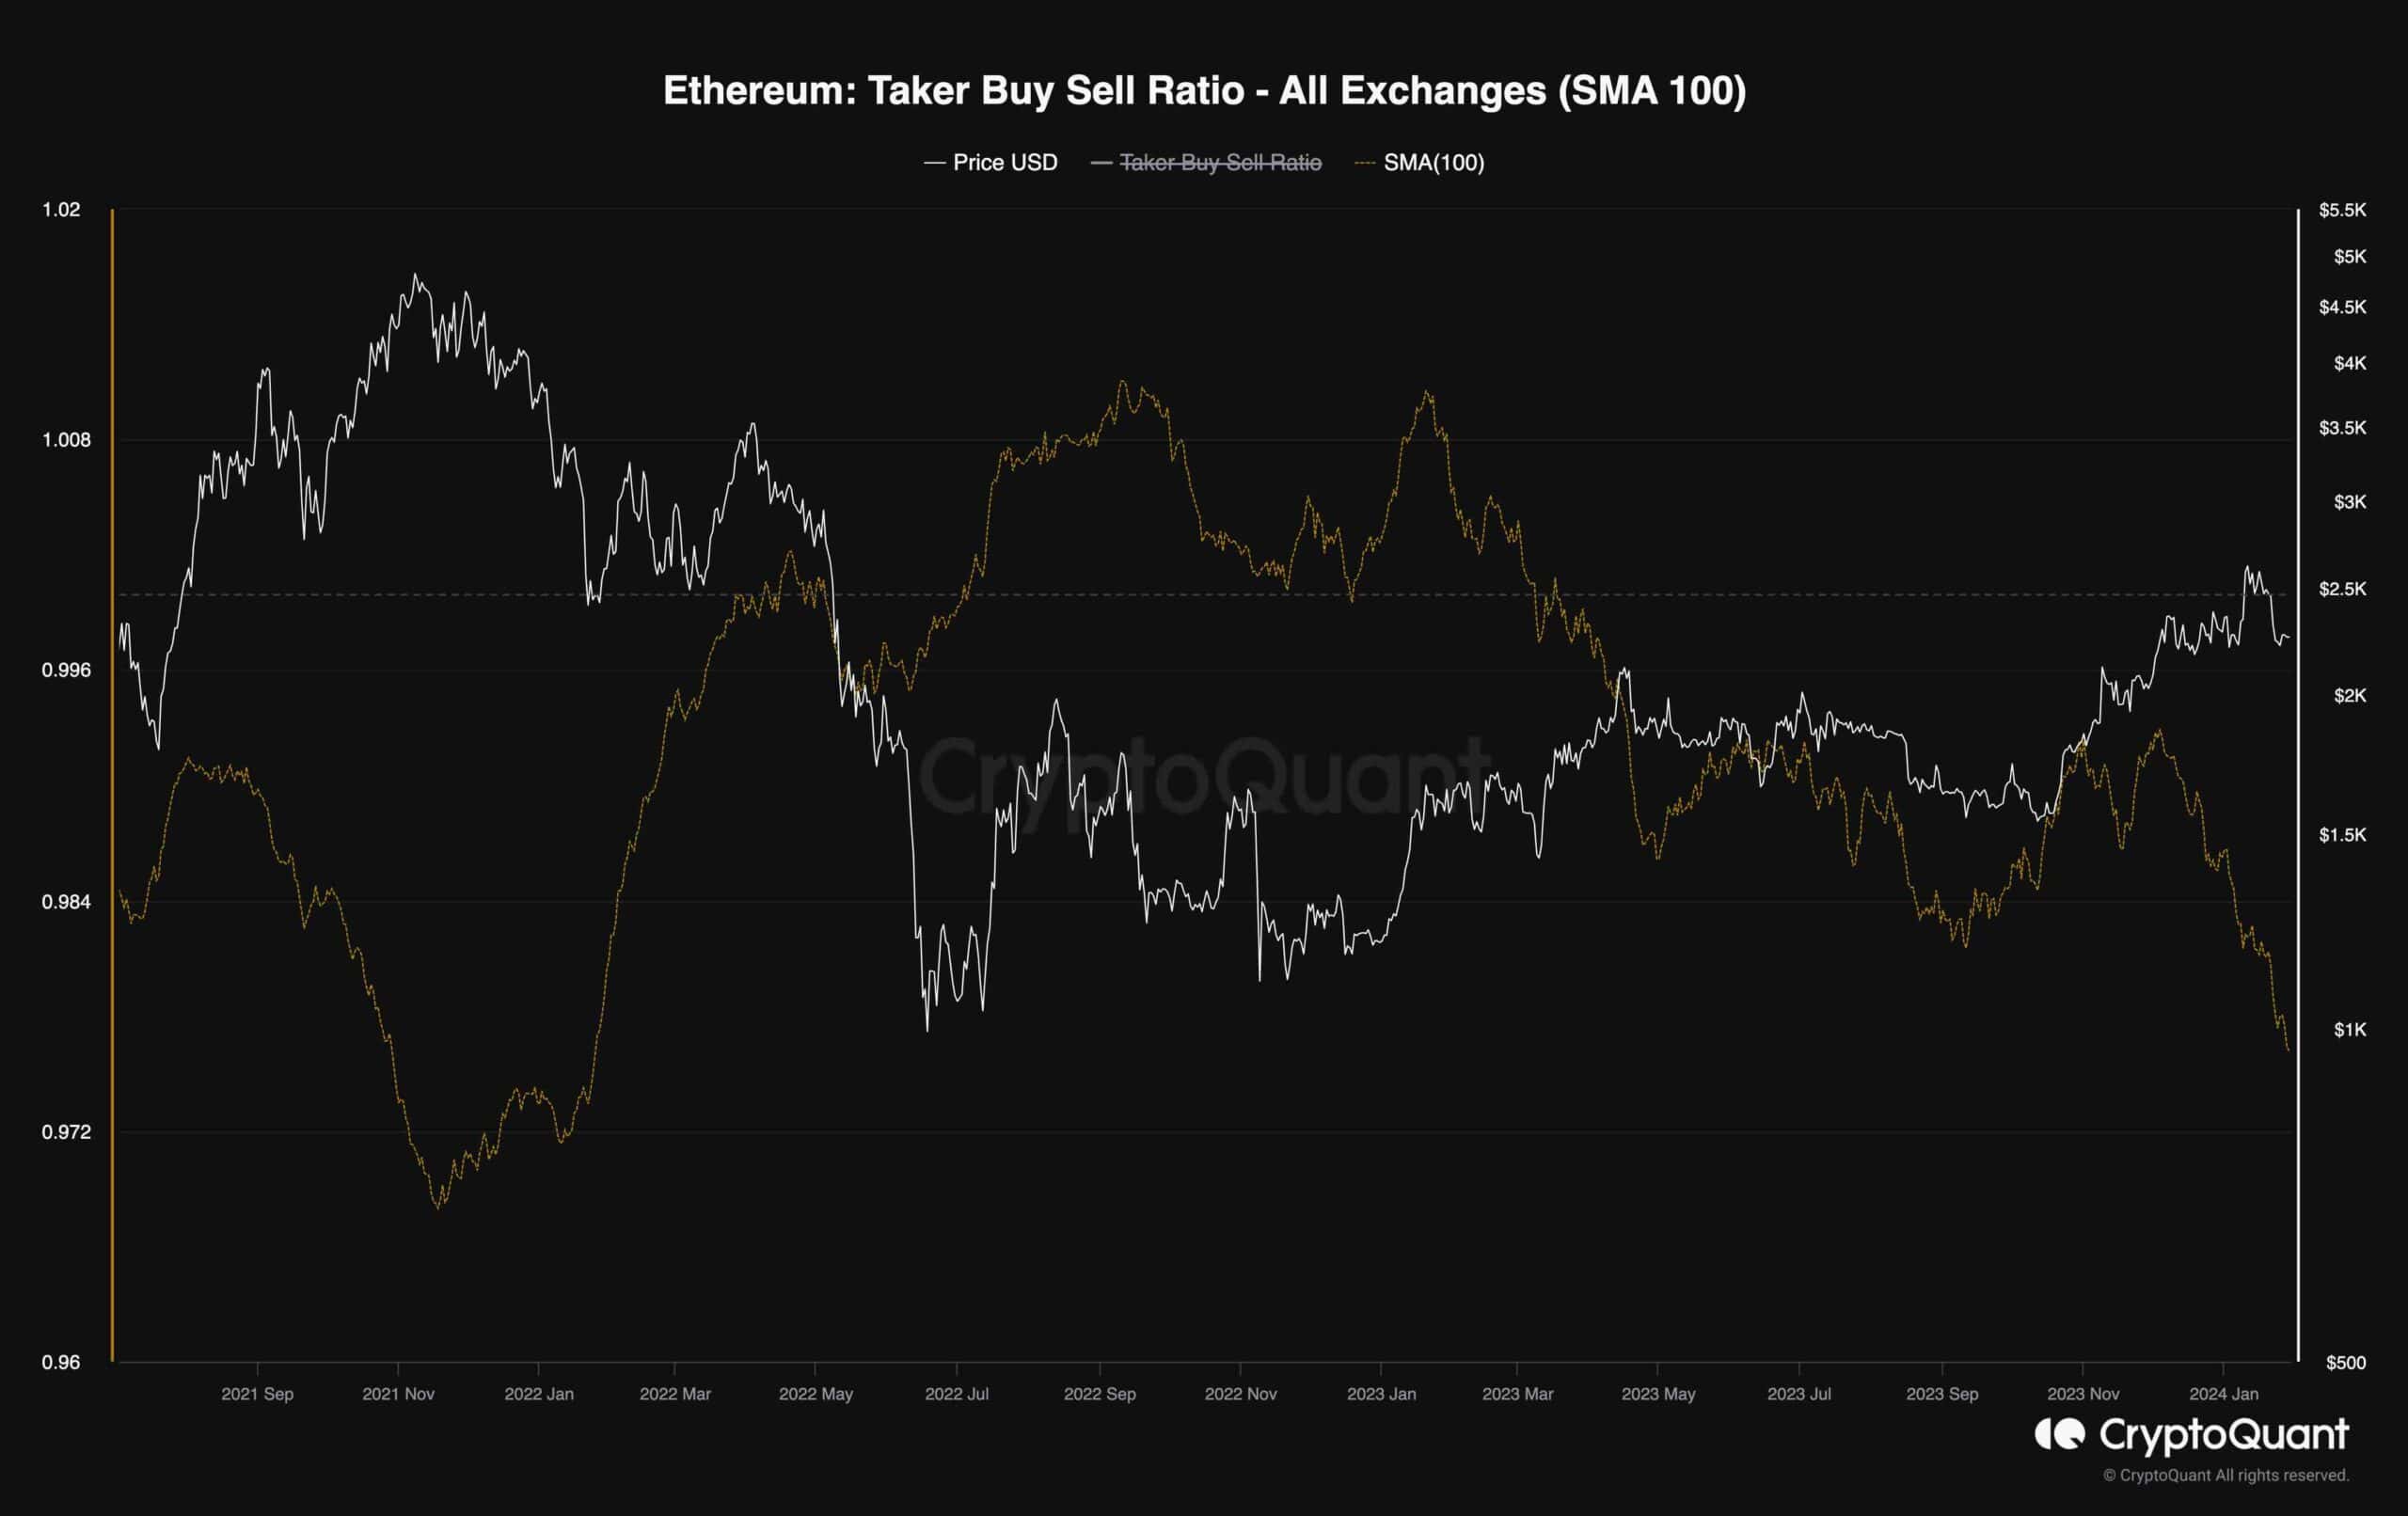
Ethereum Taker Buy Sell Ratio
With Ethereum’s price failing to climb above the $2,500 level, investors might be curious about how the futures market traders are behaving.
This chart presents the 100-day moving average of the Taker Buy Sell Ratio. This metric measures the ratio of aggressiveness of buyers compared to sellers. Values above one indicate buyers’ dominance, while values below one are associated with aggressive selling pressure.
As the chart demonstrates, the metric has not recovered above one and has been dropping aggressively over the last few weeks. The ratio approaches values previously seen during the all-time high range in late 2021. This is not a positive sign by any means, and the trend might be about to shift bearish if things remain the same.