Bitcoin price started a strong increase above the ,000 zone against the US Dollar. The price is now trading above ,500 and the 55 simple moving average (4 hours). There is a key bullish trend line forming with support at ,400 on the 4-hour chart of the BTC/USD pair (data feed from Coinbase). The pair could continue to rise if it stays above the ,000 support zone. Bitcoin price is showing positive signs above ,000 against the US Dollar. BTC might correct lower, but dips could be limited below the ,000 zone. Bitcoin Price Analysis Bitcoin price started a strong increase above the ,500 resistance zone. The price remained stable above the ,000 level and traded in a positive zone. There was a clear move above the ,200 level and the 55
Topics:
Aayush Jindal considers the following as important: Bitcoin News, BTC, News, Trading
This could be interesting, too:
Bilal Hassan writes DekaBank Partners with Boerse Stuttgart for Crypto Trading
Bilal Hassan writes Ukraine Eyes Crypto Tax to Support State Budget and Defense
Emily John writes GRVT Launches Alertatron Trading Event and Airdrop Before TGE
Bilal Hassan writes Coinbase Expands in Nigeria with Onboard Global Partnership
- Bitcoin price started a strong increase above the $50,000 zone against the US Dollar.
- The price is now trading above $50,500 and the 55 simple moving average (4 hours).
- There is a key bullish trend line forming with support at $51,400 on the 4-hour chart of the BTC/USD pair (data feed from Coinbase).
- The pair could continue to rise if it stays above the $51,000 support zone.
Bitcoin price is showing positive signs above $50,000 against the US Dollar. BTC might correct lower, but dips could be limited below the $51,000 zone.
Bitcoin Price Analysis
Bitcoin price started a strong increase above the $48,500 resistance zone. The price remained stable above the $50,000 level and traded in a positive zone.
There was a clear move above the $51,200 level and the 55 simple moving average (4 hours). The price even rallied above the $52,000 resistance zone. However, the price seems to be struggling near the $53,000 zone. A high was formed near $52,890 and the price is now consolidating gains.
The price traded below $52,000 but it is still above the 23.6% Fib retracement level of the upward move from the $46,889 swing low to the $52,890 high.
Bitcoin is now trading above $51,200 and the 55 simple moving average (4 hours). Immediate resistance on the upside is near the $52,500 level. The first major resistance is near the $53,000 level, above which the price could rise toward the $55,000 zone.
Any more gains might send the price toward the $56,500 zone. If there is no upside break, the price might start a downside correction below $51,500. There is also a key bullish trend line forming with support at $51,400 on the 4-hour chart of the BTC/USD pair.
The next key support is near the $50,000 level or the 50% Fib retracement level of the upward move from the $46,889 swing low to the $52,890 high. Any more losses might call for a move toward the $48,300 level.
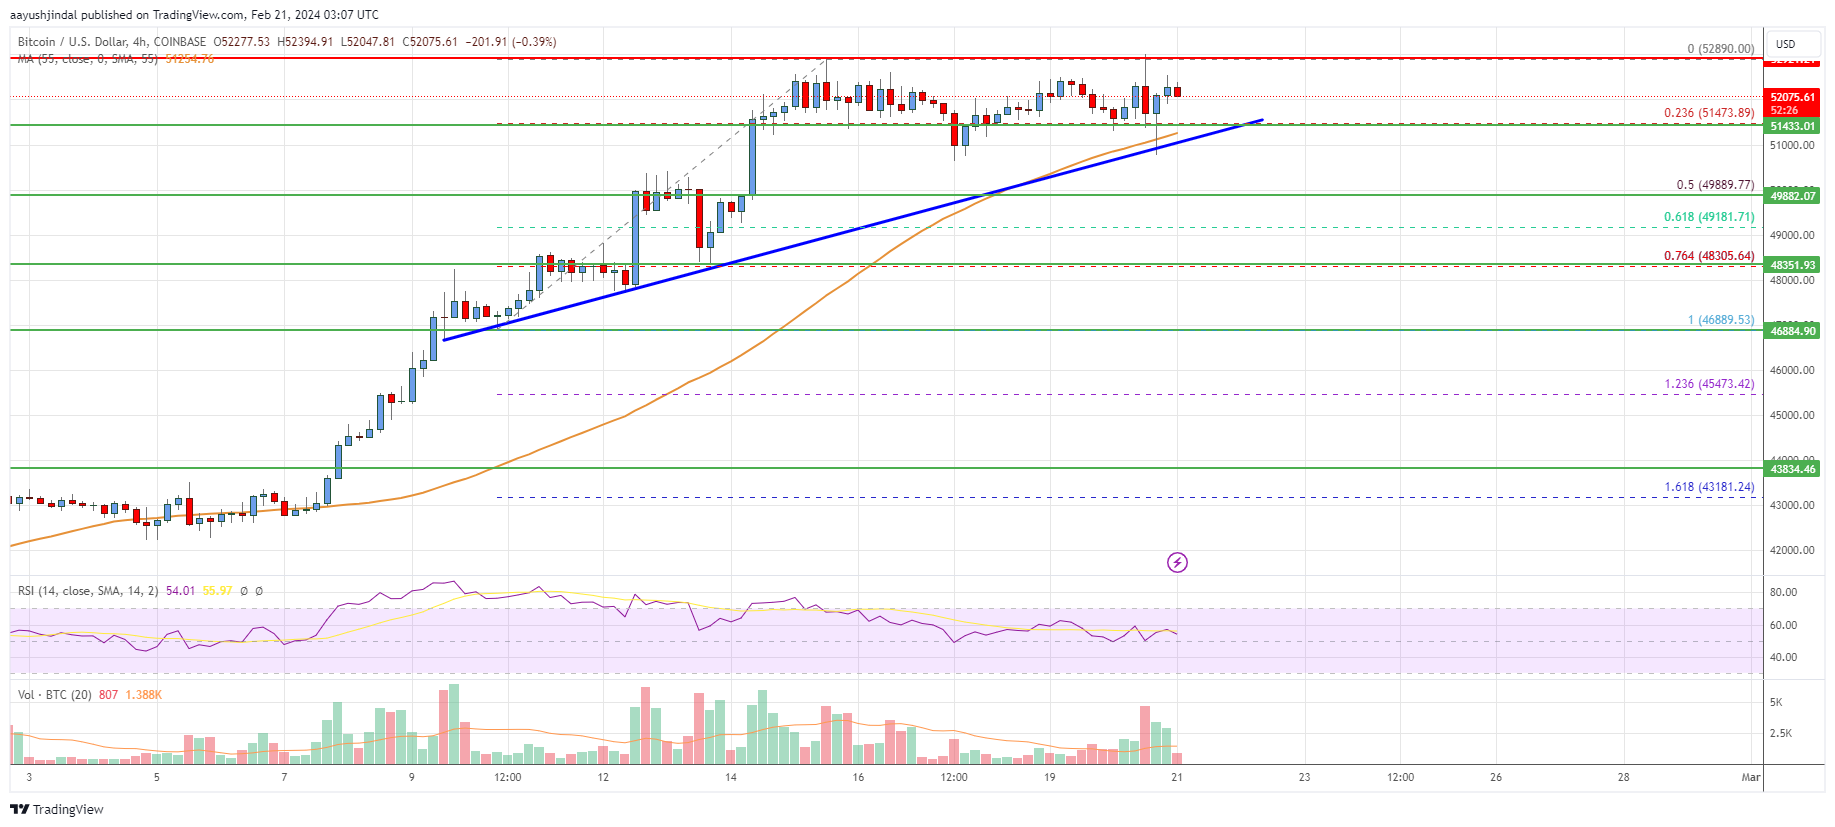
Looking at the chart, Bitcoin price is trading above $50,000 and the 55 simple moving average (4 hours). Overall, the price could continue to rise if it stays above the $51,000 support zone.
Technical Indicators
4 hours MACD – The MACD is now gaining momentum in the bullish zone.
4 hours RSI (Relative Strength Index) – The RSI is now above the 50 level.
Key Support Levels – $51,500 and $50,000.
Key Resistance Levels – $52,500, $53,000, and $55,000.