Bitcoin price started a downside correction from the new all-time high at ,324 against the US Dollar. The price is now trading above ,000 and the 55 simple moving average (4 hours). There was a break below a key rising channel with support at ,400 on the 4-hour chart of the BTC/USD pair (data feed from Coinbase). The pair could start a fresh increase if it stays above the ,000 support zone. Bitcoin price is correcting lower below ,000 against the US Dollar. BTC might eye another increase if the bulls remain active above the ,500 zone. Bitcoin Price Analysis Bitcoin price extended its increase above the ,000 level and rallied toward the ,000 resistance zone. A new all-time high was formed near ,324 before the price started a downside
Topics:
Aayush Jindal considers the following as important: Altcoin News, BTC, News, Trading
This could be interesting, too:
Emily John writes GRVT Launches Alertatron Trading Event and Airdrop Before TGE
Bilal Hassan writes Coinbase Expands in Nigeria with Onboard Global Partnership
Bitcoin Schweiz News writes Bitcoin für die Ewigkeit: Warum das letzte BTC-Mining erst 2140 endet
Guest User writes XRP Price Faces Potential Drop: Leading KOL Warns of Imminent Correction with TD Sequential Sell Signal!
- Bitcoin price started a downside correction from the new all-time high at $69,324 against the US Dollar.
- The price is now trading above $60,000 and the 55 simple moving average (4 hours).
- There was a break below a key rising channel with support at $64,400 on the 4-hour chart of the BTC/USD pair (data feed from Coinbase).
- The pair could start a fresh increase if it stays above the $60,000 support zone.
Bitcoin price is correcting lower below $65,000 against the US Dollar. BTC might eye another increase if the bulls remain active above the $60,500 zone.
Bitcoin Price Analysis
Bitcoin price extended its increase above the $66,000 level and rallied toward the $70,000 resistance zone. A new all-time high was formed near $69,324 before the price started a downside correction. There was a clear move below the $66,500 and $65,000 levels.
The bears were able to push the price below the 23.6% Fib retracement level of the upward move from the $50,901 swing low to the $69,324 high. There was a break below a key rising channel with support at $64,400 on the 4-hour chart of the BTC/USD pair.
The price even spiked below $62,000. However, the bulls were active near the 50% Fib retracement level of the upward move from the $50,901 swing low to the $69,324 high.
Bitcoin is now trading above $60,000 and the 55 simple moving average (4 hours). Immediate resistance on the upside is near the $64,000 level. The next major resistance might be near the $65,500 zone. A clear move above the $65,500 level might send the price toward $67,500, above which the price might rise toward the $68,000 level. Any more gains might push the price toward the $70,000 zone.
If there is no upside break, the price might continue to decline below the $62,200 level. The first major support is $61,000. The next key support is near the $60,200 level, below which the price might accelerate lower. In the stated case, the price could decline toward the $58,000 level. Any more losses might send the price toward the $55,500 level.
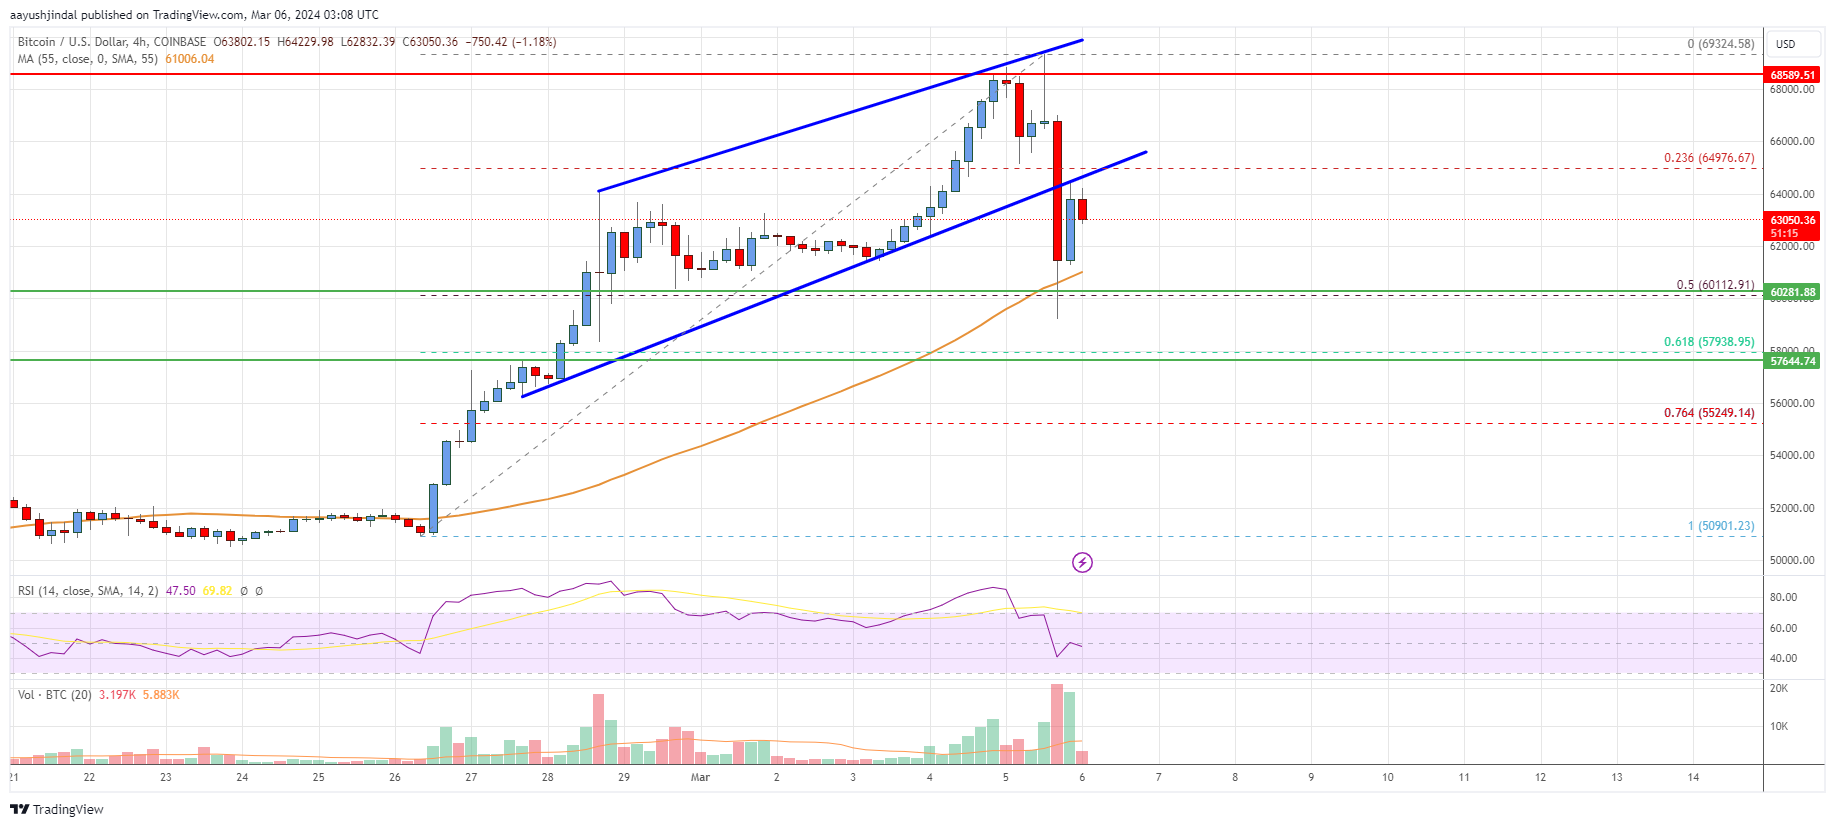
Looking at the chart, Bitcoin price is clearly trading above $60,500 and the 55 simple moving average (4 hours). Overall, the price could start a fresh increase if it stays above the $60,000 support zone.
Technical Indicators
4 hours MACD – The MACD is now losing momentum in the bullish zone.
4 hours RSI (Relative Strength Index) – The RSI is now below the 50 level.
Key Support Levels – $62,000 and $60,000.
Key Resistance Levels – $64,000, $65,500, and $67,500.