ADA price started a downside correction from the %excerpt%.538 zone against the US Dollar. The price is now trading below %excerpt%.52 and the 55 simple moving average (4 hours). There was a break below a major bullish trend line with support near %excerpt%.500 on the 4-hour chart (data feed via Coinbase). The price could start a fresh increase if it clears the %excerpt%.510 and %excerpt%.520 resistance levels. Cardano’s price is consolidating above %excerpt%.4650 against the US Dollar, like Bitcoin. ADA price could resume its rally if there is a clear move above the %excerpt%.520 resistance. Cardano Price (ADA) Analysis In the past few weeks, Cardano’s price started a steady increase above the %excerpt%.485 resistance zone against the US Dollar. The ADA/USD pair gained pace for a move above the %excerpt%.500 and %excerpt%.520
Topics:
Aayush Jindal considers the following as important: ADA, Altcoin News, Cardano, News, Trading
This could be interesting, too:
Emily John writes GRVT Launches Alertatron Trading Event and Airdrop Before TGE
Bilal Hassan writes Coinbase Expands in Nigeria with Onboard Global Partnership
Guest User writes XRP Price Faces Potential Drop: Leading KOL Warns of Imminent Correction with TD Sequential Sell Signal!
Bilal Hassan writes Bitget Expands in South Africa with Callpay Integration
- ADA price started a downside correction from the $0.538 zone against the US Dollar.
- The price is now trading below $0.52 and the 55 simple moving average (4 hours).
- There was a break below a major bullish trend line with support near $0.500 on the 4-hour chart (data feed via Coinbase).
- The price could start a fresh increase if it clears the $0.510 and $0.520 resistance levels.
Cardano’s price is consolidating above $0.4650 against the US Dollar, like Bitcoin. ADA price could resume its rally if there is a clear move above the $0.520 resistance.
Cardano Price (ADA) Analysis
In the past few weeks, Cardano’s price started a steady increase above the $0.485 resistance zone against the US Dollar. The ADA/USD pair gained pace for a move above the $0.500 and $0.520 levels.
The price tested the $0.538 zone. The recent high was formed near $0.5376 and the price corrected lower. There was a move below the $0.520 support zone. The price dipped below the 50% Fib retracement level of the upward move from the $0.4473 swing low to the $0.5376 high.
There was a break below a major bullish trend line with support near $0.500 on the 4-hour chart. ADA price is now trading below $0.520 and the 55 simple moving average (4 hours).
On the upside, immediate resistance is near the $0.510 zone. The next major resistance is near the $0.520 zone. A clear move above the $0.520 resistance might start a strong increase toward $0.538. Any more gains above the $0.538 resistance might send the price toward the $0.565 resistance or even $0.600.
On the downside, immediate support is near the $0.480 level. The next major support is near the $0.4680 level or the 76.4% Fib retracement level of the upward move from the $0.4473 swing low to the $0.5376 high.
A clear move below the $0.468 level might send the price toward the $0.4350 level. Any more losses might send the price toward the $0.4120 support.
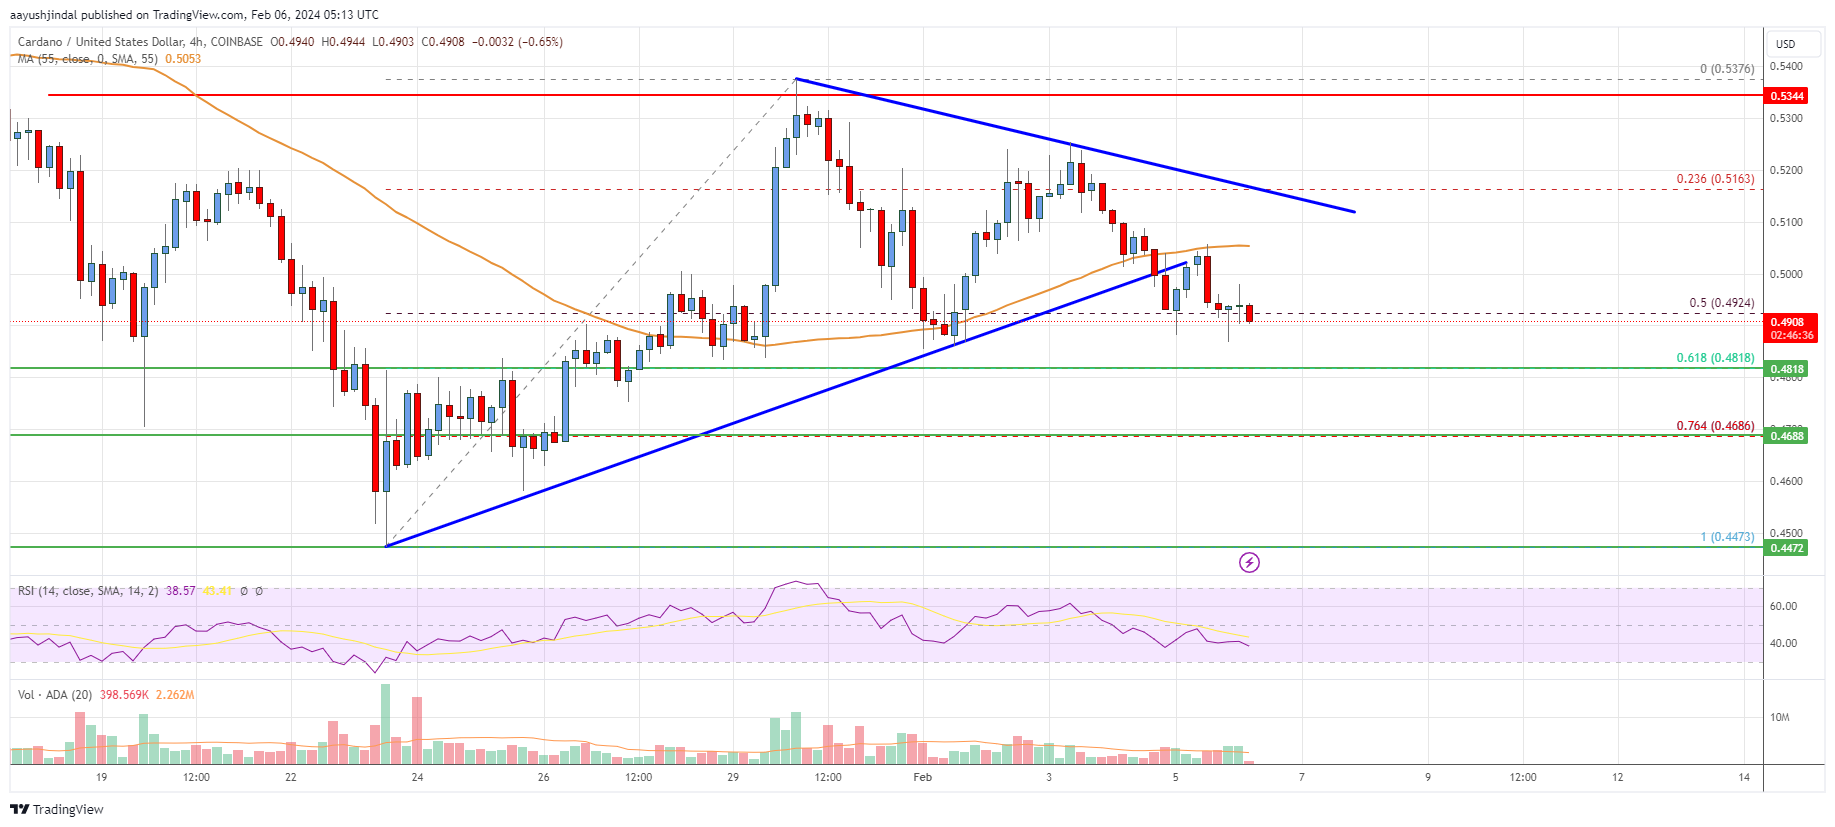
The chart indicates that ADA price is now trading below $0.520 and the 55 simple moving average (4 hours). Overall, the price could gain bullish momentum if it clears the $0.510 and $0.520 resistance levels.
Technical Indicators
4 hours MACD – The MACD for ADA/USD is now gaining pace in the bearish zone.
4 hours RSI – The RSI for ADA/USD is now below the 50 level.
Key Support Levels – $0.480 and $0.468.
Key Resistance Levels – $0.510 and $0.520.