BNB is under strong bearish watch across trading pairs, but it may halt at key demand areas.Despite the considerable price dumps, BNB remains the 9th largest cryptocurrency in terms of market cap.If BNB fails to bounce back at immediate support, a big sell action can be expected.BNB/USD: BNB Signaled Mid-Term Bearish After Breaching Crucial Support Key Resistance Levels: .5, Key Support Levels: .3, BNB/USD. Source: TradingViewThe last three days caused a lot of panic selling for Binance Coin due to the latest recession in the entire crypto market. Following these drops, BNB had lost almost 30% in two weeks.Under 24-hours alone, BNB’s price dropped by 10.44% against the US Dollar and, at the same time, trading around at the time of writing. The price has fallen below
Topics:
Michael Fasogbon considers the following as important: Binance Coin (BNB) Price, Price Analysis
This could be interesting, too:
Chayanika Deka writes Osprey Funds Launches First US Publicly Quoted BNB Trust
Chayanika Deka writes BNB Overtakes Solana to Secure 5th Spot by Market Cap After Historic Rally
CryptoVizArt writes ETH’s Path to K Involves Maintaining This Critical Support (Ethereum Price Analysis)
Dimitar Dzhondzhorov writes Binance to Temporarily Suspend Deposits and Withdrawals on BNB Smart Chain Soon: Here’s Why
- BNB is under strong bearish watch across trading pairs, but it may halt at key demand areas.
- Despite the considerable price dumps, BNB remains the 9th largest cryptocurrency in terms of market cap.
- If BNB fails to bounce back at immediate support, a big sell action can be expected.
BNB/USD: BNB Signaled Mid-Term Bearish After Breaching Crucial Support
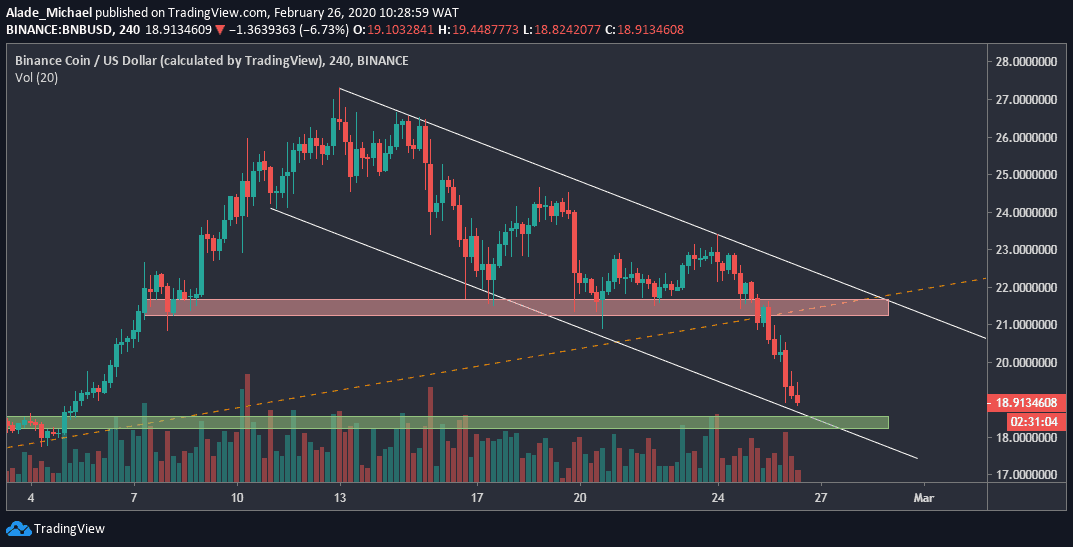
Key Resistance Levels: $21.5, $23
Key Support Levels: $18.3, $17
The last three days caused a lot of panic selling for Binance Coin due to the latest recession in the entire crypto market. Following these drops, BNB had lost almost 30% in two weeks.
Under 24-hours alone, BNB’s price dropped by 10.44% against the US Dollar and, at the same time, trading around $19 at the time of writing. The price has fallen below mid-term diagonal support – the orange-dotted line on the 4-hours chart.
BNB fell below a psychological level of $20 to where it’s nearly testing a four-week demand zone of $18.3 – the green support area on the chart.
The most important thing here is that Binance Coin dropped to a two-week channel’s support to indicate a possible retracement. If BNB fails to retest the red resistance area, a steep drop could trigger a heavy dump.
Binance Price Analysis
Looking at the 4-hours time frame, the BNB/USD pair is under a strong bearish radar with an ongoing huge sell. Though, the bearish pressure should exhaust soon at the green demand area of $18.3.
From here, BNB could recover a bit back to $21.5 to touch the red resistance zone before resuming bearish. If the price increases above the orange-dotted line, especially breaking up the descending channel, buying spower can get the price straight to $27 – the current 2020 high. However, the critical resistance here is $23.
In case selling pressure extends beyond $18.3, the next support would be $17, right under the channel.
BNB/BTC: There’s A Key Rebound Level For BNB/BTC Pair At 0.0020SAT level
Key Resistance Levels: 0.0023BTC, 0.00246BTC, 0.00257BTC
Key Support Levels: 0.0020BTC, 0.00192BTC, 0.0018BTC
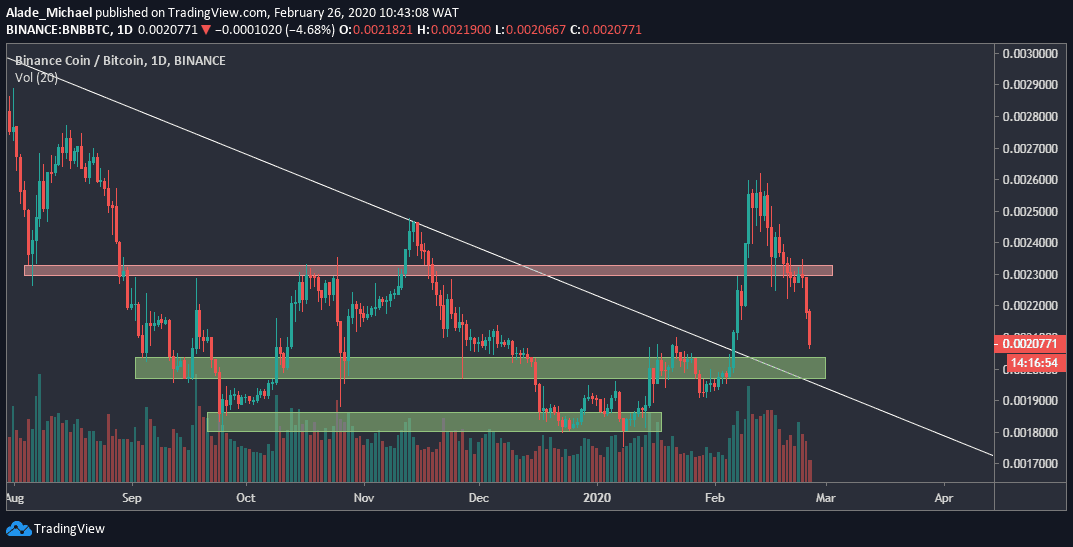
Binance Coin is currently down by 6.15% against Bitcoin. Following this latest price cuts, BNB is now changing hands around 0.00207BTC level. The weekly short opening has caused a lot of FUD over the past days.
From a technical perspective, BNB/BTC pair is expected to bounce back as soon as the price corrects to the big demand area of 0.0020BTC level, the first green area on the daily chart.
Considering the early February breakout above the 7-month resistance line, the major correction is quite healthy for the growth of this market. However, it would become terrible if BNB falls back under this white line.
If BNB manages to bounce from the 0.0020BTC level, the buyers would need to reclaim the red resistance area of 0.0023BTC before we can confirm a short-term bullish. As of now, the bears are still showing commitment.
Binance Coin Price Analysis
BNB is almost reaching a key demand area of 0.0020BTC, the first green area on the daily chart. We can expect the BNB/BTC pair to bounce back from here. If a rebound occurs, the closest resistance to keep an eye on is the red weekly resistance area of 0.0023BTC.
Reclaiming this resistance should provide more buying opportunities to 0.00246BTC and 0.00257BTC resistance before breaking higher.
If 0.0020BTC fails to suppress bearish pressure, however, BNB could collapse to five-month support of 0.0018BTC, although there’s mild support (0.00192BTC) along the way. If this happens, BNB would be trapped back in a long-term bearish.